 Open Access Article
Sonochemistry-enabled uniform coupling of SnO2 nanocrystals with graphene sheets as anode materials for lithium-ion batteries†
Xiaoyan Han a,
Ran Lib,
Shengqiang Qiub,
Xiaofang Zhanga,
Qing Zhang*ac and
Yingkui Yang
 abc
abc
aKey Laboratory of Resources Green Conversion and Utilization of State Ethnic Affairs Commission & Ministry of Education, South-Central University for Nationalities, Wuhan 430074, China. E-mail: qingzhang@mail.scuec.edu.cn
bSchool of Materials Science and Engineering, Hubei University, Wuhan 430062, China
cHubei Engineering Technology Research Centre for Energy Polymer Materials, School of Chemistry and Materials Science, South-Central University for Nationalities, Wuhan 430074, China
First published on 18th February 2019
Abstract
SnO2/graphene nanocomposite was successfully synthesized by a facile sonochemical method from SnCl2 and graphene oxide (GO) precursors. In the sonochemical process, the Sn2+ is firstly dispersed homogeneously on the GO surface, then in situ oxidized to SnO2 nanoparticles on both sides of the graphene nanosheets (RGO) obtained by the reduction of GO under continuous ultrasonication. Graphene not only provides a mechanical support to alleviate the volume changes of the SnO2 anode and prevent nanoparticle agglomeration, but also serves as a conductive network to facilitate charge transfer and Li+ diffusion. When used as a lithium ion battery (LIB) anode, the SnO2/graphene nanocomposite exhibits significantly improved specific capacity (1610 mA h g−1 at 100 mA g−1), good cycling stability (retaining 87% after 100 cycles), and competitive rate performance (273 mA h g−1 at 500 mA g−1) compared to those of bare SnO2. This sonochemical method can be also applied to the synthesis of other metal-oxide/graphene composites and this work provides a large-scale preparation route for the practical application of SnO2 in lithium ion batteries.
Introduction
Lithium ion batteries (LIBs) have been intensively used in portable electronics, electric vehicles (EVs), and intelligent power grids due to their superior advantages such as long cycle life, high energy density, environmental friendliness and no memory effect.1–4 Electrode materials play a critical role on electrochemical performance of LIBs. Among various anode materials, transition-metal oxides have been widely investigated for their abundant resources and high specific capacity. Unfortunately, they all endure dramatic volume change during the lithiation/delithiation process, resulting in pulverization and flaking off of active materials, thus leading to rapid capacity decay.5,6 Among various transition metal oxides, SnO2 is considered as one of the most promising electrode material due to its high theoretical capacity (782 mA h g−1), low discharge potential (<1.5 V), environmental benignity and low-cost.7–9 However, the electrochemical performance of bare SnO2 is unsatisfactory for large volume change (∼300%), low electronic conductivity, and poor transport kinetics.10–13To alleviate volume change during lithiation/delithiation process and enhance structural stability of SnO2, an effective strategy is to design nanostructured SnO2.14–17 However, the agglomeration of nanostructured SnO2 during the cycling process usually leads to fast capacity attenuation.18,19 Recently, nanocomposites have drawn wide attention for their superiorities to integrate multiple properties of different nanoscale building blocks to improve mechanical and electronic properties.20–24 Particularly, graphene-based nanocomposites with metal, metal oxides or polymers have also demonstrated particular mechanical, electronic, electrochemical and catalytic properties.25–28 Hence, various SnO2/graphene nanocomposites with enhanced electrochemical performance have been fabricated, in which graphene supplies a mechanical support to prevent volume changes and enhances electrical conductivity of composites.29–31 In addition, flexible graphene support with high surface area, porosity, electrical conductivity and chemical inertness can prevent nanoparticle agglomeration to achieve a stable electrode structure and provide good electric conductivity for the composite.32–34
Various methods have been used to prepare SnO2/graphene nanocomposites and each method has its own merits and demerits. For example, Lee et al. prepared SnO2/3D graphene hybrid material by a simple hydrothermal process,35 Wang and co-workers developed a ternary self-assembly approach to construct layered SnO2-graphene nanocomposites,36 and Zhang's group synthesized SnO2@graphene nanocomposites via a wet mechanochemical method.37 Compared to these reported methods, sonochemical methods are more favorable for the construction of nanostructures without involving any surfactants and complex processes, and the morphology and particle size can be regulated by ultrasonic waves.38–41 In fact, the basic principle of sonochemistry method is the acoustic cavitation phenomenon in a liquid, which arises high temperature and pressure, and high cooling rate instantaneously during the cavitation process.38,41 Such extreme conditions can trigger the formation of metal oxides on a nanometer scale with homogeneous particle size distribution.42–45 Herein, SnO2/graphene nanocomposite (SnO2/RGO) was synthesized via a simple and effective sonochemical method using SnCl2 and graphene oxide (GO) as precursors. When used as a LIBs anode, the as-prepared SnO2/RGO nanocomposite displays large specific capacity (1610 mA h g−1 at 100 mA g−1), good cycling performance (87% retention after 100 cycles) and competitive rate capability (273 mA h g−1 at 500 mA g−1).
Experimental
Synthesis of SnO2/RGO nanocomposite
Graphene oxide (GO) was prepared from graphite powders (>95%) according to a modified Hummer's method.46 SnO2/graphene nanocomposite was synthesized by a sonochemical method using SnCl2 and GO as precursors. Firstly, ethanol aqueous solution (1![[thin space (1/6-em)]](https://www.rsc.org/images/entities/char_2009.gif) :
:![[thin space (1/6-em)]](https://www.rsc.org/images/entities/char_2009.gif) 1 mol) and SnCl2 (1‰ mol) were added into the GO aqueous solution under vigorous stirring to obtain uniform mixture. After stirring for 30 min, the mixture was then transferred into a wrapped beaker by ultrasonic irradiation at 50 °C for 3 h under ultrasonic power of 400 W in a bath sonicator. The resulting dark-grey precipitate was collected by centrifugation, washed and then dried at 80 °C under vacuum overnight. Finally, the product was heated at 550 °C for 3 h in argon gas with a heating rate of 5 °C min−1. The resulting products with 0 wt% and 30 wt% of GO were marked as bare SnO2 and SnO2/RGO nanocomposite, respectively. RGO was obtained from GO by the same heat treatment conditions.
1 mol) and SnCl2 (1‰ mol) were added into the GO aqueous solution under vigorous stirring to obtain uniform mixture. After stirring for 30 min, the mixture was then transferred into a wrapped beaker by ultrasonic irradiation at 50 °C for 3 h under ultrasonic power of 400 W in a bath sonicator. The resulting dark-grey precipitate was collected by centrifugation, washed and then dried at 80 °C under vacuum overnight. Finally, the product was heated at 550 °C for 3 h in argon gas with a heating rate of 5 °C min−1. The resulting products with 0 wt% and 30 wt% of GO were marked as bare SnO2 and SnO2/RGO nanocomposite, respectively. RGO was obtained from GO by the same heat treatment conditions.
In this work, a sonochemical method was employed to synthesize SnO2/RGO nanocomposite by using SnCl2 as reducing agent and graphene oxide (GO) as oxidizing agent. The possible reaction mechanism is proposed according to the following equations:37
| SnCl2 + H2O ↔ Sn(OH)Cl + HCl | (1) |
| Sn(OH)Cl + GO → SnO2/graphene + HCl | (2) |
In the sonochemical reaction, SnCl2 is firstly hydrolyzed to Sn(OH)Cl as shown in reaction (1), subsequently Sn(OH)Cl is oxidized to SnO2 and GO is reduced to graphene (RGO) under continuous ultrasonic forces. As shown in Fig. 1, Sn(OH)Cl can be dispersed homogeneously on the surface of two-dimensional graphene nanosheets in ethanol solution under constant ultrasonication. The ultrasound treatment triggers the redox reaction between SnCl2 and GO, and in situ synthesis of SnO2 nanoparticles onto the graphene surface.
Measurements
X-ray diffraction (XRD) were performed on a Bruker D8-advance diffractometer with a Ni filter and Cu Kα radiation. Scanning electron microscopy (SEM) was observed by using a Hitachi SU8010 microscope. Transmission electron microscopy (TEM) was implemented by a Tecnai G2 20 S-TWIN microscopy at 200 kV. Fourier transform infrared spectroscopy (FT-IR) spectra were recorded on a Nicolet AVATAR-360 spectrometer. Raman spectra were performed on a DXR Raman microscope excited (Thermo Scientific) by 514 nm. Thermogravimetric analysis (TGA) curves were taken on a thermogravimetric analyzer (NETZSCH, TG209F3) from 40 to 800 °C at 20 °C min−1 in air atmosphere. X-ray photoelectron spectroscopy (XPS) spectra of the samples were recorded on a Thermo MultiLab 2000 X-ray photoelectron spectrometer.The electrochemical performance was carried out using a 2032-type coin cells (CR2032). A lithium foil was used as the counter electrode and a Celgard-2400 microporous membrane was used as the separator. The working electrode consists of 80 wt% active material, 10 wt% acetylene black and 10 wt% polyvinylidene fluoride (PVDF) binder. A copper foil acted as the current collector. 1.0 M LiPF6 solution dissolved in ethylene carbonate (EC) and dimethylcarbonate (DMC) (1![[thin space (1/6-em)]](https://www.rsc.org/images/entities/char_2009.gif) :
:![[thin space (1/6-em)]](https://www.rsc.org/images/entities/char_2009.gif) 1, v/v) was used as the electrolyte. The cells were assembled in an argon-filled glove box. The galvanostatic discharge/charge tests were studied between 0.001 and 2.0 V versus Li+/Li on a multichannel battery testing system (LAND CT2001A). Cyclic voltammetry (CV) experiments and electrochemical impedance spectroscopy (EIS) were performed on an electrochemical working station (CHI770E) using model cells. CV were recorded at scan rate of 0.2 mV s−1 in the potential range of 0.001–2.0 V. EIS was examined in a frequency range from 0.01 Hz to 100 kHz under AC amplitude of 5 mV.
1, v/v) was used as the electrolyte. The cells were assembled in an argon-filled glove box. The galvanostatic discharge/charge tests were studied between 0.001 and 2.0 V versus Li+/Li on a multichannel battery testing system (LAND CT2001A). Cyclic voltammetry (CV) experiments and electrochemical impedance spectroscopy (EIS) were performed on an electrochemical working station (CHI770E) using model cells. CV were recorded at scan rate of 0.2 mV s−1 in the potential range of 0.001–2.0 V. EIS was examined in a frequency range from 0.01 Hz to 100 kHz under AC amplitude of 5 mV.
Results and discussion
The morphology and microstructure were elucidated by SEM and TEM. Fig. 2a shows distinct lamellar structure of GO sheets, which contains a few layers. Bare SnO2 consists of monodispersed nanoparticles with an average particle size of about 10 nm, which shows obviously agglomeration (Fig. 2b). In contrast, SnO2 nanoparticles are well adhered on the surface of RGO nanosheets in the nanocomposite as shown in Fig. 2c and d. Due to the electrostatic interaction between SnO2 and residual oxygen-containing groups in RGO, the sonochemical process can effectively inhibit the aggregation of SnO2 nanoparticles and realize the uniform distribution of SnO2 on the surface of RGO sheets.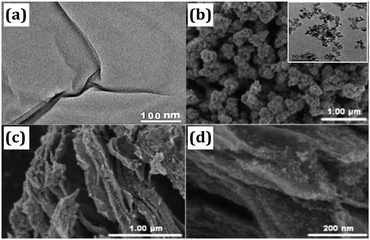 | ||
| Fig. 2 (a) TEM image of GO. (b) SEM image of bare SnO2. (c and d) SEM images of SnO2/RGO. The inset in (b) shows a TEM image of bare SnO2. | ||
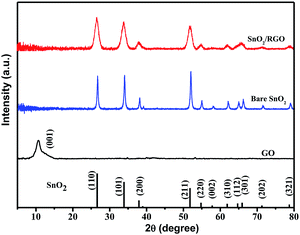
XRD patterns of GO, bare SnO2 and SnO2/RGO are given in Fig. 3. GO displays only one broad peak located at 10.8°, indexing to the (001) plane of GO with an interlayer distance of 8.18 Å.47 Bare SnO2 and SnO2/RGO exhibit similar diffraction peaks, which are well indexed to the pure SnO2 (JCPDS no. 41-1445), indicating that the reduction of GO does not affect the crystal structure of SnO2. However, the typical stacking peak of graphene nanosheets located at 26° is also absent in the pattern of SnO2/RGO nanocomposite. This indicates that SnO2 particles are formed on the both sides of RGO nanosheets, which prevents graphene sheets from restacking.48 In addition, compared to sharp diffraction peaks of SnO2, SnO2/RGO nanocomposite displays broader XRD peaks, which is attributed to the decrease of particle size (bare SnO2: 10.8 nm, SnO2/RGO: 7.8 nm, calculated by Scherrer formula: D = Kλ/B![[thin space (1/6-em)]](https://www.rsc.org/images/entities/char_2009.gif) cos
cos![[thin space (1/6-em)]](https://www.rsc.org/images/entities/char_2009.gif) θ), suggesting that the growth of SnO2 nanoparticles on the surface of RGO nanosheets can prevent nanoparticles agglomeration. Furthermore, no other peaks can be observed, indicating the complete transformation of SnCl2 into SnO2 upon sonochemical and heat treatment process.
θ), suggesting that the growth of SnO2 nanoparticles on the surface of RGO nanosheets can prevent nanoparticles agglomeration. Furthermore, no other peaks can be observed, indicating the complete transformation of SnCl2 into SnO2 upon sonochemical and heat treatment process.
Fig. 4a shows FT-IR spectra of bare SnO2, GO and SnO2/RGO. FT-IR spectrum of GO is in good agreement with previous works.49 GO shows the O–H deformation peak at 1401 cm−1, the O–H stretching vibrations peak at 3420 cm−1 and the C![[double bond, length as m-dash]](https://www.rsc.org/images/entities/char_e001.gif) O stretching vibrations peak at 1735 cm−1. The peaks at 1624, 1220, and 1052 cm−1 are due to C
O stretching vibrations peak at 1735 cm−1. The peaks at 1624, 1220, and 1052 cm−1 are due to C![[double bond, length as m-dash]](https://www.rsc.org/images/entities/char_e001.gif) C bending vibrations, C–OH stretching vibrations, and C–O stretching vibrations, respectively. Those peaks weaken or almost disappear for the SnO2/RGO nanocomposite, implying that GO is completely reduced to RGO nanosheets during the formation of nanocomposite. Additionally, a strong peak at 624 cm−1 is assigned to Sn–O stretching vibrations, confirming the presence of SnO2 in the composite.48,49 The FT-IR results confirm the reduction of GO and the oxidation of Sn2+ to SnO2, suggesting the formation of SnO2/RGO nanocomposite.
C bending vibrations, C–OH stretching vibrations, and C–O stretching vibrations, respectively. Those peaks weaken or almost disappear for the SnO2/RGO nanocomposite, implying that GO is completely reduced to RGO nanosheets during the formation of nanocomposite. Additionally, a strong peak at 624 cm−1 is assigned to Sn–O stretching vibrations, confirming the presence of SnO2 in the composite.48,49 The FT-IR results confirm the reduction of GO and the oxidation of Sn2+ to SnO2, suggesting the formation of SnO2/RGO nanocomposite.
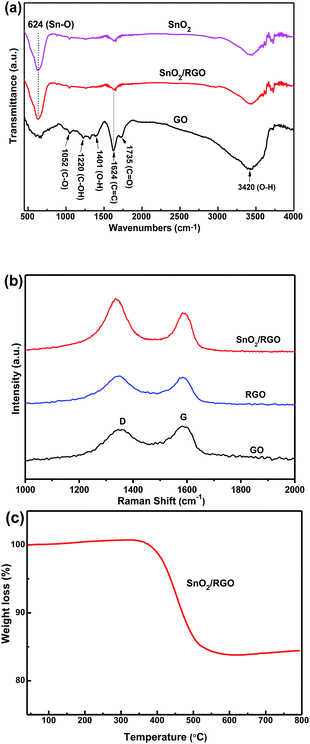 | ||
| Fig. 4 (a) FT-IR of GO, bare SnO2, and SnO2/RGO nanocomposite. (b) Raman spectra of GO, RGO, and SnO2/RGO nanocomposite. (c) TGA curve of SnO2/RGO nanocomposite in air atmosphere. | ||
Fig. 4b gives Raman spectra of GO, RGO and SnO2/RGO. The peaks at 1588 and 1344 cm−1 correspond to the G and D band, respectively. The G band is related to the presence of isolated double bonds in a 2-dimensional hexagonal lattice, while the D band is linked with the defects and disorder in the hexagonal graphitic layers. The relative intensity ratio of D to G bands (ID/IG) can represent the reduction degree of carbonaceous materials. The defect density is calculated to be 2.0 for SnO2/RGO nanocomposite, larger than that of GO (0.9) and RGO (1.0). This enhancement of defect density could be ascribed to the exfoliation and reduction of GO with the attachment of SnO2 nanoparticles on the surface.50
To obtain the content of RGO in the composite, thermogravimetric analysis (TGA) was measured under air as shown in Fig. 4c. In general, the negligible weight loss below 400 °C is attributed to adsorbed water molecules and oxygen-containing groups of graphene in the sample. The significant weight loss between 400 and 600 °C is attributed to the complete combustion of carbon components from RGO. Above 600 °C, the weight of the sample is constant, indicating that the combustion is completed and only SnO2 is left. The weight loss of SnO2/RGO nanocomposite is 18.2% (RGO component), which is different from pre-designed feed ratio of GO (30%). This deviation can be ascribed to the loss of oxygen-containing groups in GO during thermal reduction process.
XPS was further employed to confirm the reduction of GO and formation of SnO2 during the sonochemical process. Fig. 5a shows the survey spectra of GO, bare SnO2 and SnO2/RGO. The spectrum of GO only shows two distinguishable peaks of carbon (C 1s, 285 eV) and oxygen (O 1s, 530 eV). In contrast, the spectrum of SnO2/RGO shows all the peaks of desired carbon, oxygen and SnO2. The Sn 3d peaks of SnO2/RGO (Fig. 5b) could be resolved into 487.0 and 495.4 eV with an 8.4 eV peak-to-peak separation, corresponding to Sn 3d5/2 and Sn 3d3/2, respectively, which are consistent with the previous reports about SnO2/C composites.48,51 Additionally, the peaks of C 1s spectra of SnO2/RGO and GO could be resolved into four binding energies (Fig. 5c and d), corresponding to four types of carbon atoms (C–C/C![[double bond, length as m-dash]](https://www.rsc.org/images/entities/char_e001.gif) C: 284.7 eV, C–O: 286.7 eV, C
C: 284.7 eV, C–O: 286.7 eV, C![[double bond, length as m-dash]](https://www.rsc.org/images/entities/char_e001.gif) O: 288.7 eV, and O–C
O: 288.7 eV, and O–C![[double bond, length as m-dash]](https://www.rsc.org/images/entities/char_e001.gif) O: 289.6 eV). The C–C/C
O: 289.6 eV). The C–C/C![[double bond, length as m-dash]](https://www.rsc.org/images/entities/char_e001.gif) C content in SnO2/RGO (77.8%) is larger than that of GO (36.7%). Meanwhile, C–O amount in SnO2/RGO declines sharply due to successful removal of oxygen-containing groups in GO, which further confirms the completely reduction of GO.
C content in SnO2/RGO (77.8%) is larger than that of GO (36.7%). Meanwhile, C–O amount in SnO2/RGO declines sharply due to successful removal of oxygen-containing groups in GO, which further confirms the completely reduction of GO.
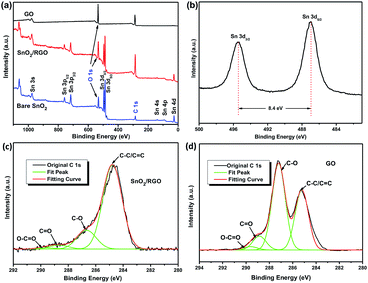 | ||
| Fig. 5 (a) XPS spectra of GO, bare SnO2 and SnO2/RGO. (b) Sn 3d XPS spectra of SnO2/RGO. C 1s XPS spectra of (c) SnO2/RGO and (d) of GO. | ||
Fig. 6a shows CV curves of SnO2/RGO for the first three cycles. It has been established that two-step reactions are involved in the SnO2-based electrodes:
| SnO2 + 4Li+ + 4e− → Sn + 2Li2O | (3) |
| Sn + xLi+ + xe− ↔ LixSn (0 ≤ x ≤ 4.4) | (4) |
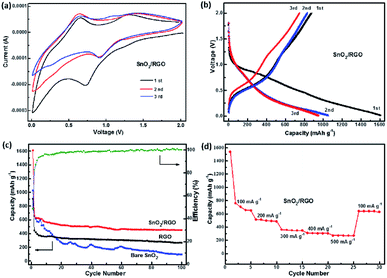
There is an obvious cathodic peak at 0.72 V in the first cycle of the SnO2/RGO, which is attributed to the reduction of SnO2 to metallic Sn and formation of amorphous Li2O as indicated in reaction (3) as well as the formation of solid electrolyte interphase (SEI).31,50 The broad cathodic peak at about 0.25 V and anodic peak at about 0.65 V correspond to reversible reaction as indicated in reaction (4). The anodic peak at about 1.32 V represents partial reversibility of the reaction as shown in reaction (3).31 The CV curves of the second and third cycles are almost overlapped, implying an excellent cycling stability and reversibility of the SnO2/RGO. Furthermore, charge/discharge profiles of the SnO2/RGO are displayed in Fig. 6b. There appears two discharge plateaus around 0.8 V and 0.3 V in the first discharge process, originating from the formation of SEI film and alloying of LixSn. A charge plateau at 1.2 V in the first cycle is linked with dealloying of LixSn,13 which is consistent with the oxidation–reduction peaks of CV curves. The initial discharge and charge capacities of the SnO2/RGO electrode are 1610 and 765 mA h g−1, respectively. This large initial irreversible loss (52%) is common for SnO2 materials, which could be assigned to the irreversible transformation reaction as described in eqn (3) and the formation of solid electrolyte interphase (SEI) film.
Fig. 6c compares the cycling performances of SnO2/RGO with bare SnO2 and RGO. Apparently, bare RGO shows good cycling stability but low reversible capacity. After 100 cycles, the discharge capacity decreases to 263 mA h g−1. Even though bare SnO2 delivers a high discharge capacity (1024 mA h g−1), but the capacity tends to decay quickly to below 95 mA h g−1 after 100 cycles. In contrast, the cycling performance of SnO2/RGO electrode is substantially improved. Although there is still some capacity decay within the initial 20 cycles, the capacity of SnO2/RGO tends to level off in following cycles. It is important to note that SnO2/RGO delivers initial discharge capacity as high as 1610 mA h g−1 and a reversible capacity of 450 mA h g−1 can be retained over 100 cycles (C100th/C20th = 87%) with the coulombic efficiency of 100%. These results indicate that SnO2/RGO shows improved cycling stability and higher reversible capacity than bare SnO2. Moreover, to fully estimate the electrochemical performance of SnO2/RGO electrode, the rate performance at current densities of 100, 200, 300, 400 and 500 mA g−1 are also shown in Fig. 6d. As the current density increases from 100 to 500 mA g−1, the reversible capacity varies from 650 to 512, 360, 311 and 273 mA h g−1, respectively. Additionally, when the current density returns to 100 mA g−1, a reversible capacity of 639 mA h g−1 is recovered, thus demonstrating a competitive rate capability compared to the previously reported SnO2-based composites as shown in Table S1.†52–55 The above results show that the introducing of graphene nanosheets combines the respective advantages of SnO2 and RGO, thus greatly enhances the overall electrochemical capacity and cycling stability of the SnO2/RGO. In order to investigate the influence of GO content on the electrochemical performance of the composite, we also synthesized a series of SnO2/RGO nanocomposites with various component ratios via regulating the feeding ratios of GO and SnCl2 in the sonochemical reaction systems as shown in Fig. S1.† Considering that large amounts of graphene would in turn inevitably reduce the energy density of finished batteries, thus SnO2/RGO (30 wt%) is considered to exhibit the best comprehensively electrochemical performance.
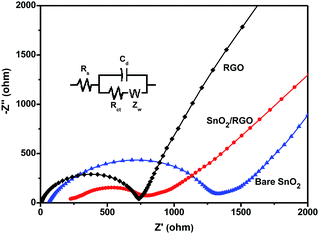
EIS measurements were performed for the bare SnO2, RGO, and SnO2/RGO electrode to further elucidate the influence of graphene nanosheets on the electrochemical behavior of the composite (Fig. 7). The inset is the equivalent circuit used for fitting the impedance spectrum. Rs represents the ohmic resistance from the system and Cd is the double-layer capacity.28 In the Nyquist plots, a semicircle in higher frequency region and an inclined line of approximately 45° slope at lower frequency region were observed for all materials. The semicircle can be ascribed to charge transfer resistance (Rct) at the interface between the electrolyte and electrode, while the inclined line corresponds to Li+ diffusion process in the bulk of the electrode and represents the Warburg impedance (W).48 The values of Rct for the bare SnO2, RGO and SnO2/RGO are calculated to be 1088, 597, and 464 Ω, respectively. Apparently, SnO2/RGO shows smaller Rct than that of bare SnO2, which is ascribed to the enhanced electronic conductivity provided by the graphene substrate. Moreover, the high slope of inclined line for SnO2/RGO is a characteristic of low Zw, suggesting fast Li+ diffusion in the composite electrode. The results confirm that the presence of graphene nanosheets indeed facilitates charge transfer and Li+ diffusion during the electrochemical lithiation/delithiation process, which accounts for the enhanced electrochemical performance.
Conclusions
In conclusion, a facile sonochemical method has been developed to synthesize SnO2/RGO nanocomposite by in situ oxidizing SnCl2 to SnO2 and reducing GO to RGO. The individual dispersed SnO2 nanoparticles are fully well-adhered on the both sides of graphene nanosheets. This unique structure results in high specific surface area, stable framework, and remarkable electron and ion transport, thereby resulting in a superior electrochemical performance. When used as LIBs anode, SnO2/RGO delivers initial discharge specific capacity as high as about 1610 mA h g−1, with the initial coulombic efficiency of about 48%. Moreover, the SnO2/RGO electrode shows good cycling stability, about 87% of the capacity is maintained (C100th/C20th) after 100 cycles at 100 mA g−1. Additionally, the SnO2/RGO electrode shows a competitive rate performance. A capacity of 273 mA h g−1 can be retained at a high current density up to 500 mA g−1, and 639 mA h g−1 can still be recovered once the current density is returned to 100 mA g−1. This facile sonochemical method can be also applied to the synthesis of other graphene/metal-oxide composites and this work provides a large-scale preparation route for the practical application of SnO2 in lithium ion batteries.Conflicts of interest
There are no conflicts to declare.Acknowledgements
This work was supported by the National Natural Science Foundation of China (No. 21503282 and 51673061), and the Fundamental Research Funds for the Central Universities, South-Central University for Nationalities (CZQ19003).Notes and references
- J.-M. Tarascon and M. Armand, Nature, 2001, 414, 359 CrossRef CAS PubMed.
- Y. G. Guo, J. S. Hu and L. J. Wan, Adv. Mater., 2008, 20, 2878 CrossRef CAS.
- J. B. Goodenough and K. S. Park, J. Am. Chem. Soc., 2013, 135, 1167 CrossRef CAS PubMed.
- D. B. Xiong, X. F. Li, Z. M. Bai and S. G. Lu, Small, 2018, 14, 1703419 CrossRef PubMed.
- D. Zhou, W. L. Song, X. G. Li and L. Z. Fan, Electrochim. Acta, 2016, 207, 9 CrossRef CAS.
- Q. H. Tian, Y. Tian, Z. X. Zhang, L. Yang and S. Hirano, J. Power Sources, 2015, 280, 397 CrossRef CAS.
- D. N. Wang, J. L. Yang, X. F. Li, D. S. Geng, R. Y. Li, M. Cai, T. K. Sham and X. L. Sun, Energy Environ. Sci., 2013, 6, 2900 RSC.
- K. Kravchyk, L. Protesescu, M. I. Bodnarchuk, F. Krumeich, M. Yarema, M. Walter, C. Guntlin and M. V. Kovalenko, J. Am. Chem. Soc., 2013, 135, 4199 CrossRef CAS PubMed.
- J. Liang, X. Y. Yu, H. Zhou, H. B. Wu, S. J. Ding and X. W. Lou, Angew. Chem., Int. Ed., 2014, 53, 12803 CrossRef CAS PubMed.
- L. Zhang, G. Zhang, H. B. Wu, L. Yu and X. W. Lou, Adv. Mater., 2013, 25, 2589 CrossRef CAS PubMed.
- C. Guan, X. H. Wang, Q. Zhang, Z. X. Fan, H. Zhang and H. J. Fan, Nano Lett., 2014, 14, 4852 CrossRef CAS PubMed.
- H. K. Wang, J. K. Wang, D. X. Cao, H. Y. Gu, B. B. Li, X. Lu, X. G. Han, A. L. Rogach and C. M. Niu, J. Mater. Chem. A, 2017, 5, 6817 RSC.
- H. Y. Zhang, L. Q. Li, Z. P. Li, W. H. Zhong, H. Y. Liao and Z. H. Li, Appl. Surf. Sci., 2018, 442, 65 CrossRef CAS.
- J. P. Liu, Y. Y. Li, X. T. Huang, R. M. Ding, Y. Y. Hu, J. Jiang and L. Liao, J. Mater. Chem., 2009, 19, 1859 RSC.
- X. M. Yin, C. C. Li, M. Zhang, Q. Y. Hao, S. Liu, L. B. Chen and T. H. Wang, J. Phys. Chem. C, 2010, 114, 8084 CrossRef CAS.
- Z. X. Chen, M. Zhou, Y. L. Cao, X. P. Ai, H. X. Yang and J. Liu, Adv. Energy Mater., 2012, 2, 95 CrossRef CAS.
- W. J. Dong, J. J. Xu, C. Wang, Y. Lu, X. Y. Liu, X. Wang, X. T. Yuan, Z. Wang, T. Q. Lin, M. L. Sui, I. W. Chen and F. Q. Huang, Adv. Mater., 2017, 29, 1700136 CrossRef PubMed.
- J. J. Liang, C. C. Yuan, H. H. Li, K. Fan, Z. X. Wei, H. Q. Sun and J. M. Ma, Nano-Micro Lett., 2018, 10, 21 CrossRef PubMed.
- B. Huang, X. H. Li, Y. Pei, S. Li, X. Cao, R. C. Massé and G. Z. Cao, Small, 2016, 12, 1945 CrossRef CAS PubMed.
- Y. F. Lu, Y. Yang, A. Sellinger, M. C. Lu, J. M. Huang, H. Y. Fan, R. Haddad, G. Lopez, A. R. Burns, D. Y. Sasaki, J. Shelnutt and C. J. Brinker, Nature, 2001, 410, 913 CrossRef CAS PubMed.
- H. Zeng, J. Li, J. P. Liu, Z. L. Wang and S. H. Sun, Nature, 2002, 420, 395 CrossRef CAS PubMed.
- X. F. Zhang, H. Li, W. Zhang, Z. J. Huang, C. P. Tsui, C. H. Lu, C. E. He and Y. K. Yang, Electrochim. Acta, 2019, 301, 55 CrossRef CAS.
- S. Lei, Y. Lu, X. F. Zhang, P. Y. Gao, X. Cui and Y. K. Yang, Chem. Commun., 2019 10.1039/C8CC10186H.
- R. Li, X. L. Dong, C. E. He, Z. X. Liu, L. P. Huang and Y. K. Yang, Int. J. Electrochem. Sci., 2017, 12, 144 CrossRef CAS.
- X. S. Song, X. F. Li, Z. M. Bai, B. Yan, D. B. Xiong, L. X. Lin, H. Zhao, D. J. Li and Y. Y. Shao, Carbon, 2018, 133, 14 CrossRef CAS.
- L. L. Fan, X. F. Li, X. S. Song, N. N. Hu, D. B. Xiong, A. Koo and X. L. Sun, ACS Appl. Mater. Interfaces, 2018, 10, 2637 CrossRef CAS PubMed.
- M. Sahoo and S. Ramaprabhu, Carbon, 2018, 127, 627 CrossRef CAS.
- C. E. He, Y. C. Liang, P. Y. Gao, L. Cheng, D. A. Shi, X. L. Xie, R. K. Y. Li and Y. K. Yang, Composites, Part B, 2017, 121, 68 CrossRef CAS.
- S. M. Paek, E. J. Yoo and I. Honma, Nano Lett., 2009, 9, 72 CrossRef CAS PubMed.
- J. X. Guo, B. Jiang, X. Zhang and H. T. Liu, J. Power Sources, 2014, 262, 15 CrossRef CAS.
- Q. X. Xie, Y. T. Zhu, P. Zhao, Y. F. Zhang and S. H. Wu, J. Mater. Sci., 2018, 53, 9206 CrossRef CAS.
- X. D Huang, X. F. Zhou, L. Zhou, K. Qian, Y. H Wang, Z. P. Liu and C. Z. Yu, ChemPhysChem, 2011, 12, 278 CrossRef PubMed.
- X. F. Li, X. B. Meng, J. Liu, D. S. Geng, Y. Zhang, M. N. Banis, Y. L. Li, J. L. Yang, R. Y. Li, X. L. Sun, M. Cai and M. W. Verbrugge, Adv. Funct. Mater., 2012, 22, 1647 CrossRef CAS.
- X. F. Zhou, W. J. Liu, X. Y. Yu, Y. J. Liu, Y. P. Fang, S. Klankowski, Y. Q. Yang, J. E. Brown and J. Li, ACS Appl. Mater. Interfaces, 2014, 6, 7434 CrossRef CAS PubMed.
- J. I. Lee, J. H. Song, Y. Cha, S. F. Fu, C. Z. Zhu, X. L. Li, Y. H. Lin and M. K. Song, Nano Res., 2017, 10, 4398 CrossRef CAS.
- D. H. Wang, R. Kou, D. Choi, Z. G. Yang, Z. M. Nie, J. Li, L. V. Saraf, D. H. Hu, J. G. Zhang, G. L. Graff, J. Liu, M. A. Pope and I. A. Aksay, ACS Nano, 2010, 3, 1587 CrossRef PubMed.
- S. Li, Y. Z. Wang, C. Lai, J. X. Qiu, M. Ling, W. Martens, H. J. Zhao and S. Q. Zhang, J. Mater. Chem. A, 2014, 2, 10211 RSC.
- J. J. Zhu, Z. H. Lu, S. T. Aruna, D. Aurbach and A. Gedanken, Chem. Mater., 2000, 12, 2557 CrossRef CAS.
- K. G. Lee, J. M. Jeong, S. J. Lee, B. Yeom, M. K. Lee and B. G. Choi, Ultrason. Sonochem., 2015, 22, 422 CrossRef CAS PubMed.
- H. ullah, I. Khan, Z. H. Yamani and A. Qurashi, Ultrason. Sonochem., 2017, 34, 484 CrossRef CAS PubMed.
- V. S. Nalajala and V. S. Moholkar, Ultrason. Sonochem., 2011, 18, 345 CrossRef CAS PubMed.
- K. S. Suslick, S. B. Choe, A. A. Cichowlas and M. W. Grinstaff, Nature, 1991, 353, 414 CrossRef CAS.
- K. Krishnamoorthy, G. S. Kim and S. K. Kim, Ultrason. Sonochem., 2013, 20, 644 CrossRef CAS PubMed.
- A. Abulizi, G. H. Yang and J. J. Zhu, Ultrason. Sonochem., 2014, 21, 129 CrossRef CAS PubMed.
- N. Duraisamy, A. Numan, S. Omar Fatin, K. Ramesh and S. Ramesh, J. Colloid Interface Sci., 2016, 471, 136 CrossRef CAS.
- W. S. Hummers and R. E. Offeman, J. Am. Chem. Soc., 1958, 80, 1339 CrossRef CAS.
- H. Malas and C. K. Das, Composites, Part B, 2015, 79, 639 CrossRef.
- S. Yang, W. B. Yue, J. Zhu, Y. Ren and X. J. Yang, Adv. Funct. Mater., 2013, 23, 3570 CrossRef CAS.
- Y. M. Li, X. J. Lv, J. Lu and J. H. Li, J. Phys. Chem. C, 2010, 114, 21770 CrossRef CAS.
- M. Zhang, D. N. Lei, Z. F. Du, X. M. Yin, L. B. Chen, Q. H. Li, Y. G. Wang and T. H. Wang, J. Mater. Chem., 2011, 21, 1673 RSC.
- G. M. An, N. Na, X. R. Zhang, Z. J. Miao, S. D. Miao, K. L. Ding and Z. M. Liu, Nanotechnology, 2007, 18, 435707 CrossRef.
- M. Sahoo and S. Ramaprabhu, RSC Adv., 2017, 7, 13789 RSC.
- C. Zhu, D. H. Wei, Y. L. Wu, Z. Zhang, G. H. Zhang, J. F. Duan, L. J. Li, H. L. Zhu, Z. Y. Zhu and Z. Y. Chen, J. Alloys Compd., 2019, 778, 731 CrossRef CAS.
- H. G. Li, S. B. Wang, M. J. Feng, J. P. Yang and B. M. Zhang, J. Mater. Sci., 2018, 53, 11607 CrossRef CAS.
- P. Wu, X. L. Xu, Q. Y. Zhu, X. S. Zhu, Y. W. Tang, Y. M. Zhou and T. H. Lu, J. Alloys Compd., 2015, 626, 234 CrossRef CAS.
Footnote |
| † Electronic supplementary information (ESI) available. See DOI: 10.1039/c9ra00554d |
| This journal is © The Royal Society of Chemistry 2019 |


