 Open Access Article
Impact of drying methods on the changes of fruit microstructure unveiled by X-ray micro-computed tomography
Kevin Prawiranto abc,
Thijs Defraeye
 *a,
Dominique Deromec,
Andreas Bühlmannd,
Stefan Hartmanne,
Pieter Verbovenf,
Bart Nicolai
 fg and
Jan Carmelietb
aEmpa, Swiss Federal Laboratories for Materials Science and Technology, Laboratory for Biomimetic Membranes and Textiles, Lerchenfeldstrasse 5, 9014 St. Gallen, Switzerland. E-mail: thijs.defraeye@empa.ch; Fax: +41 58 765 6909; Tel: +41 58 765 4790
bSwiss Federal Institute of Technology Zurich (ETHZ), Chair of Building Physics, Stefano-Franscini-Platz 5, 8093 Zurich, Switzerland
cEmpa, Swiss Federal Laboratories for Materials Science and Technology, Laboratory for Multiscale Studies in Building Physics, Uberlandstrasse 129, 8600 Dübendorf, Switzerland
dAgroscope, Plants and Plant Product Division, Müller-Thurgau-Strasse 29, 8820 Wädenswil, Switzerland
eEmpa, Swiss Federal Laboratories for Materials Science and Technology, Center for X-ray Analytics, Uberlandstrasse 129, 8600 Dübendorf, Switzerland
fKU Leuven – University of Leuven, Division MeBioS, Postharvest Group, Willem de Croylaan 42, 3001 Heverlee, Belgium
gVCBT, Flanders Centre of Postharvest Technology, Willem de Croylaan 42, 3001 Heverlee, Belgium
First published on 4th April 2019
Abstract
A good understanding of the microstructural changes due to dehydration is critical to optimize fruit drying processes. By using X-ray micro-computed tomography, we quantified the changes in porosity, pore diameter, cell sphericity, cell diameter and cell elongation of apple parenchyma tissue during multiple convective drying scenarios: natural convection (air speed = 0.05 m s−1), forced convection (air speed = 0.5 m s−1) and coupled irradiation-convective drying (air speed = 0.05 m s−1 with radiation heating). Drying conditions affected the microstructure noticeably, in particular the formation of an elevated-porosity layer (tissue region where the porosity was higher than the initial porosity) and a deformed-cell layer (tissue region where the sphericity of the cells was lower than 0.75) near the sample surface. Using the combination of Eulerian and Lagrangian approaches, we linked the formation of the aforementioned layers to bulk shrinkage and deformation of individual cells. Forced convective drying resulted in a more porous structure and a higher degree of cell deformation compared to the other drying cases. Meanwhile, the coupled irradiation-convective drying induced the largest bulk shrinkage. The latter was caused by a large reduction in pore volume and the formation of large cell clusters in the deformed-cell layer.
1. Introduction
Drying is one of the most common techniques used to preserve food. The removal of the water that is present in foods restricts microbial growth, thus preventing food spoilage.1,2 In the case of dried fruits, they are also healthy snacks that are rich in nutrients, antioxidants and dietary fiber.3–6 In the food industry, a multitude of drying methods is applied, including solar, convective, freeze, vacuum, osmotic, ohmic or microwave drying.7–9 Among these methods, convective and solar drying are amongst the most commonly applied ones.10–12Drying causes physical and biochemical changes in the fruit tissue. The loss of water is accompanied by shrinkage of the bulk tissue13 and changes in microstructure, including cell collapse, cell shrinkage, cell membrane detachment (plasmolysis) or cell membrane breakage (lysis).14–16 These changes strongly influence the moisture transport properties of the tissue17 and also induce variations in the final product quality. The product texture is influenced for example by the bulk density, porosity, cell size, cell shape and cell wall thickness of the dried product.18–20 The rehydration capacity of the dried product also depends on the degree of shrinkage and porosity.21,22 Biochemical changes in the form of nutrient and color degradation are also observed.23–25
In order to design a drying process that delivers superior quality products, knowledge of the fruit microstructure and its evolution during drying is essential. The aforementioned studies mostly focus on the relations between the final microstructure and quality attributes of the completely dehydrated products. Little is known on how the microstructure changes during drying15,26 and on how these changes should be controlled to get the best final product quality. In the past, some studies analyzed the changes in porosity, as well as of pore and cell size distribution of food products.14,27,28 Recently, a 3D imaging was used to quantify the shrinkage and changes in apple cells diameter, roundness and surface area during drying.29 This study relied on a destructive technique based on light microscopy and could only focus on a limited number of cells. In this context, there is a large potential of X-ray micro-computed tomography (CT) to be used to analyze changes of the 3D microstructure during drying and its impact on the macrostructural changes. This non-destructive technique is emerging in the field of food science.30 It has been successfully utilized to investigate the microstructure characteristics of, amongst others, different apple fruit cultivars,31,32 dried apple,33 frozen apple,34 fried potato,35 dried banana36 and kiwi fruit.37 The application X-ray micro-CT to identify microstructural changes during a dynamic process was recently done,38 in which they investigated the changes of porosity, cell and pore size distribution, as well as cellular water distribution of apple tissue in a convective drying process. However, the impact of the drying methods on the evolution of food microstructure is not known to our best knowledge, even though it is a crucial aspect in determining the food quality.39 Such knowledge can also be used as a basis for improving mechanistic models that enable analyzing morphological changes of cellular food structures during drying, for example, the turgor loss, cell shrinkage, membrane breakage and cell wall wrinkling.17,40–42
The primary objective of this study was to gain a better understanding of the microstructural changes of Braeburn apple parenchyma tissue subjected to different drying methods. To this end, we used in situ X-ray micro-CT to quantify the bulk shrinkage and changes of porosity, cell diameter, cell shape, and pore diameter of apple tissue during drying. Imaging was done continuously during the period of drying. Three common fruit drying methods were compared, namely natural convective, forced convective and coupled irradiation-convective drying. The airflow in the natural convective drying is driven by air density differences, due to temperature variations. The applications of natural convective airflow can be found in indirect-type of solar dryers.10 In a forced convection drying, the airflow is induced by an external force, such as a fan. The applications of forced convective drying are found in commercial oven dryers as well as indirect-type of solar dryers which are equipped with fans.43,44 Coupled irradiation-convective drying occurs in a direct (greenhouse) type of solar dryer.45
2. Materials and methods
2.1. Sample preparation
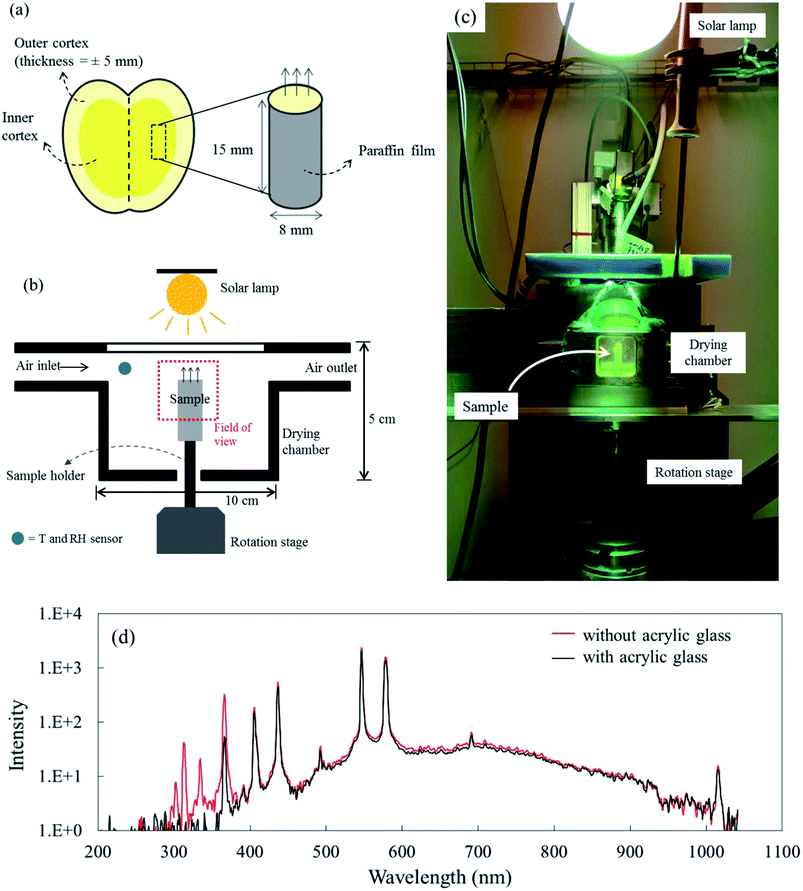
‘Braeburn’ apples (Malus × Domestica cv. Braeburn) were purchased from a local grocery store in Zürich on July 1st, 2017. Prior to the experiments, the apples were stored in a climate-controlled room for two days at a temperature of 25 °C and relative humidity (RH) of 50%. The apples were peeled and cylindrical samples were extracted from the inner cortex using a cork borer (Fig. 1a). A cylindrical shape was used as it was easier to extract from the fruit and the images showed less image artefacts during image reconstruction. The samples had a diameter of 8 mm, a height of 15 mm, and an average mass of 1.24 grams. Afterward, the sample was wrapped in a paraffin film (Parafilm M, Bemis, Neenah, United States) to avoid moisture loss via the lateral and bottom surfaces. The upper side was left open to enable dehydration from this surface. As such, the system mimicked mass transfer from only the top surface during drying. Two types of experiments were performed: X-ray micro-CT and additional drying chamber experiments outside the X-ray source. The latter were performed to support the X-ray experiments, as they enabled gravimetrical analysis and measurements of sample temperature. The temperature measurements were not possible in the X-ray as the thermocouple wires would affect the image quality.2.2. X-ray micro-CT imaging
X-ray micro-CT was performed to capture the microstructural changes of apple tissue during drying. The experiments were done at the Center for X-ray Analytics of Empa (Switzerland). The X-ray micro-CT setup consisted of an X-ray tube (XT9160-TXD, Viscom, Hannover, Germany), a high precision rotation table (UPR-160F AIR, Micos, Dübendorf, Switzerland) and a flat panel detector (XRD-1621-CN3ES, Perkin Elmer, Waltham, United States). The system used a power source of 20 W at 70 kV and 285 μA. The center of the sample was at a distance of 589.8 mm from the scintillator. The sample was rotated over 360° in angular steps of 0.5°. 721 images were generated for one tomogram dataset. Each image has 1800 × 1800 pixels and a pixel size of 8.85 × 8.85 μm2. A tomographic scan lasted for 9 min, which was found to be sufficiently fast to avoid any significant shrinkage of the sample, as shown by the capacity to reconstruct the dataset.The drying process was conducted inside a custom-built drying chamber (Fig. 1b). Here, the drying air temperature, relative humidity (RH) and air speed were controlled. The chamber was made of steel and had polyimide windows (4 × 4 cm2) at the front and back sides, facing the X-ray source and the detector, respectively. The upper side of the chamber was made of acrylic glass. The drying chamber had the following dimensions: 100 × 50 × 20.5 mm3 (length × height × width). The sample was placed onto a cylindrical sample holder which was put on the rotation stage of the X-ray setup. The sample was positioned inside the drying chamber in such a way that the upper 8 mm of the sample was in the field of view (FOV).
The drying experiments were carried out for 12 h with a supply air temperature of 25 ± 0.1 °C and a RH of 30 ± 1.8%. While the mass transport was dominantly two-dimensional, namely from the top surface, the heat exchange with the environment occurred via all sample surfaces. In this study, three drying conditions were considered: natural convective, forced convective and coupled irradiation-convective drying. For natural convective drying, only a small airflow rate at a speed of 0.05 ± 0.01 m s−1 was provided, in order to avoid moisture saturation of the air in the chamber. This air speed was measured using a thermal anemometer (Almemo FVA935-TH4, Ahlborn, Holzkirchen, Germany) in the center of the chamber. At the given air speed, we calculated the Richardson number, which is the ratio of Grashof number (Gr) to the square of Reynolds number (Re) to evaluate if the flow could be characterized as natural convection flow. The Grashof (Gr) number is the ratio of the buoyancy force, due to the difference between the air temperature, Ta and the temperature of the sample surface Ts, and the viscous force acting on the air. Ts changed with the drying time and is presented in Section 3.1. Assuming a flow over a horizontal surface, Gr can be calculated as:46
 | (1) |
 | (2) |
For forced convective drying, the airflow speed was provided at 0.50 ± 0.01 m s−1. In this case the Ri was in the range of 0.5 (after 12 hours of drying) and 1.4 (in the first 10 minutes of drying). At the beginning when the sample surface temperature was lower than 21 °C, mixed convection took place and changed fast to the forced convective regime. For the coupled irradiation-convective drying, a 300 W lamp (Ultra-Vitalux, Osram, Munich, Germany) was placed 30 cm above the upper surface of the drying chamber, while the air speed was set at 0.05 ± 0.01 m s−1. The resulting irradiation level inside the chamber was 400 W m−2, as measured by a pyranometer (SR03, Hukseflux, Delft, The Netherlands). A spectral measurement of the solar lamp emission showed that the acrylic glass cover of the drying chamber absorbed the UV radiation (wavelength < 400 nm in Fig. 1d) and was transparent to visible light and near-infrared radiation (wavelength > 400 nm in Fig. 1d). Each X-ray drying experiment was repeated twice (called Repetition 1 and Repetition 2). In total, there were six experiments. New fresh-cut samples were used in each drying experiment, where a tomogram was taken every two hours, i.e., at 0, 2, 4, 6, 8, 10, and 12 h during the drying process.
2.3. Additional experiments in drying chamber
To complement the X-ray CT results, separate experiments in the drying chamber were performed outside the X-ray source to investigate the mass loss and the change of sample temperature during drying. In the experiments, the same climatic chamber was used and the same environmental conditions were set as in the X-ray micro-CT. The sample was placed on a sample holder that was connected to a data logging system. The system recorded mass and temperature of the sample over time. Four type-T thermocouples (±0.1 °C) with a diameter of 0.2 mm were put inside the sample. Two of them were inserted 2 mm under the sample surface, while the other two were placed in the center (7.5 mm under the surface) of the sample. The mass loss was recorded using a semi-micro balance (MS1003S, Mettler Toledo, Greifensee, Switzerland) with an accuracy of ±0.002 g. In order to check the repeatability, the drying experiment was repeated five times for each drying condition.2.4. Image processing
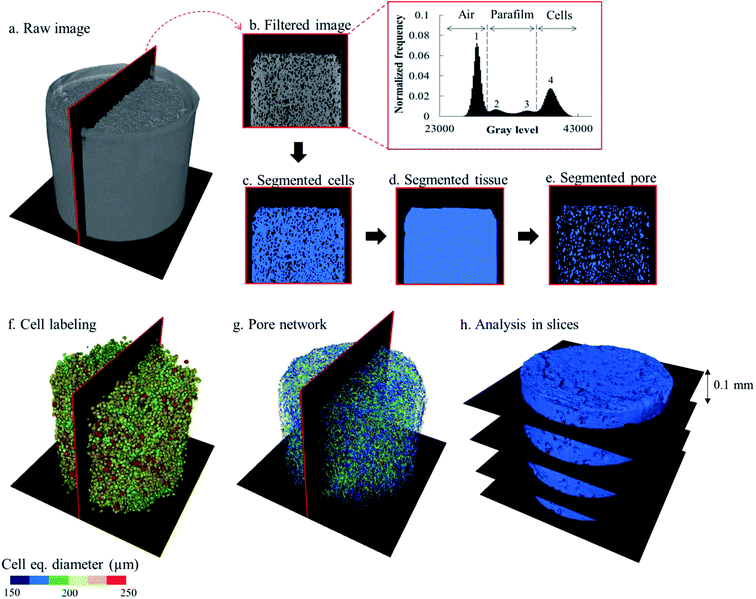
The raw images of the X-ray micro CT were reconstructed using the Octopus Reconstruction software version 8.9.3 (XRE, Gent, Belgium). The reconstruction of a tomogram generated a stack of 1481 16-bit grayscale images. The post-processing of the reconstructed images was performed using the commercial software Avizo (Edition 9.5, Thermo Fisher Scientific, Waltham, USA). The workflow to extract the microstructural parameters was adopted from a previously validated characterization protocol.48 The image analysis was composed of several steps (Fig. 2). First, the noise in the raw images was removed by using an anisotropic diffusion filter to preserve the details of the edges.49 The apple cells were segmented first from the images. Because the greyscale value distribution of each tomogram was different, the threshold values for separating the cell material from the air and the paraffin film were manually determined. A typical gray value distribution of the tomograph is shown in Fig. 2, where there were four modes with distinct peaks, representing different materials: air (surrounding air and intercellular air; peak 1), paraffin film (peaks 2 and 3) and apple cells (peak 4). To segment the cell material, the local minimum between peak 3 and peak 4 was chosen as a threshold value (Fig. 2c). A hole-filling algorithm was then applied to the binary images containing the segmented apple cells to close the holes (intercellular air) between the cells. This way, binary images that represented the entire bulk apple tissue, consisting of cells and intercellular air, could be created (Fig. 2d). For each dataset, the tissue binary images were then used as masks to segment the intercellular air out from the respective filtered images. During the segmentation, only the region inside the mask was enabled to be segmented. As a result, the air surrounding the tissue could be excluded from the segmentation, leaving only the intercellular air (Fig. 2e). The volumes of bulk tissue, cells, and intercellular air were calculated from the binary images of bulk tissue, cells and intercellular air, respectively.After segmentation, the cell binary images were split into separated individual cells (Fig. 2f). To do so, a watershed separation algorithm50 was applied. A virtual filter was used to identify the cell deformation based on the cell sphericity, equivalent diameter, and elongation. The description of these parameters is given in Table 1 and the results are presented in Section 3.3.3. For the pore region (Fig. 2g), the individual pores was identified by evaluating the connectivity of each pore voxel with the surrounding 26 voxels. Here, the voxels that share at least one common vertex with their neighbors were considered to belong to one pore.48 After the individual cells and pores were identified, their structural parameters (Table 1) were evaluated.
| Structural parameter | Unit | Description |
|---|---|---|
| Radial shrinkage | — | Ratio of the difference between the sample initial radius (8 mm) and the equivalent radius of slice i at time t (Eulerian configuration) to the sample initial radius |
| Axial shrinkage | — | Ratio of the difference between the sample initial height (8 mm) and the height of slice i at time t (Eulerian configuration) to the sample initial height |
| Eulerian porosity | — | Ratio of the pore volume of slice i in the Eulerian configuration, to the total volume (pores and cells) of the slice i also in the Eulerian configuration (Fig. 3a) |
| Lagrangian porosity | Ratio of the pore volume in slice i in the Lagrangian configuration, to the total volume (pores and cells) of the slice i in the initial configuration (Fig. 3a) | |
| Lagrangian cell fraction | — | Ratio of the cell volume in slice i in the Lagrangian configuration, to the total volume (pores and cells) of the slice i in the initial configuration (Fig. 3a) |
| Cell sphericity | A measure of how spherical an object (a cell) is. It is defined as the ratio of the surface area of a sphere (Asphere) with the same volume as the cell (Vcell) to the measured surface area of the cell (Acell) | |
| Cell equivalent diameter | μm | Diameter of a sphere that has the same volume as the cell |
| Cell length | μm | Maximum Ferret diameter DF,max of a cell. The Feret diameter is the normal distance between two parallel tangent planes touching the particle surface.51 The maximum Feret diameter was determined by sampling over 31 angles |
| Cell elongation | — | Ratio of the maximum Ferret diameter DF,max to the smallest Ferret diameter DF,min orthogonal to it, as illustrated in Fig. 3c |
| Pore equivalent diameter | μm | Diameter of a sphere that has the same volume as the pore |
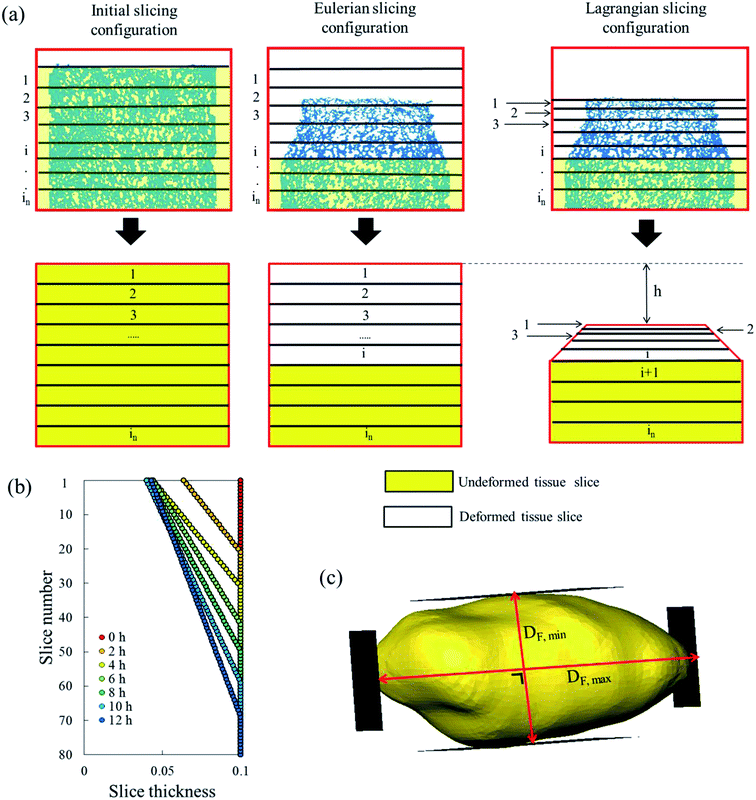
The sample domain was divided into slices, along the sample height (dehydration direction), to evaluate the tissue shrinkage and the microstructural parameters. Two slicing configurations were considered based on the Eulerian and Lagrangian descriptions (Fig. 3a). The slicing in the Eulerian description considered only the current state of the sample, without looking at its initial (fresh) state. The fresh and deformed samples were thus sliced with a constant slice thickness of 0.1 mm. The microstructural parameters were analyzed in each slice independently. The slicing in the Lagrangian description took into account the deformation of each slice in the deformed sample with respect to its initial (fresh) state at t = 0. Therefore, in the deformed sample, the slices needed to be registered back to their initial configuration in the fresh sample. The slice state, i.e. deformed or undeformed, was identified by calculating the slice radial shrinkage in the Eulerian slicing configuration. The radial shrinkage was given by:
 | (3) |
If the radial shrinkage was larger than 2%, the slice was categorized as a deformed slice, and vice versa. The threshold value of 2% was chosen to take into account the bias caused by the different levels of gray value intensity in the raw images. The bias could affect the segmentation steps, thus the resulting volume of a slice. In the Lagrangian slicing configuration, the thickness of undeformed slices was kept at 0.1 mm. For the deformed slices, we developed a simplified registration method to map the deformed slices back to their initial state at t = 0. The method was chosen because of the difficulties in registering the local deformation. Due to the significant shrinkage and pore (or cell) deformations, there were hardly distinct marker points to be used for a better registration of the deformation. In this case, the deformed slice thickness was assumed to decrease linearly over the height with a factor a, which was defined as:
 | (4) |
| ti = t0 − a(n −(i − 1)) | (5) |
The Eulerian porosity E was used to identify the formation of an elevated-porosity layer that was formed near the tissue surface during drying (explained in Section 3.3.1). An elevated-porosity layer was a tissue region where the Eulerian porosity is larger than the initial porosity of the sample. This could occur when the pore volume was maintained or created in the deformed sample during shrinkage. The Lagrangian porosity ϕ, along with the Lagrangian cell fraction ψ (Table 1), was used to identify the volumetric shrinkage of the tissue sample during drying. The Lagrangian cell fraction was the ratio of the cell volume in slice i at time t, to the total volume (pores and cells) of the slice i in the initial configuration (Fig. 3a). All other microstructural parameters, such as the cell diameter, cell sphericity, cell elongation and pore diameter, were all evaluated based on the Eulerian configuration. The profile of these parameters along the sample height was obtained by averaging the value for each object (cell or pore) located within the respective Eulerian slice. The center of mass was used to determine in which Eulerian slice the object was located.
3. Results
3.1. Drying rates and temperatures
The drying curves of the apple samples which were dried at different drying conditions are shown in Fig. 4. They indicate the averaged mass loss (and standard error) over the five experimental repetitions, as a function of the drying time. The increase of air speed from 0.05 m s−1 (natural convection case) to 0.5 m s−1 (forced convection case) significantly increased the moisture removal, especially during the first two hours of drying. When irradiation was introduced, the same moisture removal as in the forced convective case is observed at the start of the experiment. We observed that the radiation heat from the solar lamp also warmed up the drying chamber. This resulted in an increase of the air temperature in the chamber from 25 °C to 29 °C. The relative humidity of the air in the chamber was observed to decrease from 30% RH to 27% RH. After two hours, the moisture removal in the coupled irradiation-convective case slowed down, while the drying rate in the forced convection case remained the highest of the three drying cases.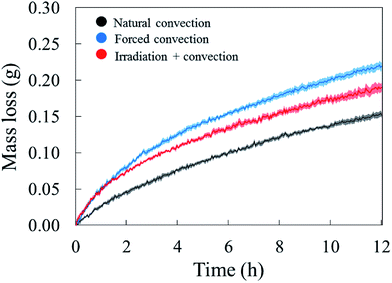 | ||
| Fig. 4 Average water loss of the tissue samples (solid line) with the standard error (shaded areas) in five experimental repetitions. | ||
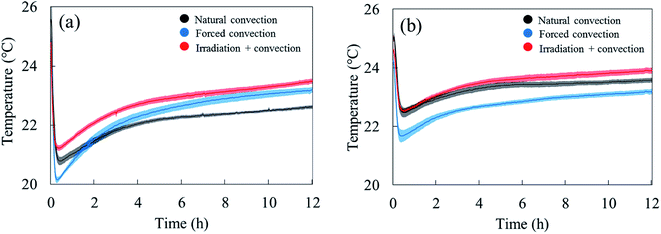
The water removal from the sample surface inherently induced an evaporative cooling effect on the sample due to the latent heat needed to evaporate the water. The largest effect was observed during the first hour of drying (Fig. 5). As the water loss decreased, the sample surface and core temperature increased again since less heat was needed to evaporate water. The sample temperature was lower in the forced convective case compared to the natural convection case because of the higher drying rate, thus cooling effect. The impact of radiative heating on the drying process can be seen by comparing the moisture removal and sample temperature in the coupled radiation-convective and natural convective cases. Although the water removal was higher (Fig. 4), the coupled irradiation-convective case resulted in a higher surface temperature (Fig. 5a) due to the higher drying air temperature and irradiation on the fruit surface. The difference was from 0.5 °C in the first hour up to 1 °C over the remaining drying time. The low standard error for the mass loss and temperature for each drying case (Fig. 4 and 5) showed that the climatic setup provided repeatable drying conditions.
3.2. Sample shrinkage
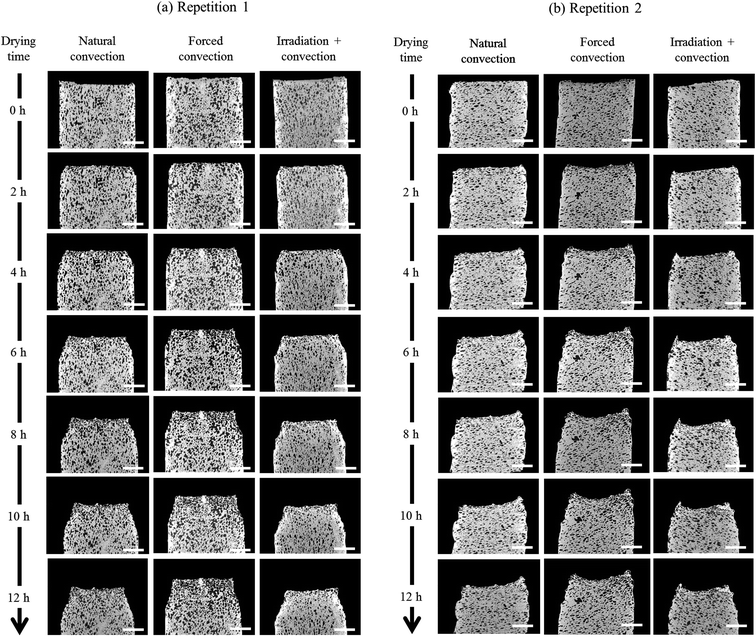
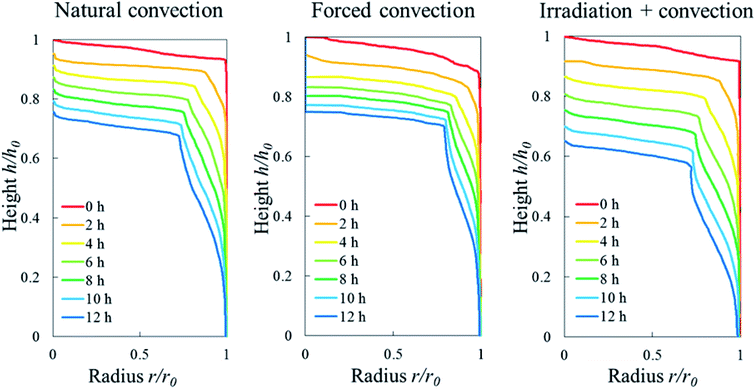
The change in the tissue structure throughout the drying process could be seen qualitatively from the reconstructed grayscale images of X-ray μCT shown in Fig. 6. Variations in initial microstructure exist between samples due to the inherent biological variability. However, the same quantitative trends in the shrinkage and changes of microstructural parameters of each drying case were observed in the Repetitions 1 and 2. Hence, in some parts of the discussion below, only the results from Repetition 1 are shown. Regardless of the drying conditions, notable bulk radial and axial shrinkage in the upper region of the sample was identified for all samples by the end of the drying process. The shrinkage was nearly axi-symmetric, which means it was uniform in the radial direction and not influenced by the approach air flow direction. The radial shrinkage for the Repetition 1 is shown in Fig. 7 as a function of the axial shrinkage. The axial shrinkage was determined by the distance of the center of the slice to the bottom boundary of the FOV versus the initial height of the sample in the FOV (8 mm). The maximum radial (1 − (r/r0)min) and axial (1 − (h/h0)min) shrinkage in all drying cases for the Repetitions 1 and 2 are presented in Table 1. In both repetitions, the coupled irradiation-convective drying cases had the largest radial and axial shrinkage, while the forced convective cases shrank the least in both directions. Note that the results from the radial shrinkage analysis were used as the basis for determining the slice thickness for the Lagrangian analysis in Section 3.3.3.3. Changes in microstructure
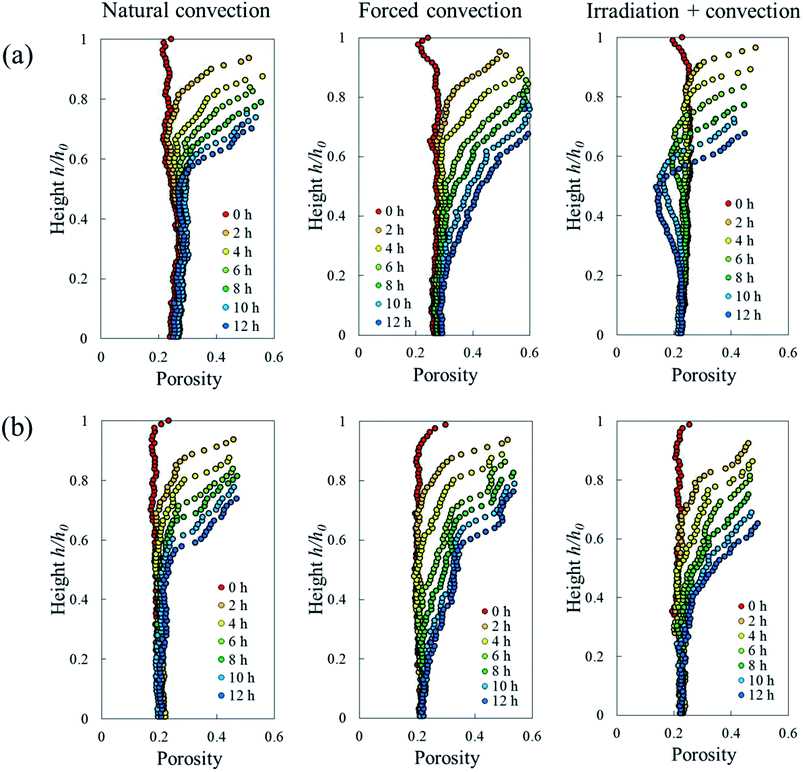 | ||
| Fig. 8 Eulerian porosity profile of the sample along its axial direction during 12 hours of convective drying in (a) Repetition 1 and (b) Repetition 2. | ||
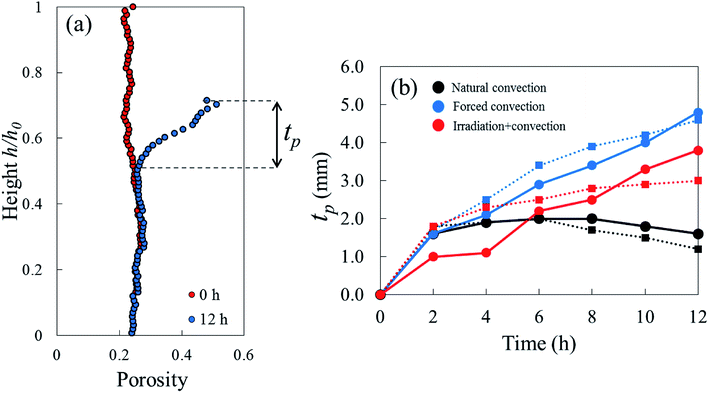
One sample, the irradiation-convective case in Repetition 1, displayed the development of a reduced-porosity layer below the elevated-porosity layer. The thickness of the elevated-porosity and reduced-porosity layers increased with time to 0.9 mm and 2.7 mm, respectively, after 12 h of drying. The formation of this reduced-porosity layer was attributed to the high volumetric shrinkage which induced a densification of the structure. For the irradiation-convective case in Repetition 2, where the shrinkage was lower (Table 2), this was not sufficient to reduce the porosity below the initial value. Here, the sample showed the quasi-linear development of a higher-porosity layer to around 4 mm thick after 12 hours. The formation of the reduced-porosity layer in Repetition 1 was attributed to a slightly different initial tissue structure due to biological variations. However, the total thickness of the tissue layers affected by the drying process, tp, accounting for elevated- and reduced-porosity layers, was comparable after 12 hours of drying for both repetitions. These thicknesses are shown in Fig. 9b with red solid and dashed lines for Repetitions 1 and 2, respectively. The impact of the coupled radiation-convective drying on the overall microstructural changes was therefore similar.
| Max. radial shrinkage (1 − (r/r0)min) | Max. axial shrinkage (1 − (h/h0)min) | |||
|---|---|---|---|---|
| Repetition 1 | Repetition 2 | Repetition 1 | Repetition 2 | |
| Natural convection | 0.274 | 0.266 | 0.332 | 0.315 |
| Forced convection | 0.213 | 0.184 | 0.301 | 0.292 |
| Coupled irradiation-convection | 0.282 | 0.270 | 0.418 | 0.376 |
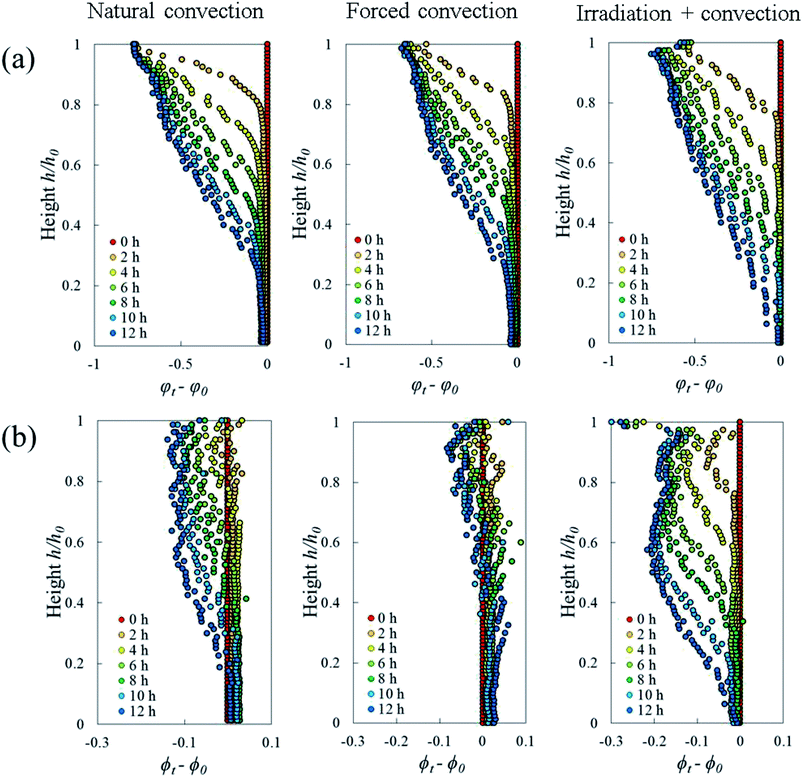
The Lagrangian cell fraction and porosity were analyzed to understand the relationship between the volumetric shrinkage and the resulting change in cell and pore volume within a sample slice. In each slice, the sum of the change in Lagrangian cell fraction (i.e. cell volume vs. total volume of cells and pores) and in Lagrangian porosity equaled the total volumetric shrinkage. Fig. 10 shows that, in all drying cases, the changes in Lagrangian cell fraction were more significant than the changes in Lagrangian porosity. This underlines that the changes in cell volume had a more dominant contribution to the total volumetric shrinkage than the changes in pore volume. In the natural convection and coupled irradiation-convective cases, the pore volume reduction amplified the total volumetric shrinkage. In the forced convective case, however, the pore volume almost remained constant during drying, by which the observed shrinkage could be attributed almost entirely to the reduction in cell volume.
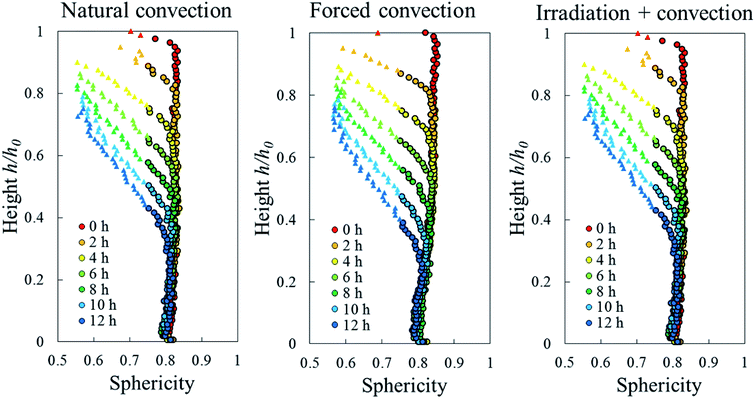
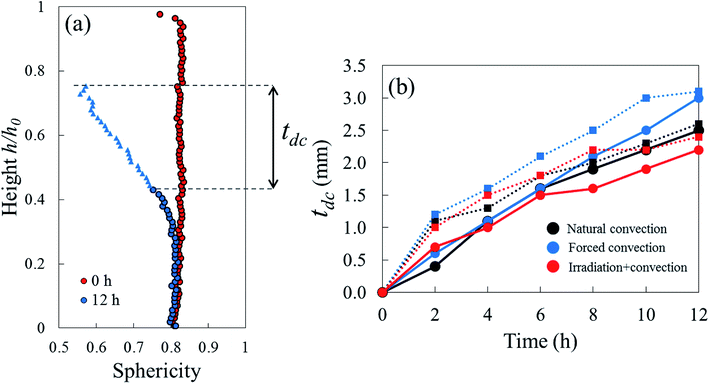
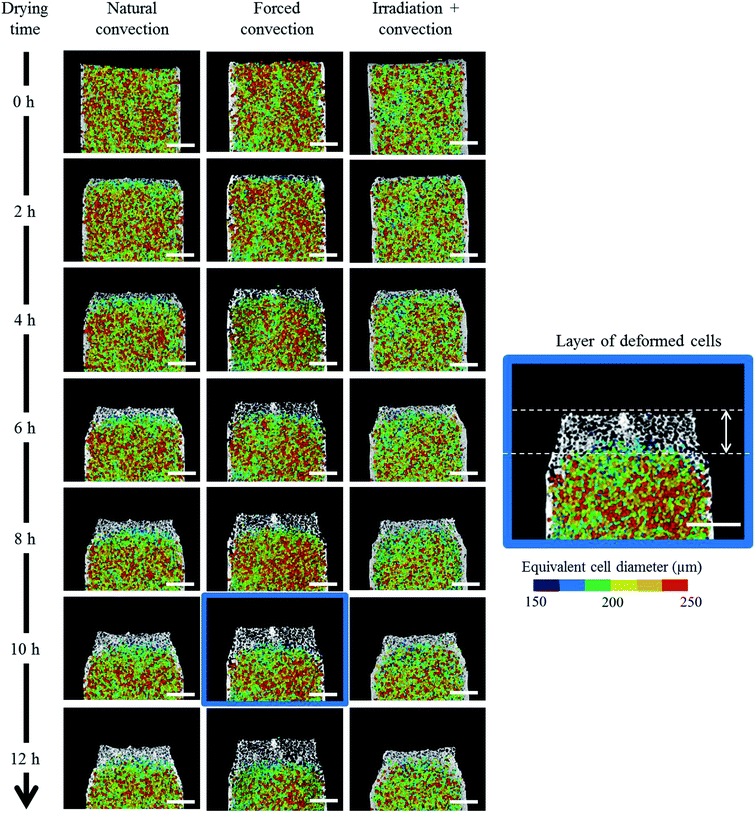
Due to drying, the cell deformed and changed its shape. The cell deformation might cause a reduction of cell sphericity. Based on visual observations and a validated cell identification protocol,48 an object was categorized as an undeformed cell when its sphericity was higher than 0.75. Outside of this category, an object was defined as a deformed cell. Fig. 12 shows the average cell sphericity in Eulerian slices at different drying times. In all of the drying methods, progressing reductions of average cell sphericity were observed. A region where the average cell sphericity were less than 0.75 (triangles in Fig. 12) was found particularly in the elevated-porosity layers previously identified. It was also observed in the reduced-porosity layer of irradiation-convective sample in Repetition 1. This region was defined as a deformed-cell layer. The thickness of a deformed-cell layer (Fig. 13a) was determined by measuring the total height of Eulerian slices denoted as triangles in Fig. 12. For all drying cases, the deformed-cell layer steadily became thicker with drying time, although the growth differed from case to case (Fig. 13b). The thickest deformed-cell layer at the end of the drying process was found in the forced convective cases (3.05 mm in Repetition 1 and 2.93 in Repetition 2). The high mass loss (Fig. 4) and low total shrinkage (Fig. 7) in the forced convective case made the cells to deform more than in the other two cases. In the coupled irradiation case, the high mass loss was accompanied by a large volumetric shrinkage that allowed the cells to shrink with a limited impact on their sphericity. Fig. 14 visualizes the 3D rendering of the all undeformed cells, which are overlayed on the middle plane of the filtered X-ray images. The grey area of the tissue (the one which is not overlayed by the 3D cells) corresponds to the region where the deformed-cells layers were found.
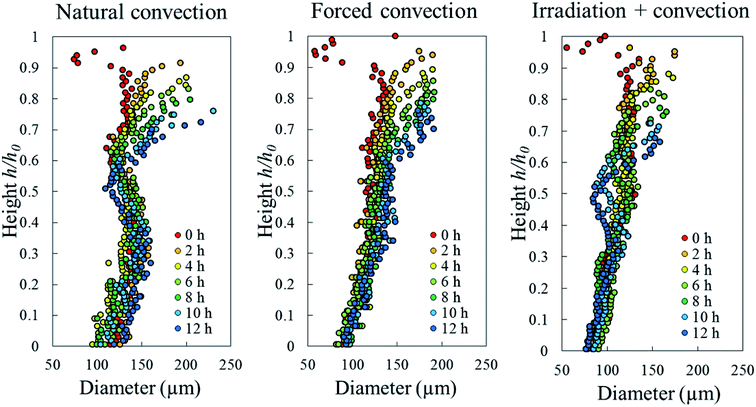
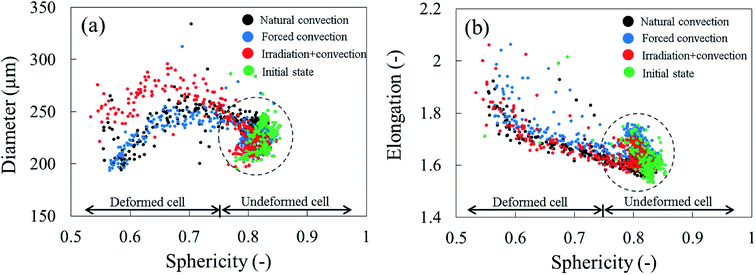
To identify the correlation between the changes in cell sphericity, equivalent diameter and elongation, the average cell sphericity in each sample slice was plotted against the corresponding average cell diameter and elongation over the entire drying period (Fig. 15). The variability of those parameters for undeformed cells yields a zone of possible values, highlighted with circles. These undeformed cells were found mostly from the initial state of the samples as well as from the tissue below the deformed cell layer during drying. Generally, the cell equivalent diameter decreased when the sphericity decreased. Although an increase in equivalent diameter of a single cell is theoretically not possible, increases in diameter were found particularly in the coupled irradiation-convection case. Here, the equivalent diameter of the deformed cell (red dots in Fig. 15a) was more than the maximum cell diameter found in the fresh sample (green dots in Fig. 15a). It can be explained by the fact that the high levels of both axial and radial shrinkage of the fruit tissue induced a more compact cellular structure. As results, some deforming cells virtually merged together and clusters of cells appeared, where each cluster was identified by the image processing as a single cell with a larger diameter. Regarding the cell elongation, the same trends were observed in all of the drying cases that the deformed cells (or cell cluster in coupled irradiation-convection case) were more elongated with decreasing sphericity.
4. Discussion
Different drying methods noticeably affect the tissue microstructure, although there is a biological variability between individual samples. Compared to natural convective drying, forced and coupled irradiation-convective drying were found to have a significantly higher drying rate at the beginning of the drying process. In the forced convective case, the convective mass transfer coefficient (CMTC), so the inverse of the boundary layer resistance due to airflow, was higher than the one in the natural convection case. On the other hand, in the coupled irradiation-convective drying, the faster drying is due to the combined effects of higher air temperature in the chamber and radiation heating at the fruit surface. Due to an increase in saturation pressure, the higher air temperature increases the vapor pressure deficit (VPD). VPD reflects the difference between the water vapor content in the air and its saturation value.56 Note that the absorption of the radiative heat does not occur only at the surface of the tissue. The near-infrared radiation provided by the solar lamp (wavelengths > 780 nm in Fig. 1d) is partly transmitted until a certain depth into the tissue.57,58 It is then absorbed by the underlying tissue and would locally increase the tissue temperature. According to the spectral emission in Fig. 1d and previous observations by58 for apple tissue, the penetration depth of the solar lamp radiation can be approximately around 3 mm under the tissue surface for a fresh tissue and it would decrease as the tissue dehydrates. The absorbed heat from the radiation also supplies the necessary heat of evaporation. The combined effect of the internal heat absorption from radiation and higher air temperature caused the surface temperature of the tissue in the coupled-radiative convective case (Fig. 5a) to be higher than in the natural convective case.When comparing the three different drying methods, it is clear that the fast, low-temperature forced convection drying provides the most open-porous structure. Previous studies on dried apple and potato also showed that forced convective drying resulted in products with a higher (Eulerian) porosity.59–61 Using a Lagrangian approach, we find that the pore volume stays almost constant for our forced convective condition. This is due to a small degree of bulk shrinkage while cells shrink during drying. A possible explanation for the low degree of shrinkage in this case is an increase of cellular matrix stiffness at higher drying rates. A study shows that by reducing the water activity from 100% to 35%, the secant modulus (ratio of failure stress to failure strain) of the cell wall will increase from 1.3 to 3676 MPa.62 Therefore, the drier the tissue gets, the stiffer it becomes. The change occurs faster in the forced convective drying case than in the other drying cases. This leads to a higher mechanical resistance to bulk shrinkage during the subsequent moisture removal. As a result, the pore volume reduction is less than other drying cases. The coupled irradiation-convective drying yields the highest radial and axial shrinkage compared to the other drying methods. Note that in this case, the difference between the drying air temperature (29 °C) and core temperature (23.8 °C after 12 hours of drying) is the largest. We hypothesize that a higher temperature gradient is created in the tissue, both in the radial and axial directions. It may cause additional stresses on the structure which results in more extensive shrinkage. To confirm this hypothesis, however, additional temperature measurements along the radial and axial directions are needed.
The results above suggest that, ideally, the optimization of fruit drying processes must be done based on the understanding of microstructural changes during drying and the desired microstructural properties of the final product. The microstructure characteristics affect the internal water transport since the water permeability is lower in the dehydrated tissue.17 Furthermore, the water permeability also depends on the porosity and cell deformation. Controlling the thickness of the elevated porosity and deformed cell layers is crucial to direct the drying process and the subsequent changes of microstructure in the tissue underneath those layers. As such, an optimized process can be made up of either one or a combination of different drying methods. Based on this study, for instance, forced convection at low temperature (25 °C) can be perceived as the most suitable method to produce dried products that have high porosity with minimal shrinkage. Such porous products could have a high degree of crispness.63,64 Crispness is a desirable textural quality that is often related to the product mechanical properties, i.e. the intensity and number of force peaks in strain-force curves.65–67
Overall, this study shows that the X-ray micro-CT technique is able to document the changes in the microstructural features of a complex porous material, like fruit, during the dynamic process of drying. At the given X-ray energy (70 keV), no tissue damage was observed on the samples during the measurements. This was verified by comparing the reconstructed slice at each drying time (Fig. 6) for the bottom part of the tissue. This part was not affected by dehydration and the structure was preserved during the entire measurement. It can also be verified quantitatively by looking at the porosity and cell sphericity profiles at the bottom part of the tissue (at h/h0 = 0–0.2) for every time step. The profiles are similar, which means the pores and cells are remain intact. Due to limited accesses to the X-ray micro-CT facility, only six measurements were performed. However, the results showed distinctive tendencies for each the drying method. Considering the repeatability of the mass losses and the sample temperatures that were measured using the same setup (Section 3.1), the X-ray micro-CT datasets were expected to be reproducible. Nevertheless, some improvement can still be done to refine our understanding of the associated physical phenomena that are happening during the drying process. At this point, we could only observe the formation of a deformed cell layer. The deformation mechanism of each cell in real time, starting from the fresh cell until it deforms and interacts with its neighboring cells to form a cell cluster, could not be identified. This was due to the limitation of the temporal resolution of the X-ray system. To be able to track the deformation of every single fruit cell during drying, an ultrafast X-ray system that is able to perform a tomography in real time, such as synchrotron X-ray, is required. Additionally, a synchrotron X-ray system has a submicron spatial resolution that can also resolve the cell wall with a thickness of around 1–10 μm.68–70 The information can be used to deeper understand the impact of drying conditions on the deformation mechanism of the microstructure, such as the cell shrinkage, plasmolysis (cell membrane rupture and the shrinkage of protoplasm while the cell wall is still intact) or lysis (cell membrane rupture, thus faster water removal or volume reduction). In addition, given the work of,38,71 the identification of the changes in cell wall and protoplast volume of a single cell, in real time, would give additional insights on the water movement and the water holding capacity of the cellular structure. Since the product quality is associated with the final product shape,18 the impact of different tissue geometries on the micro- and macrostructural changes is also essential to be studied in a next step.
5. Conclusion
X-ray micro-CT was successfully used to characterize and quantify in situ the changes of the microstructure of apple tissue during drying under natural convective, forced convective and coupled irradiation-convective drying. By combining a Eulerian and Lagrangian approaches, we were able to identify the relations between drying rate, bulk shrinkage and changes in the microstructural characteristics, such as porosity, pore diameter, cell sphericity, cell diameter and cell elongation. While the Eulerian approach evaluated the microstructural parameters in their current states, the Lagrangian approach allowed us to relate these microstructural changes back to the initial state. Due to the large cellular deformations and changes in porosity, both approaches provided complementary information. In all drying cases, a layer with an elevated Eulerian porosity and deformed cells developed during drying near the tissue surface. The thickness and structure of these layers, however, depended strongly on the applied drying method. The samples in the forced convection drying showed the least bulk shrinkage and the highest Eulerian porosity. It happened when Lagrangian pore volume almost remained constant while the cell volume decreased. On the other hand, the natural convective and coupled irradiation-convective cases, the pore volume decreased and magnified the shrinkage caused by cell volume reduction. The coupled irradiation-convective drying induced the most extensive shrinkage and formation of larger cell clusters due to the combined effect of high air temperature and radiative heating.Conflicts of interest
There are no conflicts to declare.Acknowledgements
The study and open access publication are funded by the Swiss National Science Foundation SNSF (project 200021_160047). Author BN wishes to thank the Research Council of the KU Leuven (C16/16/002) for financial support. The authors acknowledge the support of Stephan Carl at Empa for the experimental set-up.References
- R. Parra and N. Magan, Modelling the effect of temperature and water activity on growth of Aspergillus niger strains and applications for food spoilage moulds, J. Appl. Microbiol., 2004, 97(2), 429–438 CrossRef CAS PubMed.
- F. Fan, S. Rodrigues, C. L. Law and A. S. Mujumdar, Drying of Exotic Tropical Fruits: A Comprehensive Review, Food Bioprocess Technol., 2011, 4(2), 163–185 CrossRef.
- S. Devahastin and C. Niamnuy, Modelling quality changes of fruits and vegetables during drying: a review, Int. J. Food Sci. Technol., 2010, 45(9), 1755–1767 CrossRef CAS.
- A. Vega-Galvez, K. Ah-Hen, M. Chacana, J. Vergara, J. Martinez-Monzo and P. Garcia-Segovia, et al., Effect of temperature and air velocity on drying kinetics, antioxidant capacity, total phenolic content, colour, texture and microstructure of apple (var. Granny Smith) slices, Food Chem., 2012, 132(1), 51–59 CrossRef CAS PubMed.
- J. Slavin and B. Lloyd, Health Benefits of Fruits and Vegetables, Adv. Nutr., 2012, 3(4), 506–516 CrossRef CAS PubMed.
- P. Hernández-Alonso, L. Camacho-Barcia, M. Bulló and J. Salas-Salvadó, Nuts and dried fruits: an update of their beneficial effects on type 2 diabetes, Nutrients, 2017, 9(7), 1–34 CrossRef PubMed.
- V. R. Sagar and P. Suresh Kumar, Recent advances in drying and dehydration of fruits and vegetables: a review, J. Food Sci. Technol., 2010, 47(1), 15–26 CrossRef CAS PubMed.
- S. V. Jangam, An overview of recent developments and some R&D challenges related to drying of foods, Drying Technol., 2011, 29(12), 1343–1357 CrossRef.
- M. Zhang, H. Chen, A. S. Mujumdar, J. Tang, S. Miao and Y. Wang, Recent developments in high-quality drying of vegetables, fruits, and aquatic products, Crit. Rev. Food Sci. Nutr., 2017, 57(6), 1239–1255, DOI:10.1080/10408398.2014.979280.
- M. V. R. Murthy, A review of new technologies, models and experimental investigations of solar driers, Renewable Sustainable Energy Rev., 2009, 13(4), 835–844 CrossRef.
- J. Müller and W. Mühlbauer, Solar Drying, in Modern Drying Technology - Energy Savings, 2012, pp. 199–243 Search PubMed.
- J. Szadzińska, S. J. Kowalski and M. Stasiak, Microwave and ultrasound enhancement of convective drying of strawberries: experimental and modeling efficiency, Int. J. Heat Mass Transfer, 2016, 103, 1065–1074 CrossRef , https://www.sciencedirect.com/science/article/pii/S0017931016318968.
- W. Aregawi, T. Defraeye, S. Saneinejad, P. Vontobel, E. Lehmann and J. Carmeliet, et al., Dehydration of apple tissue: intercomparison of neutron tomography with numerical modelling, Int. J. Heat Mass Transfer, 2013, 67, 173–182, DOI:10.1016/j.ijheatmasstransfer.2013.08.017.
- L. Mayor, M. A. Silva and A. M. Sereno, Microstructural Changes during Drying of Apple Slices, Drying Technol., 2005, 23(5), 2261–2276 CrossRef , http://www.tandfonline.com/doi/abs/10.1080/07373937.2013.845573.
- L. Seguí, P. J. Fito and P. Fito, Analysis of structure-property relationships in isolated cells during OD treatments. Effect of initial structure on the cell behaviour, J. Food Eng., 2010, 99(4), 417–423, DOI:10.1016/j.jfoodeng.2009.05.019.
- I. Lang, S. Sassmann, B. Schmidt and G. Komis, Plasmolysis: Loss of Turgor and Beyond, Plants, 2014, 3(4), 583–593 CrossRef PubMed , http://www.mdpi.com/2223-7747/3/4/583/.
- K. Prawiranto, T. Defraeye, D. Derome, P. Verboven, B. Nicolai and J. Carmeliet, New insights into the apple fruit dehydration process at the cellular scale by 3D continuum modeling, J. Food Eng., 2018, 239, 52–63 CrossRef CAS , https://www.sciencedirect.com/science/article/pii/S0260877418302735.
- C. O. Perera, Selected Quality Attributes of Dried Foods, Drying Technol., 2005, 23(4), 717–730 CrossRef CAS.
- M. K. Krokida and Z. B. Maroulis, Effect of Drying Method on Shrinkage and Porosity, Drying Technol., 1997, 15(10), 2441–2458 CrossRef , http://www.tandfonline.com/doi/abs/10.1080/07373939708917369.
- P. A. McAtee, I. C. Hallett, J. W. Johnston and R. J. Schaffer, A rapid method of fruit cell isolation for cell size and shape measurements, Plant Methods, 2009, 5(1), 5 CrossRef PubMed , http://plantmethods.biomedcentral.com/articles/10.1186/1746-4811-5-5.
- V. Karathanos, S. Anglea and M. Karel, Collapse of Structure d drying of Celery, Drying Technol., 1993, 11(5), 1005–1023 CrossRef.
- W. a. M. McMinn and T. R. a Magee, Physical characteristics of dehydrated potatoes — Part II, J. Food Eng., 1997, 33(1–2), 49–55 CrossRef.
- S. Timoumi, D. Mihoubi and F. Zagrouba, Shrinkage, vitamin C degradation and aroma losses during infra-red drying of apple slices, LWT--Food Sci. Technol., 2007, 40(9), 1648–1654 CrossRef CAS.
- A. M. Goula and K. G. Adamopoulos, Kinetic models of β-carotene degradation during air drying of carrots, Drying Technol., 2010, 28(6), 752–761 CrossRef CAS.
- P. H. M. Marfil, E. M. Santos and V. R. N. Telis, Ascorbic acid degradation kinetics in tomatoes at different drying conditions, LWT--Food Sci. Technol., 2008, 41(9), 1642–1647, DOI:10.1016/j.lwt.2007.11.003.
- H. K. Mebatsion, P. Verboven, Q. T. Ho, B. E. Verlinden and B. M. Nicolaï, Modelling fruit (micro)structures, why and how?, Trends Food Sci. Technol., 2008, 19(2), 59–66 CrossRef CAS.
- P. P. Lewicki and G. Pawlak, Effect of drying on microstructure of plant tissue, Drying Technol., 2003, 21(4), 657–683 CrossRef , http://www.tandfonline.com/doi/abs/10.1081/DRT-120019057.
- A. B. Nieto and D. M. Salvatori, Structural changes in apple tissue during glucose and sucrose osmotic dehydration: shrinkage, porosity, density and microscopic features, J. Food Eng., 2004, 61, 269–278 CrossRef.
- C. M. Rathnayaka, H. C. P. Karunasena, W. Senadeera and Y. T. Gu, Application of 3D imaging and analysis techniques for the study of food plant cellular deformations during drying, Drying Technol., 2017, 3937 Search PubMed.
- B. M. Nicolaï, T. Defraeye, B. De Ketelaere, E. Herremans, M. L. A. T. M. Hertog and W. Saeys, et al., Nondestructive Measurement of Fruit and Vegetable Quality, Annu. Rev. Food Sci. Technol., 2014, 5(1), 285–312 CrossRef PubMed , http://www.annualreviews.org/doi/10.1146/annurev-food-030713-092410.
- E. Herremans, P. Verboven, E. Bongaers, P. Estrade, B. E. Verlinden and M. Wevers, et al., Characterisation of “Braeburn” browning disorder by means of X-ray micro-CT, Postharvest Biol. Technol., 2013, 75, 114–124, DOI:10.1016/j.postharvbio.2012.08.008.
- F. Mendoza, P. Verboven, H. K. Mebatsion, G. Kerckhofs, M. Wevers and B. Nicolaï, Three-dimensional pore space quantification of apple tissue using X-ray computed microtomography, Planta, 2007, 226(3), 559–570 CrossRef CAS PubMed.
- A. Rizzolo, M. Vanoli, G. Cortellino, L. Spinelli, D. Contini and E. Herremans, et al., Characterizing the tissue of apple air-dried and osmo-air-dried rings by X-CT and OCT and relationship with ring crispness and fruit maturity at harvest measured by TRS, Innovative Food Sci. Emerging Technol., 2014, 24, 121–130, DOI:10.1016/j.ifset.2013.09.001.
- V. Vicent, P. Verboven, F. T. Ndoye, G. Alvarez and B. Nicolaï, A new method developed to characterize the 3D microstructure of frozen apple using X-ray micro-CT, J. Food Eng., 2017, 212, 154–164, DOI:10.1016/j.jfoodeng.2017.05.028.
- T. Alam and P. S. Takhar, Microstructural Characterization of Fried Potato Disks Using X-Ray Micro Computed Tomography, J. Food Sci., 2016, 81(3), E651–E664 CrossRef CAS PubMed.
- A. Léonard, S. Blacher, C. Nimmol and S. Devahastin, Effect of far-infrared radiation assisted drying on microstructure of banana slices: An illustrative use of X-ray microtomography in microstructural evaluation of a food product, J. Food Eng., 2008, 85(1), 154–162 CrossRef.
- D. Cantre, A. East, P. Verboven, X. Trejo Araya, E. Herremans and B. M. Nicolaï, et al., Microstructural characterisation of commercial kiwifruit cultivars using X-ray micro computed tomography, Postharvest Biol. Technol., 2014, 92, 79–86, DOI:10.1016/j.postharvbio.2014.01.012.
- M. M. Rahman, M. U. H. Joardder and A. Karim, Non-destructive investigation of cellular level moisture distribution and morphological changes during drying of a plant-based food material, Biosyst. Eng., 2018, 169, 126–138 CrossRef , https://www.sciencedirect.com/science/article/pii/S1537511017308115.
- C. Niamnuy, S. Devahastin and S. Soponronnarit, Some recent advances in microstructural modification and monitoring of foods during drying: a review, J. Food Eng., 2014, 123, 148–156 CrossRef , https://www.sciencedirect.com/science/article/pii/S0260877413004391.
- C. M. Rathnayaka Mudiyanselage, H. C. P. Karunasena, Y. T. Gu, L. Guan and W. Senadeera, Novel trends in numerical modelling of plant food tissues and their morphological changes during drying – a review, J. Food Eng., 2017, 194, 24–39 CrossRef.
- H. C. P. Karunasena, W. Senadeera, R. J. Brown and Y. T. Gu, A particle based model to simulate microscale morphological changes of plant tissues during drying, Soft Matter, 2014, 10(29), 5249–5268 RSC , http://www.ncbi.nlm.nih.gov/pubmed/24740612.
- S. W. Fanta, M. K. Abera, W. A. Aregawi, Q. T. Ho, P. Verboven and J. Carmeliet, et al., Microscale modeling of coupled water transport and mechanical deformation of fruit tissue during dehydration, J. Food Eng., 2014, 124, 86–96, DOI:10.1016/j.jfoodeng.2013.10.007.
- L. Bennamoun and A. Belhamri, Design and simulation of a solar dryer for agriculture products, J. Food Eng., 2003, 59(2–3), 259–266 CrossRef.
- S. Janjai and B. K. Bala, Solar Drying Technology, Food Eng. Rev., 2012, 4(1), 16–54 CrossRef.
- P. Singh, V. Shrivastava and A. Kumar, Recent developments in greenhouse solar drying: a review, Renewable Sustainable Energy Rev., 2018, 82, 3250–3262 CrossRef , https://www.sciencedirect.com/science/article/pii/S1364032117313916.
- K. Maa, Y. Katoh, H. Katsurayama, M. Koganei and M. Mizunuma, Effects of convection heat transfer on Sunagoke moss green roof: a laboratory study, Energy and Buildings, 2018, 158, 1417–1428 CrossRef , https://www.sciencedirect.com/science/article/pii/S0378778817320741#bib0250.
- T. S. Cheng, Characteristics of mixed convection heat transfer in a lid-driven square cavity with various Richardson and Prandtl numbers, Int. J. Therm. Sci., 2011, 50(2), 197–205 CrossRef , https://www.sciencedirect.com/science/article/pii/S1290072910002723.
- E. Herremans, P. Verboven, B. E. Verlinden, D. Cantre, M. Abera and M. Wevers, et al., Automatic analysis of the 3-D microstructure of fruit parenchyma tissue using X-ray micro-CT explains differences in aeration, BMC Plant Biol., 2015, 15(1), 264 CrossRef PubMed , http://www.biomedcentral.com/1471-2229/15/264.
- D. Tschumperlé and R. Deriche, Vector Valued Image Regulization with PDE's: A Common Framework for Different Applications, IEEE Trans. Pattern Anal. Mach. Intell., 2005, 27, 506–517 Search PubMed.
- C. A. Baldwin, A. J. Sederman, M. D. Mantle, P. Alexander and L. F. Gladden, Determination and Characterization of the Structure of a Pore Space from 3D Volume Images, J. Colloid Interface Sci., 1996, 181(1), 79–92 CrossRef CAS , http://linkinghub.elsevier.com/retrieve/pii/S0021979796903586.
- D. F. Howarth and J. C. Rowlands, Quantitative assessment of rock texture and correlation with drillability and strength properties, Rock Mech., 1987, 20(1), 57–85 CrossRef.
- L. Mayor and A. M. Sereno, Modelling shrinkage during convective drying of food materials: a review, J. Food Eng., 2004, 61(3), 373–386 CrossRef.
- L. J. Gibson, The hierarchical structure and mechanics of plant materials, J. R. Soc., Interface, 2012, 9(76), 2749–2766 CrossRef CAS PubMed.
- A. A. Khan and J. F. V. Vincent, Anisotropy of apple parenchyma, J. Sci. Food Agric., 1990, 52(4), 455–466 CrossRef.
- K. Eichner, The Influence of Water Content on Non-enzymic Browning Reactions in Dehydrated Foods and Model Systems and the Inhibition of Fat Oxidation by Browning Intermediates, ed. R. Duckworth, in Water Relations of Foods, Academic Press Inc., 1975, pp. 417–34, Available from: DOI:10.1016/B978-0-12-223150-6.50029-8.
- R. Seager, A. Hooks, A. P. Williams, B. Cook, J. Nakamura and N. Henderson, Climatology, Variability, and Trends in the U.S. Vapor Pressure Deficit, an Important Fire-Related Meteorological Quantity, J. Appl. Meteorol. Climatol., 2015, 54(6), 1121–1141, DOI:10.1175/JAMC-D-14-0321.1.
- J. Lammertyn, A. Peirs, J. De Baerdemaeker and B. Nicolaï, Light penetration properties of NIR radiation in fruit with respect to non-destructive quality assessment, Postharvest Biol. Technol., 2000, 18(2), 121–132 CrossRef.
- M. Almeida, K. E. Torrance and A. K. Datta, Measurement of optical properties of foods in near- and mid-infrared radiation, Int. J. Food Prop., 2006, 9(4), 651–664 CrossRef.
- N. Wang and J. G. Brennan, Changes in structure, density and porosity of potato during dehydration, J. Food Eng., 1995, 24(1), 61–76 CrossRef.
- F. Singh, V. K. Katiyar and B. P. Singh, Mathematical modeling to study influence of porosity on apple and potato during dehydration, J. Food Sci. Technol., 2015, 52(9), 5442–5455 CrossRef CAS PubMed.
- V. T. Karathanos, N. K. Kanellopoulos and V. G. Belessiotis, Development of porous structure during air drying of agricultural plant products, J. Food Eng., 1996, 29(2), 167–183 CrossRef.
- J. Cybulska, E. Vanstreels, Q. T. Ho, C. M. Courtin, V. Van Craeyveld and B. Nicolaï, et al., Mechanical characteristics of artificial cell walls, J. Food Eng., 2010, 96(2), 287–294, DOI:10.1016/j.jfoodeng.2009.08.001.
- L. Ngamwonglumlert and S. Devahastin, Microstructure and its relationship with quality and storage stability of dried foods, Food Microstructure and Its Relationship with Quality and Stability, Elsevier Ltd, 2018, pp. 139–159, Available from: http://linkinghub.elsevier.com/retrieve/pii/B9780081007648000083 Search PubMed.
- R. L. Monteiro, B. A. M. Carciofi and J. B. Laurindo, A microwave multi-flash drying process for producing crispy bananas, J. Food Eng., 2016, 178, 1–11 CrossRef , https://www.sciencedirect.com/science/article/pii/S0260877415300947.
- J. V. Link, G. Tribuzi and J. B. Laurindo, Improving quality of dried fruits: A comparison between conductive multi-flash and traditional drying methods, LWT--Food Sci. Technol., 2017, 84, 717–725 CrossRef CAS.
- M. Saeleaw and G. Schleining, A review: crispness in dry foods and quality measurements based on acoustic-mechanical destructive techniques, J. Food Eng., 2011, 105, 387–399 CrossRef , https://www.sciencedirect.com/science/article/pii/S0260877411001373#f0010.
- F. J. Rojo and J. F. V. Vincent, Fracture properties of potato crisps, Int. J. Food Sci. Technol., 2008, 43(4), 752–760 CrossRef CAS.
- R. Ben-Arie, N. Kislev and C. Frenkel, Ultrastructural changes in the cell walls of ripening apple and pear fruit, Plant Physiol., 1979, 64(2), 197–202 CrossRef CAS.
- H. K. Mebatsion, P. Verboven, A. Melese Endalew, J. Billen, Q. T. Ho and B. M. Nicolaï, A novel method for 3-D microstructure modeling of pome fruit tissue using synchrotron radiation tomography images, J. Food Eng., 2009, 93(2), 141–148, DOI:10.1016/j.jfoodeng.2009.01.008.
- M. U. H. Joardder, R. J. Brown, C. Kumar and M. A. Karim, Effect of Cell Wall Properties on Porosity and Shrinkage of Dried Apple, Int. J. Food Prop., 2015, 18(10), 2327–2337 CrossRef , http://www.tandfonline.com/doi/full/10.1080/10942912.2014.980945.
- R. van der Sman, Hyperelastic models for hydration of cellular tissue, Soft Matter, 2015, 11, 7579–7591 RSC , http://rsc.66557.net/en/Content/ArticleLanding/2015/SM/C5SM01032B.
| This journal is © The Royal Society of Chemistry 2019 |

