 Open Access Article
Enhanced photoluminescence and energy transfer performance of Y3Al4GaO12:Mn4+,Dy3+ phosphors for plant growth LED lights†
Mao Xia‡
 abc,
Simin Gu‡
 ac,
Cheng Zhou
 a,
Longhai Liua,
Yuan Zhongac,
Yongli Zhangac and
Zhi Zhou*ac
aCollege of Science, Hunan Agricultural University, Changsha, 410128, P. R. China. E-mail: zhouzhi@hunan.edu.cn
bState Key Laboratory of Metallurgy, Central South University, Changsha, Hunan 410083, P. R. China. E-mail: xiamao2016@csu.edu.cn
cThe Technology Research Centre of Hunan Optical Agricultural Engineering, Changsha, 410128, P. R. China
First published on 21st March 2019
Abstract
Plant growth LEDs have attracted broad attention in modern society, desperate for specific phosphors with a characteristic emission band. A novel Mn4+ and Dy3+ co-doped Y3Al4GaO12 phosphor were successfully prepared through a conventional high-temperature solid-state reaction. A three band emission including red (625–700 nm), orange (550–607 nm) and blue (462–490 nm) is observed in these phosphors when excited under a near-UV lamp, which is ascribed to 2E → 4A2 of Mn4+, 4F9/2 → 6H15/2 and 4F9/2 → 6H13/2 of Dy3+, respectively. The three emissions match the absorption spectra of chlorophyll A and chlorophyll B well. Meanwhile, the energy transfer from Dy3+ to Mn4+ was confirmed by the luminescence spectra and lifetime analysis. Finally, an LED device was fabricated that consisted of a 365 nm ultraviolet chip and the Y3Al4GaO12:Mn4+,Dy3+ phosphor. The excellent properties indicate that the synthesized phosphor has a promising application in the optical agricultural industry.
1. Introduction
Optical agriculture has been brought to the forefront in the recent years, for providing plants with necessary light. As we know, plant growth needs four main conditions including light, atmosphere, water and nutrients, and light plays crucial roles among the four factors during all the process of plant growth.1 According to the previous experiments of plant cultivation, the effective emission ranges are orange-red (550–700 nm) and blue (400–500 nm) bands. Plants absorb orange-red and blue light by the photosynthesis pigments of chlorophyll and phytochrome.2,3 The latest way to promote plant growth is using LEDs to supply light in optical agricultural. Generally speaking, there are two main methods to obtain plant growth LEDs: “blue LED chip + red LED chip” and “phosphor + LED chip”. For the first technology, many shortcomings such as high cost, complex control circuit, high light failure and color drift limit its further application. The main problem is that two different monochromatic semiconductor chips are used, which require different drive circuits to control the emitting light ratio of blue and red dynamically. The “phosphor + LED chip” technology can be divided into two forms for different types of chip. The first method is combined a blue-emitting InGaN chip with red emission phosphors such as (Sr,Ca)AlSiN3:Eu2+![[thin space (1/6-em)]](https://www.rsc.org/images/entities/char_2009.gif) 4 and K2TiF6:Mn4+.5 This technology has the advantages of simple operate and low cost. However, the inconsistency of light wane and color drift exist between blue chip and red phosphor. On the one hand, chromaticity shifts in light-emitting diode (LED) devices arise from multiple mechanisms that produce chemical changes in the materials used to construct the LED devices. The chromaticity shifts in LED devices usually start with a fast-acting component which quickly reaches its maximum value, followed by one or more slower acting component. The fast-acting and slower acting component can be modeled with a bounded exponential function and a generalized logistic function.6 On the other hand, light wane because of the luminescence decay of phosphors in severe conditions such as high temperature, and LED device always reaches high temperature in long time work. What's more, it is difficult to guarantee the combination between the chip and phosphors, which weaken the light without effective excitation. The second approach is combined near-ultraviolet (n-UV) chips with red and blue phosphors or single-matrix red and blue dual emission phosphor, but this strategy depends more on the characteristics of phosphors and put forward higher requirements on phosphors. However, most traditional phosphors cannot match the aimed emission band, thus more accurate light sources are needed to provide the special light in the plant growth process.7–9
4 and K2TiF6:Mn4+.5 This technology has the advantages of simple operate and low cost. However, the inconsistency of light wane and color drift exist between blue chip and red phosphor. On the one hand, chromaticity shifts in light-emitting diode (LED) devices arise from multiple mechanisms that produce chemical changes in the materials used to construct the LED devices. The chromaticity shifts in LED devices usually start with a fast-acting component which quickly reaches its maximum value, followed by one or more slower acting component. The fast-acting and slower acting component can be modeled with a bounded exponential function and a generalized logistic function.6 On the other hand, light wane because of the luminescence decay of phosphors in severe conditions such as high temperature, and LED device always reaches high temperature in long time work. What's more, it is difficult to guarantee the combination between the chip and phosphors, which weaken the light without effective excitation. The second approach is combined near-ultraviolet (n-UV) chips with red and blue phosphors or single-matrix red and blue dual emission phosphor, but this strategy depends more on the characteristics of phosphors and put forward higher requirements on phosphors. However, most traditional phosphors cannot match the aimed emission band, thus more accurate light sources are needed to provide the special light in the plant growth process.7–9
The current primary red-emitting phosphors are Eu2+-doped nitrides, such as M2Si5N8:Eu2+![[thin space (1/6-em)]](https://www.rsc.org/images/entities/char_2009.gif) 10,11 and MAlSiN3:Eu2+ (M = Ca, Sr, Ba).4,12,13 They usually are synthesized in critical requirements (0.9 MPa N2 pressure and 1800 °C), the high cost limits their utility in agricultural industry. As an alternative, Mn4+-doped oxides14–17 catch the public's attention due to its attractive luminescence properties of high-efficacy, low cost, high stability and eco-friendliness. Many strategies have been tried out to enhance the photoluminescence emission of Mn4+-doped phosphors, such as matrix solid solution modification,18–20 co-doped charge compensator21,22 or fluxing agent,23,24 and energy transfer from sensitizer to activator.25–27
10,11 and MAlSiN3:Eu2+ (M = Ca, Sr, Ba).4,12,13 They usually are synthesized in critical requirements (0.9 MPa N2 pressure and 1800 °C), the high cost limits their utility in agricultural industry. As an alternative, Mn4+-doped oxides14–17 catch the public's attention due to its attractive luminescence properties of high-efficacy, low cost, high stability and eco-friendliness. Many strategies have been tried out to enhance the photoluminescence emission of Mn4+-doped phosphors, such as matrix solid solution modification,18–20 co-doped charge compensator21,22 or fluxing agent,23,24 and energy transfer from sensitizer to activator.25–27
Solid solution treatment is a common method in phosphor modification with many advantages such as increase lattice distortion and lattice rigidity. Some materials change phase accompanied by a large volume contraction at high temperature reaction which have damage to their luminescence properties. This phenomenon can be reduced by the addition of solid solution ions. There is no crystal transformation in the formation of solid solution, but volume effect was reduced which can enhance the resistance of phosphors to high temperature. After the formation of solid solution, there are some distortions on the lattice structure which is in a high energy activated state, and it is conducive to chemical reaction. Therefore, solid solution treatment can improve the luminescence performance and thermal stability.28–30 There are many conditions for solid solution formation, such as similar ion radius size, alike crystal structure or chemical formula, similarity of ion electronegativity, and the same of ion value. For example, Ca14Al10Zn6O35![[thin space (1/6-em)]](https://www.rsc.org/images/entities/char_2009.gif) 31 and Ca14Ga10Zn6O35
31 and Ca14Ga10Zn6O35![[thin space (1/6-em)]](https://www.rsc.org/images/entities/char_2009.gif) 32 has the similar structure, Mn4+-doped Ca14Al10Zn6O35 phosphors show far-red emitting, and the luminescence properties can be improved by substituting Ga3+ for Al3+ ion.33 The similar result was found in Mn4+ or Ce3+ doped (Y,Lu)3(Al,Ga)5O12 system.22,34,35
32 has the similar structure, Mn4+-doped Ca14Al10Zn6O35 phosphors show far-red emitting, and the luminescence properties can be improved by substituting Ga3+ for Al3+ ion.33 The similar result was found in Mn4+ or Ce3+ doped (Y,Lu)3(Al,Ga)5O12 system.22,34,35
Another important way to enhance luminescence properties is co-doped charge compensator in same matrix. For instance, the luminescence performance of Y3Al5O12:Mn4+ red phosphor can be enhanced by co-doping Ge4+, Sc3+, Ca2+, Mg2+, Sr2+, Li+, Na+ ions.21,33,36 In addition, aluminate phosphors are mainly compounded via high-temperature solid-state reaction in traditional production, which requires high sintering temperature. In order to reduce the reaction temperature and surface defects of the product, and increase the crystallinity of the product, fluxing agent often needs to add in the raw material such as BaF2, NaF, NH4Cl and H3BO3.35 The third method to improve luminescence performances is to use energy transfer effect, such as Ca14Al10Zn6O35:Ti4+,Mn4+,31 Ca3Al4ZnO10:Bi3+,Mn4+,26 Gd2ZnTiO6:Mn4+,Yb3+,37 and so on.
As we know, the Mn4+ doped Y3(Al,Ga)5O12 system show a wide range of 225–575 nm excitation spectrum. The Dy3+ can exhibit blue 480 nm (4F9/2–6H15/2) sharp band and orange 585 nm (4F9/2–6H13/2) luminescence performance in Y3(Al,Ga)5O12 matrix for n-UV excitation.38–41 Based on the resonance-type energy transfer theory, we assume that Dy3+ could improve the emission intensity of Mn4+ in Y3(Al,Ga)5O12 matrix. Energy transfer from Dy3+ to Mn4+ has been reported in several works. Chen et al.41 and Zhou et al.32 verified energy transfer from Dy3+ to Mn4+ in Ca14Al10Zn6O35 and Ca14Zn6Ga10O35 phosphors respectively, which indicate that it is possible for the occurrence of similar energy transfer in Y3(Al,Ga)5O12 matrix. Herein, we intend to synthesize a novel Dy3+ and Mn4+ co-doped Y3(Al,Ga)5O12 phosphor which show both blue and red luminescence for plant growth LEDs.
In this study, a novel Y3Al4GaO12:Mn4+,Dy3+ (YAGO:Mn4+,Dy3+) phosphor was prepared via conventional solid-state method at high-temperature in air. Samples as-obtained show bright red, orange and blue light emission, which match the absorption of plant pigments in a large extent. The crystal structure, optical properties and luminescence lifetime are researched in detail. All measurements indicated that the YAGO:Mn4+,Dy3+ phosphors is promising to applicate in plant growth LEDs.
2. Experimental work
2.1 Preparation of samples and device
A series of Y3Al4GaO12:Mn4+ (YAGO:Mn4+), Y3Al4GaO12:Dy3+ (YAGO:Dy3+) and Y3Al4GaO12:Mn4+,Dy3+ (YAGO:Mn4+,Dy3+) phosphors were synthesized via high-temperature solid-state method. The chemical reagents were Y2O3 (99.999%), Ga2O3 (99.999%), Al2O3 (99.999%), Dy2O3 (99.999%), Mn(NO3)2 (AR), MgO (AR), H3BO3 (AR) and LiF (99.99%), all raw materials bought from Aladdin without further purification. Simultaneously, 5 w% H3BO3 (AR) and LiF acted as a flux. First of all, stoichiometric amounts of the raw material were mixed up adequately with a moderate amount of alcohol and ground thoroughly for 30 min. Then put the powder into alumina crucibles, fired at 1500 °C for heating rate at 5 °C min−1 in ambient atmosphere and last for 4 hours. Finally, the products were cooled to room temperature naturally and then ground for further used. The LED devices were fabricated by using the Y3Al4GaO12:Mn4+,Dy3+ phosphors and 365 nm near-UV chips.2.2 Characterization
X-ray powder diffraction (XRD) analysis was tested through a Rigaku D/SHIMADZU-6000 X-ray diffractometer with Cu-Kα radiation (λ = 1.5406 Å), operating at 40 kV and 40 mA, setting the 2θ from 10° to 80°. The photoluminescence excitation (PLE) and emission (PL) spectra were measured by F-7000 Spectrophotometer (Hitachi, Japan) equipped with a 150 W Xe lamp. For the measurement of UV-vis absorption spectra, U-3310 spectrophotometer (Hitachi, Japan) was used. The decay curves and photoluminescence quantum efficiency were measured under excitation at 366 nm via FLS980 fluorescence spectrometer (Edinburgh, UK) using a millisecond flash lamp. All the characterizations obtained at room temperature except the temperature-dependent PL spectra.3. Result and discussion
3.1 Structure characterization and phase identification
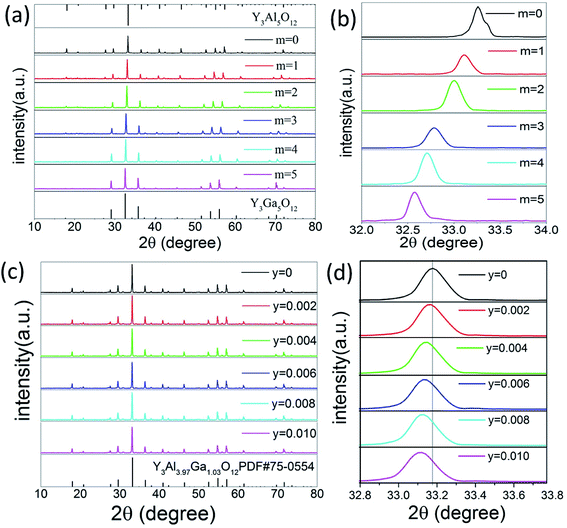
The phase composition characterized by X-ray diffraction (XRD). Fig. 1(a) presents the XRD patterns of the Y3Al5−mGamO12:0.004Mn4+ (m = 0–5). With the doping concentration of Ga3+ increased, the curve changed from Y3Al5O12 (PDF#72-1315) to Y3Ga5O12 (PDF#43-0512) gradually. Fig. 1(b) shows a broad peak ranging from 32° to 34°, indicating the Al site in the matrix was replaced by Ga significantly. This substitution induced the diffraction peak of these samples shifting towards low-angel direction, because Ga3+ has large ionic radius (r = 0.47 Å, CN = 4; r = 0.62 Å, CN = 6) than Al3+ (r = 0.39 Å, CN = 4; r = 0.54 Å, CN = 6).26 The situation was confirmed by the following analysis of PL spectra excited at different wavelengths. The XRD patterns of Y3Al4GaO12:Mn4+,yDy3+ (y = 0–0.010) phosphors are shown in Fig. 1(c), which well indexed to standard card PDF#75-0554 of Y3Al3.97Ga1.03O12 phase. This result indicates Y3Al4GaO12:Mn4+,yDy3+ phosphors keep its original crystal structure without significant variation. The main peak between 32.6 and 33.8° was found to be slightly offset to low-angle in Fig. 1(d), for Dy3+ has larger ionic radius (r = 1.03 Å, CN = 8) than Y3+ ion (r = 1.02 Å, CN = 8) and Mn4+ ion has similar ionic radius (r = 0.39 Å, CN = 4; r = 0.53 Å, CN = 6) compared to Al3+ ion (r = 0.39 Å, CN = 4; r = 0.53 Å, CN = 6).42 This result is owing to the Dy3+ ion replaced Y3+ and Mn4+ replaced Al3+ ion in the [YO8], [AlO4] and [AlO6] site of the matrix effectively which is similar to the literature review reported by Liudmyla M. et al.43 and Chen et al.32 Fig. S1(a)† presents the XRD patterns of Dy3+-doped Y3Al4GaO12 phosphors, and they match the standard card of Y3Al3.97Ga1.03O12 well and have the same variation tendency like Fig. 1(c).Fig. 2 shows the unit-cell structure of Y3Al3.97Ga1.03O12 crystal (abbreviated as YAGO) and details about atomic in the cubic octahedral structure. The unit-cell is composed of three main sites. They are tetrahedral [AlO4] octahedral [AlO6], and dodecahedral [YO8]. Generally, Mn4+ activator likes to replace the Al3+ in [AlO6] site because Mn4+ has the similar ionic radii to Al3+ and octahedron are unstable compared to tetrahedron. Dy3+ should occupy Y3+ ion site in the host according to the principle of ionic radii matching,44 which has been elucidated in the previous section. The substitution mechanism demonstrates that Dy3+ replaced Y3+ on dodecahedral site [YO8] and Mn4+ prefer to substitute Al3+ on octahedral [AlO6] compared to [AlO4] in the unit-cell structure of YAGO crystal.
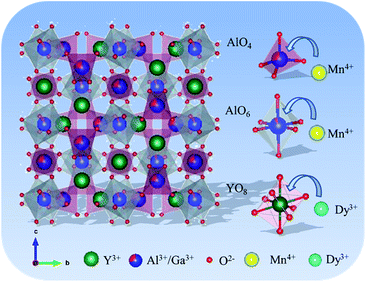 | ||
| Fig. 2 Unit-cell structure of Y3Al3.97Ga1.03O12 crystal and substitution mechanism among different ion in the phosphors. | ||
3.2 Photoluminescence properties of Y3Al5O12:xMn4+ (x = 0.002–0.010) and Y3Al5−mGamO12:0.004Mn4+ (m = 0–5) phosphors
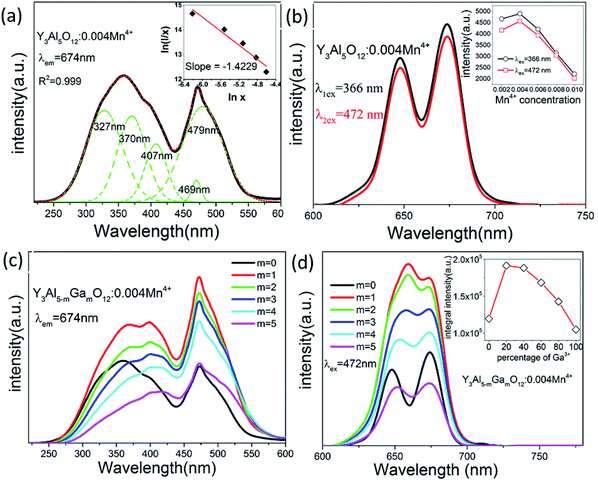
Photoluminescence property is an important part to evaluate phosphors, which should be investigated in details. Fig. 3(a) and (b) show the luminescence excitation and emission spectra of Y3Al5O12:0.004Mn4+ phosphors. When monitoring at 674 nm, there were two broad bands of each excitation spectrum that ranged from 220 to 430 nm (labeled A) and 430 to 600 nm (labeled B), and their peak located at 366 nm and 472 nm respectively. The PLE spectrum can be fitted into five Gaussian peaks, of which the 327 nm and 370 nm peaks are contributed to the 4A2 → 4T1 transitions of Mn4+, other peaks located at 407 nm, 469 nm and 479 nm all originated from the 4A2 → 4T2 transitions of Mn4+.27 Upon excitation at 366 and 472 nm, the as-synthesized phosphors show red emission ranging from 600 to 720 nm with two peaks at 648 nm and 674 nm which can be ascribed to the spin-forbidden 2E → 4A2 transition of Mn4+. The emission intensity came to the maximum when the concentration of Mn4+ was 0.004 no matter excited at 366 nm or 472 nm, as presented in the inset of Fig. 3(b). The details about the emission spectra of Y3Al5O12:xMn4+ (x = 0.002–0.010) are shown in Fig. S3.†Single ion doped phosphor concentration quenching model is shown in the inset of Fig. 3(a). The type of multipolar–multipolar interaction can be reflected by the formula45 based on the Dexter's theory:
 | (1) |
As shown in Fig. 3(c), it is obvious that the substitution of Ga3+ enhances the intensity of excitation spectra, which indicates these phosphors can be excited easily. With concentration of Ga3+ increasing, the intensity of photoluminescence excitation and emission spectra reached maximum when m = 1 then decreased. So we chose Y3Al4GaO12 (abbreviated as YAGO) as matrix in the follow-up experiment.
3.3 Energy transfer in YAGO:Mn4+,Dy3+phosphors
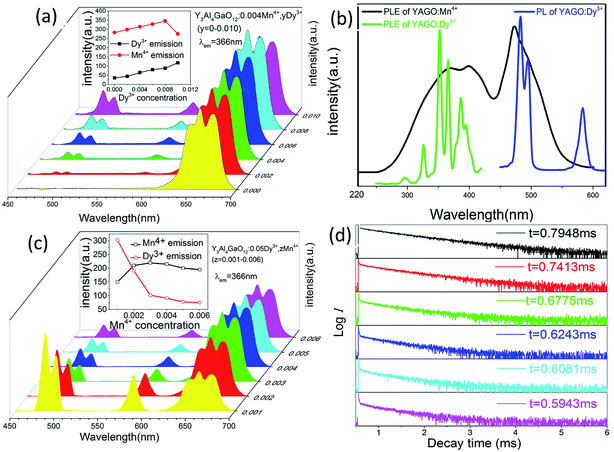
The emission of Mn4+ ion can be further improved via the addition of Dy3+ ion, as shown in Fig. 4(a). Two characteristic emission bands can be detected at 462–490 nm and 554–607 nm in YAGO:Mn4+,Dy3+ phosphor under excitation at 366 nm, which corresponding to 4F9/2 → 6H15/2 and 4F9/2 → 6H13/2 transitions in the 4f levels of Dy3+ ions, respectively.46 And red emission ranging from 600 to 720 nm should be ascribed to the 2E → 4A2 transition of Mn4+. What's more, Fig. S2(a) and (b)† show the photoluminescence excitation and emission spectra of YAGO:Dy3+, the optimal Dy3+ doping concentration is 0.05. The excitation peaks located at 326.5, 352.5, 366.5 and 387.0 nm attribute to the intrinsic f–f transitions of Dy3+ from the ground state 6H15/2 to the excited state 4L19/2, 6P7/2, 6P5/2 and 4I13/2, respectively.46Fig. 4(b) presents a large overlapping part between the PLE spectrum of YAGO:Mn4+ and the PL spectrum of YAGO:Dy3+. It is one of the indispensable factors for effective energy transfer. Therefore, it is possible for the occurrence of energy transfer from Dy3+ to Mn4+ ions in YAGO matrix. In order to confirm the energy transfer further, the content of Dy3+ ion was fixed at 0.05 and the concentration of Mn4+ was increased from 0.001 to 0.006. According to Fig. 4(c), with the concentration of Mn4+ increasing, the emission of Dy3+ decreased gradually while the emission of Mn4+ increased until Mn4+ concentration exceed 0.003 and then decreased due to the concentration quenching effect. Such experimental results are consistent with the prediction that there is energy transfer from Dy3+ to Mn4+ in YAGO host.
As mentioned in Fig. 4(c), the emission intensity of Mn4+ decrease when the content of Mn4+ exceeds the critical concentration because of the concentration quenching phenomenon which is related to energy transfer. In generally, the critical distance (Rc) is a key parameter to evaluate the performance of sensitizer and activator, which is usually calculated by the following formula:47,48
 | (2) |
The PL decay curves were investigated to calculate the lifetime and then to verify the energy transfer from Dy3+ to Mn4+. Monitor at 483 nm for YAGO:Mn4+,Dy3+ phosphors under the excitation of 366 nm, the decay curves are illustrated in Fig. 4(d). These data fitted a typical single-exponential function well:25
 | (3) |
Fig. 5(a) presents the UV-vis absorption spectra of YAGO, YAGO:Mn4+, YAGO:Dy3+ and YAGO:Mn4+,Dy3+. Two characteristic absorption bands were found in all four samples that name Band A (220–260 nm) and Band B (260 to 430 nm). Band C (430–550 nm) existed only in Mn4+-doped phosphor, which should be attributed to the 4A2 → 4T1 transition of Mn4+. The absorption intensity enhanced by adding Dy3+ ion, and further enhanced by co-doping Mn4+ and Dy3+ ions.
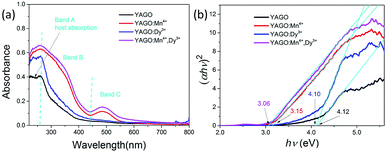 | ||
| Fig. 5 (a) Comparison the UV-vis absorption spectra of YAGO phosphors with different dopants; (b) the plot of (αhν)2 versus hν based on the direct gap of different samples. | ||
To understand the effect of the addition of Mn4+ and Dy3+ ions on YAGO matrix, the band gap of four materials were researched, which can be calculated by the following equation according to the UV-vis absorption plots:49
| (αhν)2 = A(hν − Eg) | (4) |
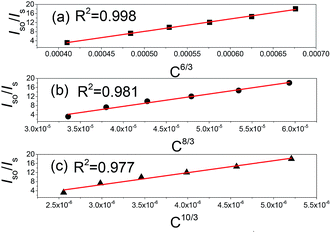
According to Reisfeld's approximation and Dexter's energy transfer formula of multipolar interaction, the equation can evaluate interaction mechanism:50,51
 | (5) |
We tested the temperature-dependent emission spectra of Y3Al4GaO12:0.004Mn4+,0.008Dy3+ and Y3Al5O12:0.004Mn4+ from 298 K to 473 K in details, as shown in Fig. 7. The integral intensity of the YAGO:Mn4+,Dy3+ sample kept 59.61% when the temperature came to 423 K while YAG:Mn4+ maintained 90.10%. Though it seems decreased in the value of thermal stability, other effective emission bands for plant growth lighting were induced and keep its thermal stability well. In addition, it is possible that its thermal stability can be improved through a series of modifications in the future.
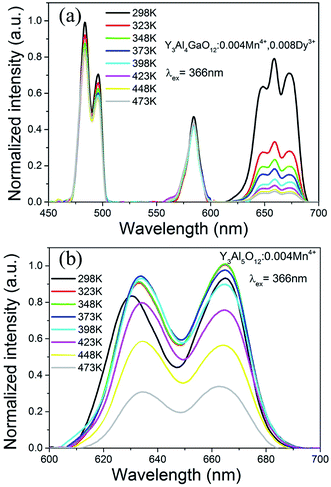 | ||
| Fig. 7 Temperature-dependent emission spectra of (a) Y3Al4GaO12:Mn4+,Dy3+ and (b) Y3Al5O12:Mn4+ from 298 K to 473 K under excitation at 366 nm. | ||
The quantum yield of Y3Al4GaO12:0.004Mn4+,0.008Dy3+ phosphor was measured under 366 nm excitation which as shown in Fig. 8, the value of IQE was calculated to be 18.0% through the following equation:52
 | (6) |
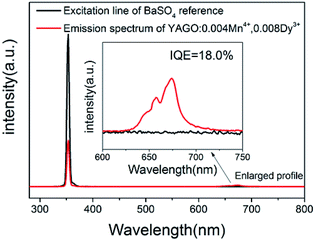 | ||
| Fig. 8 Excitation line of BaSO4 and the PL spectrum of Y3Al4GaO12:0.004Mn4+,0.008Dy3+ phosphor collected using an integrating sphere. | ||
For clearly describing the energy change in YAGO:Mn4+,Dy3+ phosphor, the excitation, emission and energy transfer processes of the sample were shown in Fig. 9. Dy3+ ions were excited from 6H15/2 energy level to high excited state level such as 6P7/2, 4I13/2, 4F9/2 or even the conduction under irradiation of the n-UV light, then relaxed to 6H13/2 and 6H15/2 from 4F9/2 with blue and orange emission. Meanwhile, Mn4+ ion can be excited to 4T1, 4T2 level and conduction band from 4A2 under n-UV radiation, the excited Mn4+ dropped to the 2E energy level then relaxed to 4A2 with red light emission. In this process, the energy transfer occurs from excited state level 4F9/2 of Dy3+ ions to the excited state level 4T2 of Mn4+ ions, then relaxed to the lowest excited state level 2E of Mn4+ ions through non-radiative relaxation, finally came back to the ground state in the form of red emission.
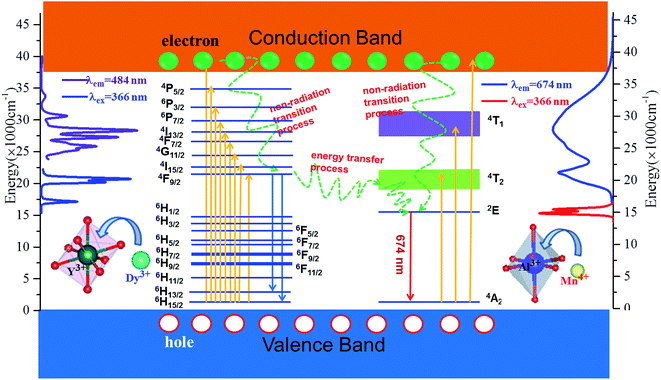 | ||
| Fig. 9 Energy level, electron transitions and energy transfer schematic diagram of Dy3+ and Mn4+ in YAGO matrix. | ||
3.4 LED device fabricated with YAGO:Mn4+,Dy3+ and its electro-luminescent property
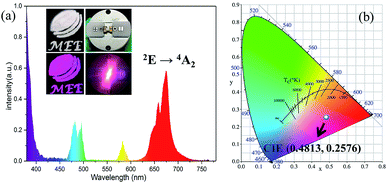
In order to investigate the application of the synthetic YAGO:Mn4+,Dy3+ in indoor plant growth, LED devices were fabricated with YAGO:Mn4+,Dy3+ phosphor and 365 nm near-UV chip. As shown in Fig. 10(a), the phosphor powder was white in daylight and presented purplish red under the ultraviolet lamp; it appeared milky white in the LED device and sent bright purplish red emission under constant current of 20 mA. The electroluminescence spectrum was mainly consisted of red, blue and little orange emission from YAGO:Mn4+,Dy3+ phosphor and near ultraviolet emission from the chip, which consistent with luminescence spectrum of the sample. Fig. 10(b) shows the resultant CIE coordinate value of this LED device was (0.4813, 0.2576). Other CIE coordinate values of devices that combined with different concentration of Mn4+ and Dy3+ co-doped YAGO phosphor are exhibited in Fig. S4,† they changed from purplish red to white light gradually with the increasing content of Dy3+. The result suggests that the novel YAGO Mn4+,Dy3+ phosphor have potential application in plant growth lighting and white LED lighting for their unique optical property.4. Conclusions
To sum up, Mn4+ and Dy3+ co-doped YAGO phosphors were successfully synthesized via conventional high-temperature solid-state method. These phosphors are derived from the crystal structure of Y3Al5O12 and changed to Y3Al4GaO12 host, activators Mn4+ replacing Al3+ site while Dy3+ occupying Y3+ site in the matrix. The Y3Al4GaO12:Mn4+,Dy3+ phosphors show blue, orange and red emission located at 462–490 nm, 554–607 nm and 625–700 nm respectively, which match the absorption spectrum of plant pigment well. And, these three emission bands can be ascribed to the 4F9/2 → 6H15/2 and 4F9/2 → 6H13/2 transition of Dy3+ and the 2E → 4A2 transition of Mn4+, respectively. When the doping concentration of Mn4+ was 0.4% and Dy3+ was 0.8%, optimal property of these phosphors was obtained. There are many evidences for energy transfer from Dy3+ to Mn4+ in the as-obtained Y3Al4GaO12:Mn4+,Dy3+ phosphors. Moreover, LED devices made from the phosphor have good properties. It is indicate that the as-obtained phosphors have potential applications both in optical agriculture and white LED lighting.Conflicts of interest
There are no conflicts to declare.Acknowledgements
The authors would like to gratefully acknowledge funds from National Natural Science Foundation of China (Grant No. 21706060, 51703061), Natural Sciences Foundation of Hunan Province, China (Grant No. 2017JJ3103), Scientific Research Foundation of Hunan Provincial Education Department (Grant No. 17B118) and Hunan Provincial Engineering Technology Research Center for Optical Agriculture (Grant No. 2018TP2003).Notes and references
- M. Kula, M. Rys, K. Mozdzen and A. Skoczowski, Eng. Life Sci., 2014, 14, 57–67 CrossRef CAS.
- T. Nakajima and T. Tsuchiya, ACS Appl. Mater. Interfaces, 2015, 7, 21398–21407 CrossRef CAS PubMed.
- L. Poulet, G. D. Massa, R. C. Morrowc, C. M. Bourget, R. M. Wheeler and C. A. Mitchell, Life Sci. Space Res., 2014, 2, 43–53 CrossRef.
- X. Piao, K. Machida, T. Horikawa, H. Hanzawa, Y. Shimomura and N. Kijima, Chem. Mater., 2007, 19, 4592–4599 CrossRef CAS.
- M. Fang, C. Hsu, Ch. Su, W. Liu, Y. Wang and R. S. Liu, ACS Appl. Mater. Interfaces, 2018, 10, 29233–29237 CrossRef CAS PubMed.
- J. Davis, K. Mills, G. Bobashev, K. Rountree, M. Lamvik, R. Yaga and C. Johnson, Microelectron. Reliab., 2018, 84, 149–156 CrossRef CAS.
- C. W. Yeh, W. T. Chen, R. S. Liu, S. F. Hu, H. S. Sheu, J. M. Chen and H. T. Hintzen, J. Am. Chem. Soc., 2012, 134, 14108–14117 CrossRef CAS PubMed.
- K. T. Bicanic, X. Li, R. P. Sabatini, N. Hossain, C. Wang, F. Fan, H. Liang, S. Hoogland and E. H. Sargent, ACS Photonics, 2016, 3, 2243–2248 CrossRef CAS.
- Z. Zhou, N. Zhou, M. Xia, Y. Meiso and H. T. (Bert) Hintzen, J. Mater. Chem. C, 2016, 4, 9143–9161 RSC.
- Y. Q. Li, J. E. J. van Steen, J. W. H. van Krevel, G. Botty, A. C. A. Delsing, F. J. DiSalvo, G. de With and H. T. Hintzen, J. Alloys Compd., 2006, 417, 273–279 CrossRef CAS.
- Y. Q. Li, G. de With and H. T. Hintzen, J. Solid State Chem., 2008, 181, 515–524 CrossRef CAS.
- J. Li, T. Watanabe, H. i. Wada, T. Setoyama and M. Yoshimura, Chem. Mater., 2007, 19, 3592–3594 CrossRef CAS.
- Y. Tsai, C. Chiang, W. Zhou, J. F. Lee, H. Sheu and R. S. Liu, J. Am. Chem. Soc., 2015, 137, 8936–8939 CrossRef CAS PubMed.
- R. Cao, T. Chen, Y. Ren, T. Chen, H. Ao, W. Li and G. Zheng, J. Alloys Compd., 2019, 780, 749–755 CrossRef CAS.
- Y. Ren, R. cao, T. Chen, L. Su, X. Cheng, T. Chen, S. Guo and X. Yu, J. Lumin., 2019, 209, 1–7 CrossRef CAS.
- R. Cao, X. Liu, K. Bai, T. Chen, S. Guo, Z. Hu, F. Xiao and Z. Luo, J. Lumin., 2018, 197, 169–174 CrossRef CAS.
- K. Li, D. Mare and R. V. Deun, Dalton Trans., 2019, 48, 3187–3192 RSC.
- K. Sankarasubramanian, B. Devakumar, G. Annadurai, L. Sun, Y. Zeng and X. Huang, RSC Adv., 2018, 8, 30223–30229 RSC.
- Q. Sun, S. Wang, B. Li, H. Guo and X. Huang, J. Lumin., 2018, 203, 317–375 CrossRef.
- Q. Sun, S. Wang, B. Devakumar, B. Li, L. Sun, J. Liang and X. Huang, RSC Adv., 2018, 8, 28538–28545 RSC.
- D. Chen, Y. Zhou, W. Xu, J. Zhong, Z. Ji and W. Xiang, J. Mater. Chem. C, 2016, 4, 1704–1712 RSC.
- L. Sun, B. Devakumar, J. Liang, B. Li, S. Wang, Q. Sun, H. Guo and X. Huang, RSC Adv., 2018, 8, 31835–31842 RSC.
- Y. Yu, H. Wang, L. Li, Y. Chen and R. Zeng, Ceram. Int., 2014, 40, 14171–14175 CrossRef CAS.
- S. Xu, L. Sun, Y. Zhang, H. Ju, S. Zhao, D. Deng, H. Wang and B. Wang, J. Rare Earths, 2009, 27, 327–329 CrossRef.
- Z. Zhou, M. Xia, Y. Zhong, Sh. Gai, S. Huang, Y. Tian, X. Lu and N. Zhou, J. Mater. Chem. C, 2017, 5, 8201–8210 RSC.
- Z. Zhou, Y. Zhong, M. Xia, N. Zhou, B. Lei, J. Wang and F. Wu, J. Mater. Chem. C, 2018, 6, 8914–8922 RSC.
- J. Zhou, Q. Liua and Z. Xia, J. Mater. Chem. C, 2018, 6, 4371–4383 RSC.
- X. Ji, J. Zhang, Y. Li, S. Liao, X. Zhang, Z. Yang, Z. Wang, Z. Qiu, W. Zhou, L. Yu and S. Lian, Chem. Mater., 2018, 30, 5137–5147 CrossRef CAS.
- K. Li, D. Zhu and R. V. Deun, Dyes Pigm., 2017, 142, 69–76 CrossRef CAS.
- K. Li, D. Zhu and R. V. Deun, Dalton Trans., 2018, 47, 2501–2505 RSC.
- Z. Zhou, Y. Li, M. Xia, Y. Zhong, N. Zhou and H. T. (Bert) Hintzenc, Dalton Trans., 2018, 47, 13713–13721 RSC.
- Y. Zhou, W. Zhao, J. Chen and Z. Liao, RSC Adv., 2017, 7, 17244–17253 RSC.
- D. Chen, Y. Zhou, W. Xu, J. Zhong, Z. Ji and W. Xiang, J. Mater. Chem. C, 2016, 4, 9044–9051 RSC.
- Y. Zhou, W. Zhao, C. Lu and Z. Liao, Prog. Nat. Sci.: Mater. Int., 2018, 28, 301–307 CrossRef CAS.
- W. Xu, D. Chen, S. Yuan, Y. Zhou and S. Li, Chem. Eng. J., 2017, 317, 854–861 CrossRef CAS.
- J. Long, Y. Wang, R. Ma, C. Ma, X. Yuan, Z. Wen, M. Du and Y. Cao, Inorg. Chem., 2017, 56, 3269–3275 CrossRef CAS PubMed.
- J. Xiang, J. Chen, N. Zhang, H. Yao and C. Guo, Dyes Pigm., 2018, 154, 257–262 CrossRef CAS.
- L. M. Chepygaa, A. Osvet, C. J. Brabecb and M. Batentschuk, J. Lumin., 2017, 182, 200–207 CrossRef.
- J. F. C. Carreira, N. B. Sedrine, T. Monteiro and L. Rino, J. Lumin., 2017, 183, 251–258 CrossRef CAS.
- J. Y. Chong, Y. Zhang, B. K. Wagner and Z. Kang, J. Alloys Compd., 2013, 581, 484–487 CrossRef CAS.
- J. Chen, W. Zhao, N. Wang, Y. Meng, S. Yi, J. He and X. Zhang, J. Mater. Sci., 2016, 51, 4201–4212 CrossRef CAS.
- R. D. Shannon, Acta Crystallogr., 1976, 32, 751–767 CrossRef.
- E. Hertle, L. Chepyga, M. Batentschuk and L. Zigan, J. Lumin., 2017, 188, 582–588 CrossRef.
- K. Li, H. Lian and R. V. Deun, J. Lumin., 2018, 198, 155–162 CrossRef CAS.
- D. L. Dexter, J. Chem. Phys., 1953, 21, 836–850 CrossRef CAS.
- Q. Liu, Y. Liu, Z. Yang, Y. Han, X. Li and G. Fu, J. Alloys Compd., 2012, 515, 16–19 CrossRef CAS.
- G. Blasse, Phys. Lett. A, 1968, 28, 444–445 CrossRef CAS.
- X. Huang, B. Li and H. Guo, J. Alloys Compd., 2017, 695, 2773–2780 CrossRef CAS.
- L. Wu, Y. Zhang, M. Gui, P. Lu, L. Zhao, S. Tian, Y. Kong and J. Xu, J. Mater. Chem., 2012, 22, 6463–6470 RSC.
- D. L. Dexter and J. H. Schulman, J. Chem. Phys., 1954, 22, 1063–1070 CrossRef CAS.
- Y. F. Nicolau and J. C. Menard, J. Cryst. Growth, 1988, 92, 128–142 CrossRef CAS.
- X. Ding, G. Zhu, W. Geng, Q. Wang and Y. Wang, Inorg. Chem., 2015, 55, 154–162 CrossRef PubMed.
- U. B. Humayoun, S. N. Tiruneh and D. H. Yoon, Dyes Pigm., 2018, 152, 127–130 CrossRef.
- L. Li, Y. Pan, Z. Chen, S. Huang and M. Wu, RSC Adv., 2017, 7, 14868–14875 RSC.
Footnotes |
| † Electronic supplementary information (ESI) available. See DOI: 10.1039/c9ra00700h |
| ‡ These authors contributed equally to this work. |
| This journal is © The Royal Society of Chemistry 2019 |

