 Open Access Article
A reduced graphene oxide–borate compound-loaded melamine sponge/silicone rubber composite with ultra-high dielectric constant
Hong Zhanga,
Chuan-Guo Ma *ab,
Pei-Bang Daia and
Jian Zhang
 a
a
aSchool of Material Science and Engineering, Guilin University of Electronic Technology, Guilin 541004, China. E-mail: machuanguo@guet.edu.cn
bGuangxi Key Laboratory of Information Materials, Guilin 541004, China
First published on 8th May 2019
Abstract
Herein, at first, graphene oxide (GO) was prepared by a modified Hummers' method, compounded with borates and then loaded onto a melamine sponge (MS) skeleton by an impregnation–reduction method to obtain a reduced graphene oxide (rGO)–borate compound (rGB)-loaded MS. Then, MS/rGB/silicone rubber (SR) composites were prepared by a vacuum infusion process. Moreover, the microstructures, electrical conductivity, and dielectric properties of the composites were investigated. The results showed that rGO presented a sheet-like structure, compounding with borates produced during the reduction of GO by sodium borohydride. rGB was co-loaded onto the MS skeleton, and a three-dimensional percolation network was successfully constructed in the MS/rGB/SR composite. In addition, there was an efficient synergistic effect between rGO and borates, which significantly improved the dielectric constant of the composites. At the rGO volume fraction of 1.89 vol%, the composite had the volume resistivity of 6.57 × 10⁴ Ω cm, the ultra-high dielectric constant of 2.71 × 10⁴ with the dielectric loss of 1.36 at 1 kHz, and the relatively low percolation threshold of 0.815 vol%. Furthermore, the composite exhibited high compression sensitivity at low compressive strains.
1 Introduction
High-performance dielectric materials are attracting significant attention due to their potential applications in advanced electronic devices such as sensors, transistors, electronic packages and supercapacitors.1–4 To meet the practical application requirements, dielectric materials usually need to have high dielectric constants.5 Polymer-based dielectric materials are considered as promising composite materials, and their dielectric properties can be improved by the addition of different types of fillers to meet the abovementioned requirement.6 These fillers can generally be classified into two types: dielectric ceramic fillers and conductive fillers. The dielectric ceramic fillers mainly include barium titanate (BaTiO3),7 strontium titanate (SrTiO3)8 and calcium titanate (CaTiO3).9 The dielectric constant of composites is usually limited to less than 100 even if the ceramic fillers are added at up to 50 vol%. This high filler content not only significantly reduces the flexibility of the polymer matrix and increases the dielectric loss, but also leads to problems such as high composite weight, high preparation cost, difficulty in processing and poor mechanical properties.10 Polymer-based conductive filler composites have the advantages of lightweightness, low cost, high flexibility, high corrosion resistance, excellent processability, and adjustable dielectric constant and dielectric loss.11 To a certain extent, these advantages overcome the limitations of polymer-based ceramic filler composites and can help in the achievement of higher dielectric constants at ultralow filler concentrations;6,12,13 therefore, these composites have broad application prospects in health monitoring, wearable electronic devices, motion sensors and electromagnetic shielding.14–16 The conductive network formed by conductive fillers can usually improve the electrical properties of composites. Common conductive fillers are metals,17 carbon materials18–21 (e.g., carbon black, fullerene, graphite, graphene, reduced graphene oxide (rGO), carbon nanotubes, carbon nanofibers, and carbon nanowires), and conducting polymers.22 Among them, graphene has large specific surface area, high aspect ratio, and excellent electrical properties and is currently a research hotspot for the preparation of functional polymer-based composites.Some recent studies23–25 have shown that as compared to the direct mixing of graphene with a polymer matrix, the construction of a three-dimensional conductive network by the porous structure of a sponge as a template is a more effective method for the preparation of advanced functional composites for applications in the fields of sensors, flexible conductors, and energy storage. Zhou et al.23 used polyurethane sponge as a template and graphene and carbon nanotubes as conductive fillers for the preparation of epoxy resin composites with low density, superelasticity, high recovery rate, electroactive shape memory and reversible compressibility. Yang et al.24 have used thermostable polyimide (PI) sponges as a template to obtain conductive reduced graphene oxide (rGO)-loaded PI sponges that display excellent mechanical stability and flexibility and can be used as effective pressure sensors to measure heartbeat, joint activity, and airflow. Moussa et al.25 used a commercial-grade kitchen sponge as a scaffold on which both graphene platelets (GnPs) and polyaniline (PANI) nanorods were deposited. The sponge/PANI/GnP composite exhibited the specific capacitance of 965.3 F g−1 at the scan rate of 10 mV s−1 in a 1.0 M H2SO4 solution. Moreover, it could be used to construct high-performance, low-cost supercapacitors. However, at present, only few studies have been reported on the dielectric properties of template-based three-dimensional graphene composites that have potential applications in the fields of high-density energy-storage materials.
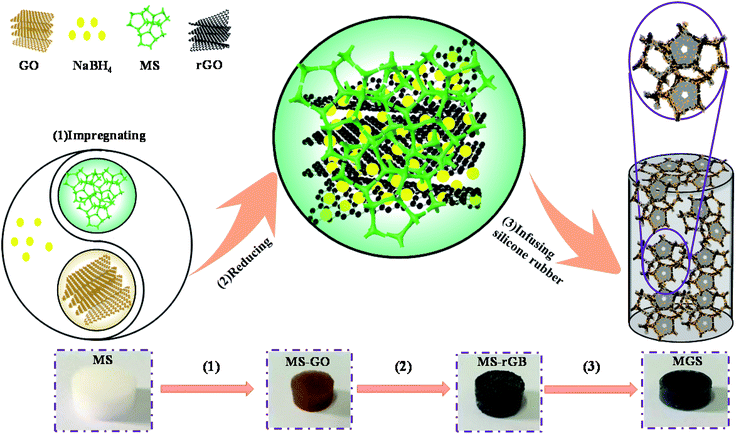
In this study, using a commercially available melamine sponge (MS) as a three-dimensional template, a reduced graphene oxide–borate compound (rGB) as a filler, and a silicone rubber (SR) as a polymer matrix, MS/rGB/SR composites (MGS) were fabricated. This method was different from the preparation processes reported in other studies since the reducing agent sodium borohydride (NaBH4) was not washed away after the reduction of graphene oxide (GO) but compounded with the rGO sheets in the form of borates as oxidation products. Thus, a large number of micro capacitors formed to provide the possibility of an ultra-high dielectric constant of the composites. The compound of the rGO sheet and borates was loaded onto the MS skeleton to obtain composites with a three-dimensional percolation network, and the infused SR matrix provided better stability and rubber elasticity to the composites. The entire preparation process is simple and low-cost, and the as-synthesized composite has good application prospects in the fields of dielectric energy storage, flexible wearable devices, and deformation sensors.
2 Experimental
2.1 Materials
Melamine sponges were obtained from Ningbo Isida Group Co. Ltd., China, without any surface treatment. Flake graphite with the mesh size of 350 was purchased from Nanjing Xianfeng Nanomaterials Technology Co. Ltd., China. The reducing agent sodium borohydride (NaBH4) was provided by Sinopharm Chemical Reagent Co. Ltd., China. A condensed room-temperature vulcanized silicone rubber (dihydroxy polydimethylsiloxane, RTV-2 type), dimethyl silicone oil (H201-350) and a curing agent were purchased from Xiamen Xinchuang Li Co. Ltd., China.2.2 Preparation of the MGS composite
The schematic of the preparation and structure of the MS/rGB/SR composite is shown in Fig. 1. At first, a certain amount of GO prepared by the modified Hummers' method26 was ultrasonically well dispersed in deionized water in a hydrothermal reactor. An MS cylinder in white color with the diameter of 12 mm and the height of 5 mm was immersed in the dispersion system to obtain the MS–GO cylinder in brown color. Then, the dispersion system was adjusted to have the pH of 9–10 followed by the addition of NaBH4 at the mass ratio of NaBH4 to GO of 8![[thin space (1/6-em)]](https://www.rsc.org/images/entities/char_2009.gif) :
:![[thin space (1/6-em)]](https://www.rsc.org/images/entities/char_2009.gif) 1 and then placed in an oven at 100 °C for 2 h. Subsequently, the resulting MS–GO cylinder was not washed and directly dried at 80 °C for 6 h to obtain the MS–rGB cylinder in black color. Finally, the SR, curing agent and dimethyl silicone oil were uniformly mixed at the mass ratio of 100
1 and then placed in an oven at 100 °C for 2 h. Subsequently, the resulting MS–GO cylinder was not washed and directly dried at 80 °C for 6 h to obtain the MS–rGB cylinder in black color. Finally, the SR, curing agent and dimethyl silicone oil were uniformly mixed at the mass ratio of 100![[thin space (1/6-em)]](https://www.rsc.org/images/entities/char_2009.gif) :
:![[thin space (1/6-em)]](https://www.rsc.org/images/entities/char_2009.gif) 1
1![[thin space (1/6-em)]](https://www.rsc.org/images/entities/char_2009.gif) :
:![[thin space (1/6-em)]](https://www.rsc.org/images/entities/char_2009.gif) 20 and then infused into the MS–rGB cylinder. The resulting sample was placed in a vacuum oven for 10 min to remove the bubbles and then cured at room temperature for 24 h to obtain the MGS composite. In addition, the control samples rGB/SR, MS/SR, MS/rGO/SR and MS/borate/SR were prepared by the following process. The rGB powder was obtained by drying the mixed solution used to prepare MS–rGB, and the rGB/SR sample with a 1.89 vol% rGB content was prepared by evenly mixing the rGB powder with SR and using the same curing process as that used in the case of MS/rGB/SR. MS–rGO was obtained by washing MS–rGB several times with deionized water to remove borates. MS/rGO/SR was prepared by infusing SR into the MS–rGO cylinder. MS–borates were obtained by the same preparation process as that used for MS–rGB except for the addition of GO. MS/SR, MS/rGO/SR and MS/borate/SR were prepared by directly infusing SR into MS, MS–rGO and MS–borate cylinder and using the same curing process.
20 and then infused into the MS–rGB cylinder. The resulting sample was placed in a vacuum oven for 10 min to remove the bubbles and then cured at room temperature for 24 h to obtain the MGS composite. In addition, the control samples rGB/SR, MS/SR, MS/rGO/SR and MS/borate/SR were prepared by the following process. The rGB powder was obtained by drying the mixed solution used to prepare MS–rGB, and the rGB/SR sample with a 1.89 vol% rGB content was prepared by evenly mixing the rGB powder with SR and using the same curing process as that used in the case of MS/rGB/SR. MS–rGO was obtained by washing MS–rGB several times with deionized water to remove borates. MS/rGO/SR was prepared by infusing SR into the MS–rGO cylinder. MS–borates were obtained by the same preparation process as that used for MS–rGB except for the addition of GO. MS/SR, MS/rGO/SR and MS/borate/SR were prepared by directly infusing SR into MS, MS–rGO and MS–borate cylinder and using the same curing process.
2.3 Characterization
The change in the chemical structure of GO was characterized by a confocal laser Raman spectrometer (HORIBA Scientific, LabRAM HR Evolution, France). A Fourier infrared spectrometer (FTIR, Bruker Tensor 27, Germany) was used to analyze the composition of the conductive filler before and after reduction. The binding energy of atoms on the surface elements of the conductive fillers was analyzed by an X-ray photoelectron spectrometer (XPS, Thermo Fisher, ESCALAB 250Xi, USA). The crystal composition of the conductive fillers was analyzed by an X-ray diffractometer (XRD, Dutch Palac Co. Ltd., PIXCED3D). The interfacial microstructure and surface morphology of the MS–rGB sample were observed using field-emission scanning electron microscopy (SEM, FEI, Quanta FEG 450, USA) and energy dispersive X-ray spectroscopy (EDS, Oxford, X-Max20, UK). The piezoresistive property of the MGS composites was investigated by a digital ultra-high resistance micro current meter (Beijing Huajinghui Technology Co. Ltd., EST 121, China). The specimen was clamped in a self-made fixture with adjustable expansion, and its volume resistivity variation was determined by applying different compressive strains. The dielectric property of the MGS composites in the frequency range of 1 kHz to 110 MHz was investigated by a precision impedance analyzer (Agilent Co. Ltd., Model 4294A, USA).3 Results and discussion
3.1 Characterization of GR, GO and rGB
Fig. 2 presents the Raman, FTIR, and XPS spectra and XRD patterns of GR, GO and rGB. In the Raman spectra (Fig. 2a), the relative intensity of the D-band (1352 cm−1) of the symmetric A1g mode and the G-band (1589 cm−1) of the E2g vibration mode was observed for all the samples. The intensity ratio of the D band to the G band (ID/IG) can usually be used to indirectly characterize the lattice integrity of the sample.27 The Lorentz peak fitting of the Raman spectra shows that the ID/IG value of GR is 0.227, indicating that the lattice structure of GR is more ordered, and the proportion of carbon atoms in sp2 hybridization is larger as compared to that in the case of GO and rGO. After the oxidation reaction of GR, the ID/IG value of GO increases to 2.078 due to the oxidation of GR and the introduction of oxygen-containing functional groups between sheets; this results in the destruction of the original crystal structure and the transformation of some sp2-hybridized carbon atoms into sp3-hybridized carbon atoms.28 After the reduction reaction, the ID/IG value decreases from 2.078 to 1.975; this indicates that the oxygen-containing functional groups gradually disappear, and GO is partially reduced to rGO.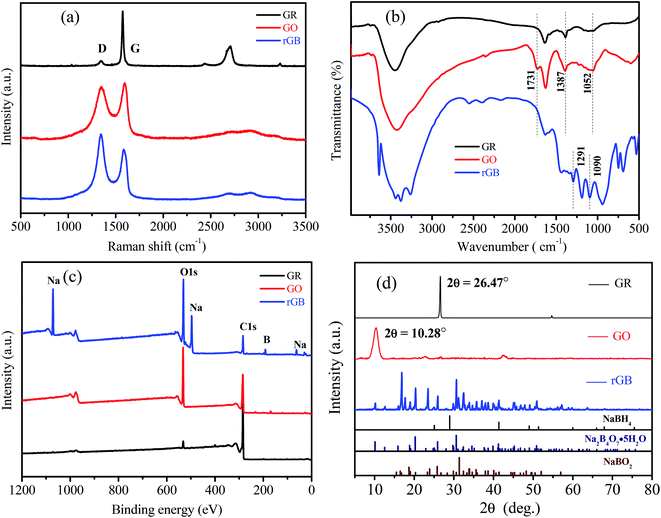 | ||
| Fig. 2 (a) Raman spectra, (b) FTIR spectra, (c) XPS spectra of GR, GO and rGB, and (d) XRD patterns of GR, GO, rGB, NaBH4, Na2B4O7·5H2O and NaBO2. | ||
In the FTIR spectra (Fig. 2b), after the oxidation of GR, a weak C![[double bond, length as m-dash]](https://www.rsc.org/images/entities/char_e001.gif) O stretching vibration peak was observed at 1731 cm−1 for GO, and the strength of the C–O stretching vibration peak at 1052 cm−1 was obviously enhanced; on the other hand, both peaks disappeared after GO was reduced to rGO.29 This was because GR was oxidized to GO, and oxygen-containing functional groups were introduced between GO layers, which were then significantly reduced by NaBH4. Note that some new absorption peaks corresponding to the B–O stretching vibration appeared at 1291 cm−1 and 1090 cm−1 and shifted right as compared to the case of borax;30 this could be attributed to the interaction between borates and rGO.
O stretching vibration peak was observed at 1731 cm−1 for GO, and the strength of the C–O stretching vibration peak at 1052 cm−1 was obviously enhanced; on the other hand, both peaks disappeared after GO was reduced to rGO.29 This was because GR was oxidized to GO, and oxygen-containing functional groups were introduced between GO layers, which were then significantly reduced by NaBH4. Note that some new absorption peaks corresponding to the B–O stretching vibration appeared at 1291 cm−1 and 1090 cm−1 and shifted right as compared to the case of borax;30 this could be attributed to the interaction between borates and rGO.
The XPS spectra (Fig. 2c) showed that the intensity of the O1s peak sharply increased after the oxidation of GR, and the intensity of the O1s peak of rGO did not decrease after the reduction of GO because residual NaBH4 reacted with oxygen-containing functional groups on GO and water to produce oxygenated compounds that should be borates. The presence of characteristic peaks of Na and B in the XPS spectra further confirmed the presence of borates in the reduction product.
As shown in the XRD patterns (Fig. 2d), a sharp basal reflection peak (002) of GR with a regular crystal structure appeared at 2θ = 26.47°, corresponding to the hexagonal arrangement and the stacking of the atomic layer. GO exhibits a characteristic diffraction peak at 2θ = 10.28°,27 and the peak disappears after reduction. According to Bragg's law, the interplanar spacing of GR was calculated to be 0.336 nm, and it increased to 0.860 nm after oxidation; this suggested that the introduction of oxygen-containing functional groups led to an increase in the interplanar spacing of GR. NaBH4 reacts with water as follows: NaBH4 + 2H2O = NaBO2 + 4H2↑, and excessive hydrolysis may also lead to the production of borax. According to the comparison between the XRD spectra of rGO and the PDF standard card, it was concluded that sodium metaborate (NaBO2) and borax pentahydrate (Na2B4O7·5H2O) were present in the reduction product that were collectively referred to as borates. However, there was no characteristic peak of NaBH4; this indicated that NaBH4 was completely converted to borates. Based on the comprehensive analyses conducted by Raman spectroscopy, FTIR spectroscopy, XPS and XRD, it was confirmed that there was a mixture of rGO and borates in MS because the oxidation products of residual NaBH4 were retained on the surface of rGO and MS skeleton instead of being washed away after the reduction reaction.
3.2 Structure and morphology of MS–rGB
Fig. 3 shows the microstructure of the MS and the composites before and after the reduction of GO on the MS skeleton. As shown in Fig. 3a, the MS exhibits a relatively smooth surface of the skeleton and an interconnected three-dimensional network structure with the pore size of about 100–300 μm. As shown in Fig. 3b, since the raw material GR used herein has the small mesh size of 325 and the volume fraction of rGO is at the relatively high level of 1.89 vol%, the GO layers can easily self-assemble and overlap each other to form large sheets. The MS has a moderate aperture size and can steadily support the GO sheets, obtaining a continuous GO membrane structure on the skeleton that can contribute to the further construction of an interconnected percolation network.31 Fig. 3c shows that rGO/borates are not uniformly coated on the MS skeleton, but loaded onto the MS skeleton in the forms of sheets and blocks. Based on the abovementioned analysis results and the schematic of the structure of the composite shown in Fig. 1, NaBH4 was used as a reductant to reduce the oxygen-containing functional groups on the surface of GO, and during the reduction, borates were produced and intercalated into the rGO layers or sheets.5 The borates were also deposited on the surface of rGO; thus, rGO/borate compounds were formed with a complex interface structure. When rGO and borates as conductive fillers were introduced into polymer insulators, a large number of charges accumulated at the boundary of conductors and insulators; this led to interfacial polarization because there were significant differences between the electrical conductivity of the conductors and insulators. It can be considered that many conductive particles are surrounded by very thin polymer insulator particles, which can be equivalent to many micro-capacitors, thus greatly increasing the dielectric constant of the material. Next, the rGO/borate compounds with a complex interface structure were filled into the SR insulator, and a large amount of micro-capacitors formed in the composite, causing a synergetic effect between rGO and borates that led to strong interfacial polarization; thus, a composite with ultrahigh dielectric constant was obtained.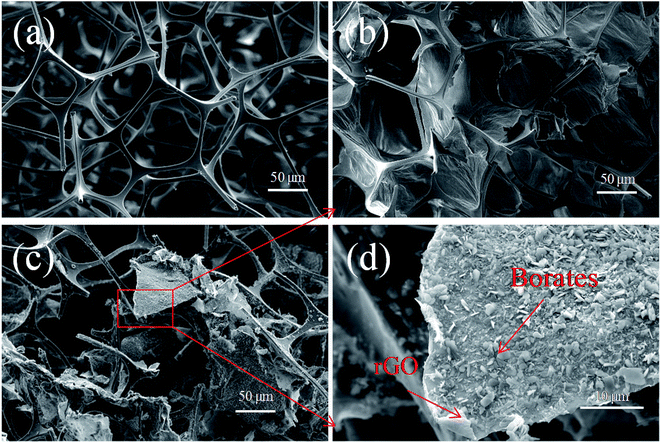 | ||
| Fig. 3 SEM images of (a) MS, (b) GO/MS and (c and d) MS–rGB prepared using the rGO volume fraction of 1.89 vol%. | ||
3.3 SEM and EDS analysis of MGS
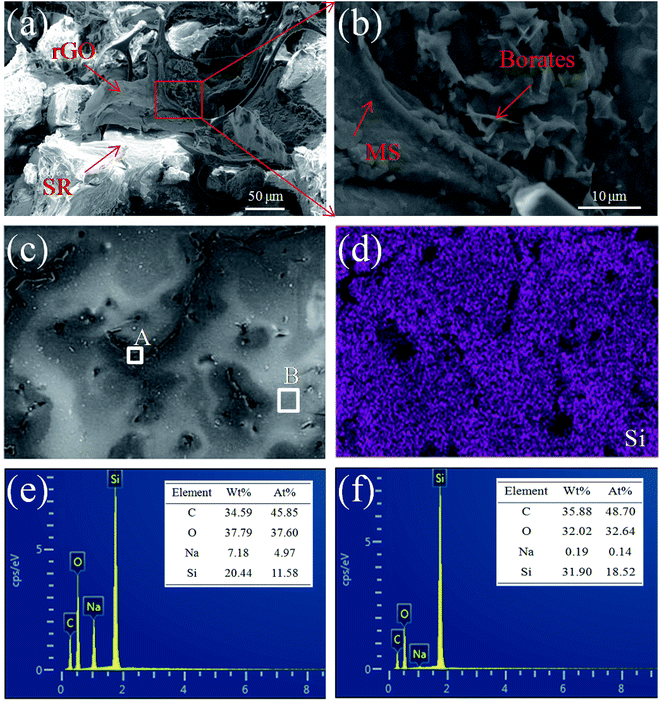
The interfacial microstructure and fracture surface morphology of MGS prepared using the rGO volume fraction of 1.89 vol% are shown in Fig. 4. The arrows in Fig. 4a and b indicate that the rGO sheets and borates are supported on the MS backbone, respectively, and embedded in the surrounding SR matrix. The SR can ensure that the three-dimensional conductive network is not easily damaged, improving the structural stability of the MS skeleton. In Fig. 4d, the distribution of the Si element from SR on the fracture surface of MGS (Fig. 4c) is clearly shown in purple color, and the black area should be the MS skeleton with rGB, which is consistent with the microstructure shown in Fig. 4a and b. In Fig. 4e and f, it can be found that the content of the Na element in the region A is significantly higher than that in the region B; this indicates that borates have been loaded onto the MS skeleton. In general, the infusion of SR did not change the microstructure of the three-dimensional conductive network constructed by the MS skeleton, rGO and borates; this helped to promote the synergistic effect between rGO and borates.3.4 Electrical conductivity of MGS
Fig. 5a shows the DC conductivity of MGS as a function of the rGO volume fraction. It can be seen that the volume resistivity of the composite decreases with an increase in the rGO volume fraction. When the volume fraction of rGO was 1.89 vol%, the volume resistivity of MGS reduced to 6.57 × 10⁴ Ω cm, which was the lowest value in the experimental range and 7 orders of magnitude lower than that of the composite without rGO. As shown in the SEM image (Fig. 3c), although rGB is not uniformly coated on the MS skeleton or even overlapping the skeleton, a conductive path can be formed in the composites, and a three-dimensional conductive network has been successfully constructed via the MS template. Moreover, the increase in the content of the conductive fillers is beneficial to the reduction of the volume resistivity of the composites, thereby improving the electrical conductivity of composites.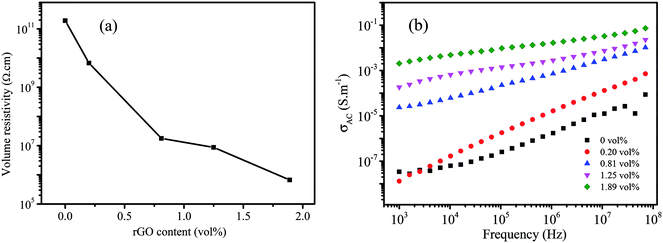 | ||
| Fig. 5 (a) DC conductivity of MGS as a function of the rGO volume fraction; (b) frequency dependence of the AC conductivity of MGS. | ||
Fig. 5b shows the AC conductivity of MGS as a function of frequency. The AC conductivity (σ(ω)) at angular frequency (ω) was calculated using the measured dielectric constant and loss at the same angular frequency as follows:32
 | (1) |
![[thin space (1/6-em)]](https://www.rsc.org/images/entities/char_2009.gif) δ(ω) is the dielectric loss and ε0 is the dielectric constant of free space. It can be seen that the AC conductivity of the composite increases with an increase in the rGO content and frequency. When the volume fraction of rGO was increased to 0.82 vol%, a rapid increase in the AC conductivity was observed at low frequencies; this implied the formation of an rGO conductive network in the composite. This is consistent with the abovementioned DC conductivity analysis results.
δ(ω) is the dielectric loss and ε0 is the dielectric constant of free space. It can be seen that the AC conductivity of the composite increases with an increase in the rGO content and frequency. When the volume fraction of rGO was increased to 0.82 vol%, a rapid increase in the AC conductivity was observed at low frequencies; this implied the formation of an rGO conductive network in the composite. This is consistent with the abovementioned DC conductivity analysis results.
3.5 Dielectric property of MGS
The dielectric property of composites is highly dependent on the nature of the filler/matrix interface, the surface area of the filler and the inherent conductivity of the filler.33 Fig. 6 shows the frequency dependence of the dielectric property of MGS at different rGO volume fractions and the control samples of the MGS at 1.89 vol% rGO. When the volume fraction of GO was 0.20 vol%, the dielectric constant of MGS showed almost no change as compared to that of the MS/SR composite; this could be attributed to low content of the rGO–borate complex and the absence of a percolation network. When the volume fraction of rGO was higher than 0.81 vol%, the dielectric constant of MGS was significantly increased by 2–4 orders of magnitude when compared with that of the pure silicone rubber; this indicated that a percolation network of the rGO–borate complex was formed. With an increase in the rGO volume fraction, the frequency dependence of the dielectric constant increased, and the dielectric constant was improved. This was due to an increase in the number of “micro-capacitors” and the increased interface between rGB and SR; this resulted in higher interfacial polarization density and dielectric constant.11 Therefore, the sample obtained using the rGO volume fraction of 0.81 vol% at the frequency of 1 kHz had the ultrahigh dielectric constant of up to 2.71 × 10⁴, which was four orders of magnitude higher than that of the MS/SR composite.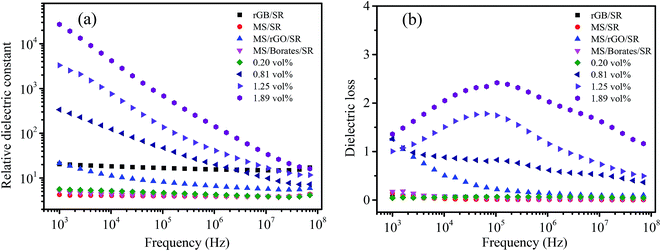 | ||
| Fig. 6 Dielectric constant (a) and dielectric loss (b) of MGS at different rGO volume fractions and the control samples of the MGS prepared using the rGO volume fraction of 1.89 vol%. | ||
In particular, note that both MS/rGO/SR and MS/borate/SR have significantly lower dielectric constants than the MGS composite; this shows that a synergistic effect exists between rGO and borates with an increase in dielectric constants. However, the dielectric constant of the rGB/SR composite without MS is still very low; this means that MS plays a key role in the achievement of ultrahigh dielectric constants. As shown in the SEM images, the ultrahigh dielectric constant of the MGS composite should be attributed to the unique three-dimensional percolation network constructed in the composite based on the MS template. The relationship between the dielectric constant of the sample and the volume fraction of rGO is consistent with that between volume resistivity and rGO volume fraction. Moreover, the dielectric constant of MGS shows a strong dependence on frequency, decreasing with an increase in frequency. This is closely related to the interfacial polarization relaxation of charge accumulating at the interface between the conductive fillers and the matrix SR.5,10,34
As is known, the dielectric loss of the composites occurs due to two reasons: (1) the interfacial polarization relaxation loss of the conductive fillers in the composites and (2) a leakage loss caused by the conductive network in the composites. Fig. 6b shows the effect of the rGO volume fraction on the dielectric loss of MGS. When the rGO volume fraction was 0 and 0.20 vol%, the dielectric loss was low because the percolation network and the conductive path were not formed in the composite. When the rGO volume fraction was further increased, the rGO–borate conductive network was gradually formed but was not perfect, and the interface polarization relaxation loss and leakage loss increased accordingly. The dielectric loss at low frequencies is mainly caused by the DC leakage of the composite material, and the lower the external field frequency, the more obvious the influence.31 Therefore, when the rGO volume fraction exceeded 0.81 vol%, the dielectric loss increased significantly as compared to that of the pure silicone rubber and the composite obtained using the rGO volume fraction of 0.20 vol%. When the rGO volume fraction was 1.25 vol% or 1.89 vol%, the dielectric loss exhibited a strong frequency dependence and a peak at around 105 MHz. The dielectric loss peak can be attributed to the leakage current loss due to the formation of a conductive network in the composite. With an increase in the volume fraction of rGO, the conductive network becomes more perfect. As a result, the dielectric loss peak gradually shifts to high frequency; this is similar to the results reported in the literature.32,35
Fig. 7 shows the effect of different rGO volume fractions on the dielectric properties of MGS at 1 kHz and at room temperature. The relationship between the dielectric constant and the volume fraction of rGO presents a typical percolation phenomenon. According to the percolation theory36 eqn (2), by plotting the log–log curves of the volume fraction of rGO and the dielectric constant (as shown in the inset in Fig. 7) and the linear fitting of the experimental data, it can be concluded that the percolation threshold of the composite is 0.815 vol%.
| ε(frGO) ∝ (fc − frGO)−s, frGO < fc | (2) |
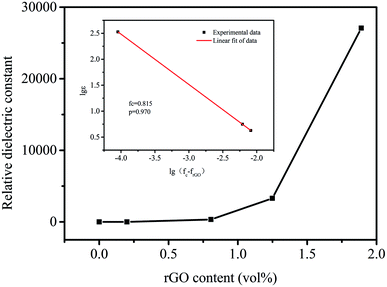 | ||
| Fig. 7 Dielectric constant of MGS as a function of the volume fraction of different rGO at 1 kHz; inset shows the logarithmic fit of the experimental data by eqn (2). | ||
Compared with that reported in the related literature,37–40 the percolation threshold of the composite is at relatively low level. This was due to the fact that rGO and borates were co-loaded onto the MS skeleton; this was helpful for formation of a three-dimensional percolation network in the composite and could effectively reduce the percolation threshold of the composite. In this study, the dielectric constant of MGS at the rGO volume fraction of 1.89 vol% was highest at 1 kHz, and the dielectric loss was 1.36. This ultrahigh dielectric constant in rGO-based polymer composites has been seldom reported in the current literature.37–49
Table 1 presents a comparison between the dielectric properties of different composites with graphene as the conductive filler and different polymers as the matrix reported in the literature in recent years; as can be seen from the table, the dielectric constants of most of the reported composites are less than 2000, a few of them are between 2000 and 10![[thin space (1/6-em)]](https://www.rsc.org/images/entities/char_2009.gif) 000, and scarcely any of them are more than 10
000, and scarcely any of them are more than 10![[thin space (1/6-em)]](https://www.rsc.org/images/entities/char_2009.gif) 000. A high dielectric constant generally corresponds to a high dielectric loss, and a low dielectric loss corresponds to a low dielectric constant. Outstanding dielectric materials are usually expected to have high ratio of dielectric constant to dielectric loss. However, some composites presented in Table 1 even have low dielectric constant but high dielectric loss with a relatively low ratio of the dielectric constant to the dielectric loss (<100). In contrast, the MS/rGB/SR composites prepared using the MS template in this study exhibit excellent dielectric properties with an ultra-high dielectric constant (27
000. A high dielectric constant generally corresponds to a high dielectric loss, and a low dielectric loss corresponds to a low dielectric constant. Outstanding dielectric materials are usually expected to have high ratio of dielectric constant to dielectric loss. However, some composites presented in Table 1 even have low dielectric constant but high dielectric loss with a relatively low ratio of the dielectric constant to the dielectric loss (<100). In contrast, the MS/rGB/SR composites prepared using the MS template in this study exhibit excellent dielectric properties with an ultra-high dielectric constant (27![[thin space (1/6-em)]](https://www.rsc.org/images/entities/char_2009.gif) 100) and a relatively low dielectric loss (1.36), and the ratio of the dielectric constant to the dielectric loss (19
100) and a relatively low dielectric loss (1.36), and the ratio of the dielectric constant to the dielectric loss (19![[thin space (1/6-em)]](https://www.rsc.org/images/entities/char_2009.gif) 926) is extremely higher than the values reported in the literature. In addition, the percolation threshold of 0.815% is at relatively low level; this is an advantage of the composite. These features are mainly attributed to the characteristic three-dimensional percolation network constructed in the composite and the synergetic effect between rGO and borates.
926) is extremely higher than the values reported in the literature. In addition, the percolation threshold of 0.815% is at relatively low level; this is an advantage of the composite. These features are mainly attributed to the characteristic three-dimensional percolation network constructed in the composite and the synergetic effect between rGO and borates.
| Filler | Filler content | Polymer matrix | Dielectric constant (εr) | Dielectric loss (tan![[thin space (1/6-em)]](https://www.rsc.org/images/entities/char_2009.gif) δ) δ) |
Percolation threshold | εr/tan![[thin space (1/6-em)]](https://www.rsc.org/images/entities/char_2009.gif) δ δ |
Ref. |
|---|---|---|---|---|---|---|---|
| a GNPs: graphene nanosheets; XNBR: carboxylated nitrile butadiene rubber; PI: polyimide; PVDF: polyvinylidene fluoride; PS: polystyrene; CEC: cyanoethyl cellulose; PP: polypropylene; MGM: MnO2/GNPs/MnO2; P(VDF-TrFE-CFE): poly(vinylidene fluoride-trifluoroethylene-chlorofluoroethylene). | |||||||
| GNPs | 0.23 vol% | XNBR | ∼10 | ∼0.5 | — | 20 | 41 |
| rGO | 5.16 wt% | PI | ∼16 | ∼0.6 | 0.212 wt% | 26.67 | 42 |
| GNPs | 0.65 vol% | PVDF | 30 | 1.35 | 0.67 vol% | 22.22 | 43 |
| GNPs | 9 vol% | PS | ∼36 | ∼60 | 9.41 vol% | 0.60 | 37 |
| rGO | 0.3 wt% | PVDF | 69 | 1.33 | 0.5 wt% | 51.88 | 44 |
| GNPs | 2.5 wt% | PVDF | 173 | 0.65 | 2.4 wt% | 266.2 | 45 |
| rGO | 1.49 vol% | PVDF | 200 | 2.5 | 1.49 vol% | 80 | 38 |
| rGO | 9.7 wt% | CEC | 472 | 4.1 | — | 115.1 | 46 |
| rGO | 0.5 vol% | PVDF | 1754 | 5 | — | 350.8 | 47 |
| rGO | 0.2 vol% | PP | ∼2000 | ∼12 | 0.033 vol% | 166.7 | 48 |
| MGM | 16.02 vol% | PVDF | 2360 | 2 | 15.83 vol% | 1180 | 39 |
| GNPs | 3.19 vol% | PVDF | 4500 | 2.83 | 3.1 vol% | 1590 | 40 |
| rGO | 1.7 vol% | P(VDF-TrFE-CFE) | ∼10![[thin space (1/6-em)]](https://www.rsc.org/images/entities/char_2009.gif) 000 000 |
∼2 | 0.7–1.7 vol% | 5000 | 49 |
| rGO | 1.89 vol% | SR | 27![[thin space (1/6-em)]](https://www.rsc.org/images/entities/char_2009.gif) 100 100 |
1.36 | 0.815% | 19![[thin space (1/6-em)]](https://www.rsc.org/images/entities/char_2009.gif) 926 926 |
This work |
3.6 Piezoresistivity of MGS
Fig. 8 shows the influence of compressive strain on the volume resistivity of the composites prepared using different rGO volume fractions. It can be seen that the volume resistivity of the composites is not sensitive to compressive strain when the rGO volume fractions are 0, 0.20 vol%, and 1.89 vol%; this is related to the degree of perfection of the conductive network. When the rGO content in the composite is relatively low (0 and 0.20 vol%), the conductive network is not yet formed; thus, it is difficult to achieve the interconnection of the conductive fillers even at large compressive strains. However, when the rGO volume fraction is at the high level of 1.89 vol%, the conductive network has high degree of perfection; thus, the compression strain has a little effect on the volume resistivity. In contrast, the volume resistivity of the composites at 0.81 vol% and 1.25 vol% is significantly sensitive to compressive strain. The volume resistivity tends to decrease first and then increases with an increase in compressive strain.50 This is due to the fact that the distance between conductive fillers decreases to assist in the formation of a conductive network at low compressive strains, and then, the volume resistivity of the composite is reduced.51 However, upon further increasing the compressive strain, the three-dimensional conductive network causes a certain degree of damage such that the volume resistivity increases accordingly. The volume resistivity at 1.25 vol% has higher sensitivity to compressive strain as compared to that at the rGO volume fraction of 0.81 vol%, and the corresponding fractional resistance change (ΔR/R0) at the compressive strain of 20% is −0.877, which is obviously superior to those reported in the literature.51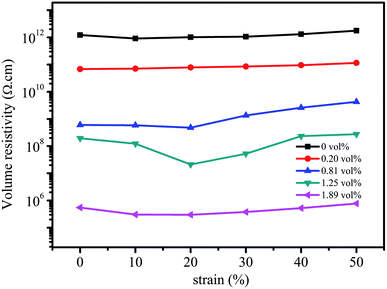 | ||
| Fig. 8 Volume resistivity of the composites at different rGO volume fractions as a function of compressive strain. | ||
4 Conclusions
In this study, the rGO and borates complexes obtained via the chemical reduction of GO by NaBH4 were loaded onto the three-dimensional skeleton of MS as functional fillers. A novel SR-based composite with an ultrahigh dielectric constant (2.71 × 10⁴) was achieved after the infusion of SR into the three-dimensional skeleton. This was mainly attributed to the successful construction of a three-dimensional percolation network structure of rGO–borates in the composites based on MS as a template and the efficient synergistic effect between rGO and borates. This unique structure design and simple operation method provide new ideas for the preparation of polymer-based composites with ultrahigh dielectric constants that have potential applications in the fields of supercapacitors, flexible wearable devices and deformation sensors.Conflicts of interest
There are no conflicts to declare.Acknowledgements
The authors are grateful to the National Natural Science Foundation of China (51763006 and 51363003), the Guangxi Natural Science Foundation (2016JJA160040), and the Guangxi Science and Technology Major Project (AA18242010-2) for providing financial support to this work.References
- M. Wang, X. Duan, Y. Xu and X. Duan, ACS Nano, 2016, 10, 7231–7247 CrossRef CAS PubMed.
- D. He, Y. Wang, S. Song, S. Liu, Y. Luo and Y. Deng, Compos. Sci. Technol., 2017, 151, 25–33 CrossRef CAS.
- Z. Cai, X. Wang, B. Luo, W. Hong, L. Wu and L. Li, Compos. Sci. Technol., 2017, 145, 105–113 CrossRef CAS.
- J. Varghese, S. Jasimudeen and K. T. Varghese, RSC Adv., 2015, 5, 107142–107149 RSC.
- H. Luo, Z. Wu, X. Zhou, Z. Yan, K. Zhou and D. Zhang, Compos. Sci. Technol., 2018, 160, 237–244 CrossRef CAS.
- Prateek, V. K. Thakur and R. K. Gupta, Chem. Rev., 2016, 116, 4260–4317 CrossRef CAS PubMed.
- S. Dalle Vacche, F. Oliveira, Y. Leterrier, V. Michaud, D. Damjanovic and J.-A. E. Manson, J. Mater. Sci., 2014, 49, 4552–4564 CrossRef CAS.
- V. S. Nisa, S. Rajesh, K. P. Murali, V. Priyadarsini, S. N. Potty and R. Ratheesh, Compos. Sci. Technol., 2008, 68, 106–112 CrossRef CAS.
- Y. Hu, Y. Zhang, H. Liu and D. Zhou, Ceram. Int., 2011, 37, 1609–1613 CrossRef CAS.
- Z.-M. Dang, J.-K. Yuan, J.-W. Zha, T. Zhou, S.-T. Li and G.-H. Hu, Prog. Mater. Sci., 2012, 57, 660–723 CrossRef CAS.
- M. Hamidinejad, B. Zhao, R. K. M. Chu, N. Moghimian, H. E. Naguib, T. Filleter and C. B. Park, ACS Appl. Mater. Interfaces, 2018, 10, 19987–19998 CrossRef CAS PubMed.
- Y. Jin, N. Xia and R. A. Gerhardt, Nano Energy, 2016, 30, 407–416 CrossRef CAS.
- A. Ameli, S. Wang, Y. Kazemi, C. B. Park and P. Poetschke, Nano Energy, 2015, 15, 54–65 CrossRef CAS.
- S. Nag-Chowdhury, H. Bellegou, I. Pillin, M. Castro, P. Longrais and J. F. Feller, Compos. Sci. Technol., 2016, 123, 286–294 CrossRef CAS.
- P. Slobodian, P. Riha and P. Saha, Carbon, 2012, 50, 3446–3453 CrossRef CAS.
- S. S. Chauhan, M. Abraham and V. Choudhary, RSC Adv., 2016, 6, 113781–113790 RSC.
- V. Torrisi and F. Ruffino, Coatings, 2015, 5, 378–424 CrossRef CAS.
- J. Gao, M. Hu, Y. Dong and R. K. Li, ACS Appl. Mater. Interfaces, 2013, 5, 7758–7764 CrossRef CAS PubMed.
- B. C. Ozkan, T. Soganci, H. Turhan and M. Ak, Electrochim. Acta, 2019, 295, 1044–1051 CrossRef CAS.
- L. Zhao, H. H. Wu, C. Yang, Q. Zhang, G. Zhong, Z. Zheng, H. Chen, J. Wang, K. He, B. Wang, T. Zhu, X. C. Zeng, M. Liu and M. S. Wang, ACS Nano, 2018, 12, 12597–12611 CrossRef CAS PubMed.
- Y. Li, X. Huang, L. Zeng, R. Li, H. Tian, X. Fu, Y. Wang and W.-H. Zhong, J. Mater. Sci., 2019, 54, 1036–1076 CrossRef CAS.
- K. Shehzad, A. Ul-Haq, S. Ahmad, M. Mumtaz, T. Hussain, A. Mujahid, A. T. Shah, M. Y. Choudhry, I. Khokhar, S. Ul-Hassan, F. Nawaz, F. u. Rahman, Y. Butt and M. Pervaiz, J. Mater. Sci., 2013, 48, 3737–3744 CrossRef CAS.
- J. Zhou, H. Li, W. Liu, R. Dugnani, R. Tian, W. Xue, Y. Chen, Y. Guo, H. Duan and H. Liu, Composites, Part A, 2016, 91, 292–300 CrossRef CAS.
- J. Yang, Y. Ye, X. Li, X. Lu and R. Chen, Compos. Sci. Technol., 2018, 164, 187–194 CrossRef CAS.
- M. Moussa, M. F. El-Kady, H. Wang, A. Michimore, Q. Zhou, J. Xu, P. Majeswki and J. Ma, Nanotechnology, 2015, 26, 075702 CrossRef PubMed.
- K. Krishnamoorthy, M. Veerapandian, K. Yun and S. J. Kim, Carbon, 2013, 53, 38–49 CrossRef CAS.
- Y. Wei, X. Hu, Q. Jiang, Z. Sun, P. Wang, Y. Qiu and W. Liu, Compos. Sci. Technol., 2018, 161, 74–84 CrossRef CAS.
- A. E. Ferreira Oliveira, G. B. Braga, C. R. Teixeira Tarley and A. C. Pereira, J. Mater. Sci., 2018, 53, 12005–12015 CrossRef.
- C. Hao, B. Wang, F. Wen, C. Mu, J. Xiang, L. Li and Z. Liu, Nanotechnology, 2018, 29, 235604 CrossRef PubMed.
- O. Y. Gumus, H. I. Unal, O. Erol and B. Sari, Polym. Compos., 2011, 32, 418–426 CrossRef CAS.
- C. Zhang, Z.-L. Hou, B.-X. Zhang, H.-M. Fang and S. Bi, Carbon, 2018, 137, 467–474 CrossRef CAS.
- L. Zhang, Z. Liu, X. Lu, G. Yang, X. Zhang and Z. Y. Cheng, Nano Energy, 2016, 26, 550–557 CrossRef CAS.
- N. Yousefi, X. Sun, X. Lin, X. Shen, J. Jia, B. Zhang, B. Tang, M. Chan and J.-K. Kim, Adv. Mater., 2014, 26, 5480–5487 CrossRef CAS PubMed.
- S.-Q. Wu, J.-W. Wang, J. Shao, L. Wei, R.-K. Ge and H. Ren, Mater. Des., 2018, 146, 208–218 CrossRef CAS.
- C.-C. Wang, J.-F. Song, H.-M. Bao, Q.-D. Shen and C.-Z. Yang, Adv. Funct. Mater., 2008, 18, 1299–1306 CrossRef CAS.
- W. Zhou, Y. Gong, L. Tu, L. Xu, W. Zhao, J. Cai, Y. Zhang and A. Zhou, J. Alloys Compd., 2017, 693, 1–8 CrossRef CAS.
- B. Fan, Y. Liu, D. He and J. Bai, Materials, 2017, 10, 838 CrossRef PubMed.
- D. Wang, T. Zhou, J.-W. Zha, J. Zhao, C.-Y. Shi and Z.-M. Dang, J. Mater. Chem. A, 2013, 1, 6162–6168 RSC.
- J. Sun, Q. Xue, Q. Guo, Y. Tao and W. Xing, Composites, Part A, 2014, 67, 252–258 CrossRef CAS.
- L. Chu, Q. Xue, J. Sun, F. Xia, W. Xing, D. Xia and M. Dong, Compos. Sci. Technol., 2013, 86, 70–75 CrossRef CAS.
- D. Yang, X. Kong, Y. Ni, M. Ruan, S. Huang, P. Shao, W. Guo and L. Zhang, Polymers, 2019, 11, 218 CrossRef PubMed.
- H. Feng, X. Fang, X. Liu, Q. Pei, Z.-K. Cui, S. Deng, J. Gu and Q. Zhuang, Composites, Part A, 2018, 109, 578–584 CrossRef CAS.
- P. Xu, H. Gui, X. Wang, Y. Hu and Y. Ding, Compos. Sci. Technol., 2015, 117, 282–288 CrossRef CAS.
- M. Ataur Rahman and G.-S. Chung, J. Alloys Compd., 2013, 581, 724–730 CrossRef CAS.
- Y. C. Li, S. C. Tjong and R. K. Y. Li, Synth. Met., 2010, 160, 1912–1919 CrossRef CAS.
- F. Wang, M. Wang and Z. Shao, Cellulose, 2018, 25, 7143–7152 CrossRef CAS.
- L. Zhang, R. Xi, S.-H. Zhang, C. Wang, H.-D. Wu, L.-Y. Shi and G.-B. Pan, Mater. Lett., 2019, 242, 1–4 CrossRef CAS.
- D. Wang, X. Zhang, J.-W. Zha, J. Zhao, Z.-M. Dang and G.-H. Hu, Polymer, 2013, 54, 1916–1922 CrossRef CAS.
- M. N. Almadhoun, M. N. Hedhili, I. N. Odeh, P. Xavier, U. S. Bhansali and H. N. Alshareef, Chem. Mater., 2014, 26, 2856–2861 CrossRef CAS.
- F. Qiang, L.-L. Hu, L.-X. Gong, L. Zhao, S.-N. Li and L.-C. Tang, Chem. Eng. J., 2018, 334, 2154–2166 CrossRef CAS.
- C. S. Boland, U. Khan, M. Binions, S. Barwich, J. B. Boland, D. Weaire and J. N. Coleman, Nanoscale, 2018, 10, 5366–5375 RSC.
| This journal is © The Royal Society of Chemistry 2019 |

