DOI:
10.1039/C9RA00766K
(Paper)
RSC Adv., 2019,
9, 13808-13813
Critical behavior near room temperature in La0.75Ca0.05Na0.20MnO3 sample
Received
28th January 2019
, Accepted 7th April 2019
First published on 3rd May 2019
Abstract
The critical behavior of La0.75Ca0.05Na0.20MnO3 was studied at around room temperature via magnetization measurements. From the relative slope, we deduced that the Tricritical Mean-Field model was the most suitable model. The estimated critical exponents were found to be β = 0.24 ± 0.004, γ = 0.98 ± 0.065 and δ = 5.08 at TC = 300 K. These critical exponents satisfied the Widom scaling relation δ = 1 + γ/β, implying the reliability of our values. Based on the critical exponents, the magnetization–field–temperature (M–μ0H–T) data around TC collapsed into two curves, obeying the single scaling equation  with ε = (T − TC)/TC being the reduced temperature. These results suggest short-range interaction in our sample.
1. Introduction
Over the past few years, the colossal magnetoresistance (CMR) effect in doped manganites has attracted the attention of many researchers owing to their promising physical properties and potential applications around the Curie temperature TC, such as memory recording, field sensors and magnetic reading heads.1–3 In general, the perovskite structure shows a distortion from the ideal structure (cubic) to a rhombohedral or orthorhombic structure, which is mainly caused by the Jahn–Teller (JT) effect following the deformation of the MnO6 octahedron. Particularly, the low-doped La1−xSrxMnO3 and La1−xCaxMnO3 samples have extraordinary electronic and magnetic properties and are good candidates for technological applications.4,5 These materials are characterized by an insulator (I)–metal (M) transition and paramagnetic (PM)–ferromagnetic (FM) transition, which leads to the CMR effect. These properties have been explained by the double-exchange (DE) interaction,6 phase separation7 and JT effects, which represent the strong electron–phonon interaction.8 Recently, many studies have investigated the critical behaviors of manganites around the Curie temperature (TC) to understand their transition nature (first or second order) and the universality class. Historically, the transition from PM-I to the FM-M state has been elucidated by the Zener DE theory.6 The analysis of the critical behaviors around the TC is a powerful tool to understand the interaction mechanism responsible for the transition. Therefore, it is important to study in detail the critical exponents in the PM–FM region. Initially, critical phenomena in the DE model were associated with the long-range Mean-Field theory.9 Subsequently, Motome and Furulawa proposed that the critical behavior could be associated to the short-range Heisenberg universality class.10 Several experimental studies on critical phenomena are still controversial concerning their Mean-Field values,11 short-range Heisenberg interaction,12 3-D Ising values,13 and others models which are not classified into any universality class ever known.14 In general, the critical exponent β varied from 0.3 to 0.5, while the reported values for exponent γ varied from 1 to 1.4. Currently, there are four models that can be defined and used to explain the critical properties in magnetic compounds. These models are the 3D-Heisenberg (β = 0.365), Mean-Field (β = 0.5), Tricritical Mean Field (β = 0.25) and 3D-Ising (β = 0.325) models. It is noteworthy that the critical phenomenon in the PM–FM region raised important fundamental discussions. Previously,15 we studied the magnetic and magnetocaloric properties of La0.75Ca0.05Na0.20MnO3 samples. We noticed that our sample displays a FM–PM transition around room temperature. According to the magnetocaloric study, a large magnetic entropy change was observed, with a maximum of 6.01 J kg−1 K−1. In addition, it has an important relative cooling ability, which was found to be 225 J kg−1.15 These results indicate that the material can be a good potential candidate in the refrigeration domain.
In this study, we present the first detailed dc magnetization study of the critical phenomena in a DE FM, La0.75Ca0.05Na0.20MnO3. We determined the TC and the critical exponents γ, β and δ and tested them for scaling.
2. Experimental details
The La0.75Ca0.05Na0.20MnO3 polycrystalline sample was prepared by the flux method, using NaCl as a flux.15 The crystal structure of the studied powder was checked by X-ray diffraction, which confirmed that the sample crystallized in the rhombohedral structure with the R![[3 with combining macron]](https://www.rsc.org/images/entities/char_0033_0304.gif) c space group and had a detectable secondary phase of Mn3O4.15 The relative amount of Mn3O4 as determined from the XRD patterns of the sample was found to be 10%. To extract the critical exponent of the samples accurately, the magnetic isotherm for the sample was measured in the range of 0–5 T, in the vicinity of the PM to FM phase transition. The isothermals were corrected by a demagnetization factor D that was determined by a standard procedure from the low-field dc magnetization measurement at low temperatures (H = Happ − DM).
c space group and had a detectable secondary phase of Mn3O4.15 The relative amount of Mn3O4 as determined from the XRD patterns of the sample was found to be 10%. To extract the critical exponent of the samples accurately, the magnetic isotherm for the sample was measured in the range of 0–5 T, in the vicinity of the PM to FM phase transition. The isothermals were corrected by a demagnetization factor D that was determined by a standard procedure from the low-field dc magnetization measurement at low temperatures (H = Happ − DM).
3. Results and discussion
In our earlier work,15 we showed that for La0.75Ca0.05Na0.20MnO3, the field-cooled (FC) magnetization versus temperature under an applied magnetic field of 0.05 T demonstrated a magnetic transition from the PM to FM state at its TC, with the decrease in temperature; the TC value was found to be 300 K. To introduce the FM state in manganite oxide type perovskite, the existence of the Mn3+–Mn4+ mixed valence is necessary. Ferromagnetism is caused by the exchange energy; this favors electrons with parallel spins. A deeper insight into the magnetic phase transition may be obtained by analyzing the critical phenomena. Based on Banerjee's criterion, a positive slope reflects a second order magnetic transition, while a negative one reflects a first order magnetic transition. From Fig. 1, we obtained a positive slope for our sample. This indicates that La0.75Ca0.05Na0.20MnO3 undergoes a second order PM–FM transition. It is well known that a magnetic system showing a second order PM–FM transition, around TC, can be described by a set of interrelated critical exponents.
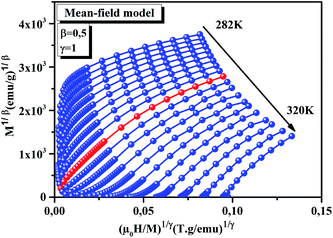 |
| | Fig. 1 A set of typical M2 vs. μ0H/M plots, for the La0.75Ca0.05Na0.20MnO3 sample. | |
According to the scaling hypothesis, for a second-order phase transition around TC, the critical exponents β (associated with the spontaneous magnetization  just below TC), γ (relevant to the initial magnetic susceptibility χ0,
  just above TC), and δ (associated with the critical isotherm M(TC, μ0H) at TC) are given as:16
| | |
MS(T) = M0(−ε)β, ε < 0, T < TC
| (1) |
| |
 | (2) |
| |
 | (3) |
where
β is associated with the spontaneous magnetization
MS,
γ is associated with the initial magnetic susceptibility
χ0,
δ is associated with the critical magnetization isotherm at
TC,
ε = (
T −
TC)/
TC is the reduced temperature,
μ0H is the demagnetization adjusted magnetic field and
M0,
h0/
M0, and
D the critical amplitudes. According to the critical region theory, the reduced magnetic equation of state can be expressed as
| |
 | (4) |
where
f![[thin space (1/6-em)]](https://www.rsc.org/images/entities/char_2009.gif) ±
± are the regular analytical functions with
f+ for
T >
TC, and
f− for
T <
TC.
17,18
Eqn (4) implies that M/|ε|−β as a function μ0H/|ε|−(β+γ), falls on two universal curves, one for T > TC, and the other for T < TC. In general, four models can be defined according to the values of the critical exponents; 3D-Heisenberg model (β = 0.365 and γ = 1.336), Mean-Field model (β = 0.5 and γ = 1), Tricritical Mean-Field model (β = 0.25 and γ = 1) and the 3D-Ising model (β = 0.325 and γ = 1.24). The different models are collected in Table 1.
Table 1 Comparison of critical exponents of the La0.75Ca0.05Na0.20MnO3 sample with various theoretical models and earlier results on manganites
| Samples |
Technique |
TC (K) |
β |
γ |
δ |
Ref. |
| La0.75Ca0.05Na0.20MnO3 |
MAP |
299.48 ± 0.12K |
0.24 ± 0.004 |
0.98 ± 0.065 |
5.08 |
This work |
| |
KF |
299.04 ± 0.03 |
0.22 ± 0.006 |
1.034 ± 0.063 |
5.70 |
This work |
| |
CI (exp) |
300 |
— |
— |
4.86 ± 0.004 |
This work |
| Mean Field model |
Theory |
— |
0.5 |
1 |
3 |
18 |
| 3D-Heisenberg model |
Theory |
— |
0.365 |
1.336 |
4.8 |
18 |
| 3D Ising model |
Theory |
— |
0.325 |
1.24 |
4.82 |
18 |
| Tricritical Mean Field model |
Theory |
— |
0.25 |
1 |
5 |
19 |
| La0.1Nd0.6Sr0.3MnO3 |
|
249.36 ± 0.04 |
0.248 ± 0.006 |
1.066 ± 0.002 |
5.298 |
25 |
| Nd0.7Sr0.3MnO3 |
|
238 |
0.271 ± 0.006 |
0.922 ± 0.016 |
4.5 |
26 |
| La0.7Ba0.3MnO3 |
|
311.2 |
0.54 ± 0.02 |
1.04 ± 0.04 |
3.08 ± 0.04 |
27 |
| La0.7Ca0.3Mn0.91Ni0.09O3 |
|
199.5 ± 0.1 |
0.171 ± 0.006 |
0.976 ± 0.012 |
6.7 |
28 |
| La0.67Pb0.33Mn0.97Co0.03O3 |
|
345 |
0.233 ± 0.002 |
1.06 ± 0.06 |
5.52 ± 0.04 |
29 |
| La0.6Ca0.4MnO3 |
|
265.5 |
0.25 |
1.03 |
5 |
30 |
| La0.7Sr0.3MnO3 |
|
354 |
0.37 ± 0.04 |
1.22 ± 0.03 |
4.25 ± 0.2 |
2 |
The Modified Arrott Plot (MAP) is a conventional method to estimate the critical exponents and critical temperature.20 According to this method, isotherms plotted in the form of M2 as function of μ0H/M constitute a set of parallel straight lines around TC. The line at T = TC should pass through the origin. It is worth mentioning that the Arrott plot assumes the critical exponents following the Mean-Field theory. In the present case, the curves in the Arrott plot are non-linear and concave as shown in Fig. 1. For this reason, we tried to analyze our data according to the MAP method, based on the Arrott–Noakes equation. This method is based on the equation of state:21
| |
 | (5) |
where
a and
b are constants.
Fig. 2 displays MAP at different temperatures for our sample using three models of critical exponents: Fig. 2(a) 3D-Heisenberg model, Fig. 2(b) Tricritical Mean-Field model, and Fig. 2(c) 3D-Ising model. One can see that all models yield quasi straight lines. Here, it is difficult to define which model is the most appropriate for determining the critical exponents. To distinguish which model better describes this system, we calculated the relative slope (RS) defined at the critical point: RS = S(T)/S(TC). The S(T) and S(TC) are the slope for a given T close to TC and the slope at T = TC, respectively. The most appropriate model should be close to 1 (unity).22 The RS as function of the temperature curve for all models is shown in Fig. 3. From this figure, it can be seen that the Tricritical Mean-Field model is the best to describe our system.
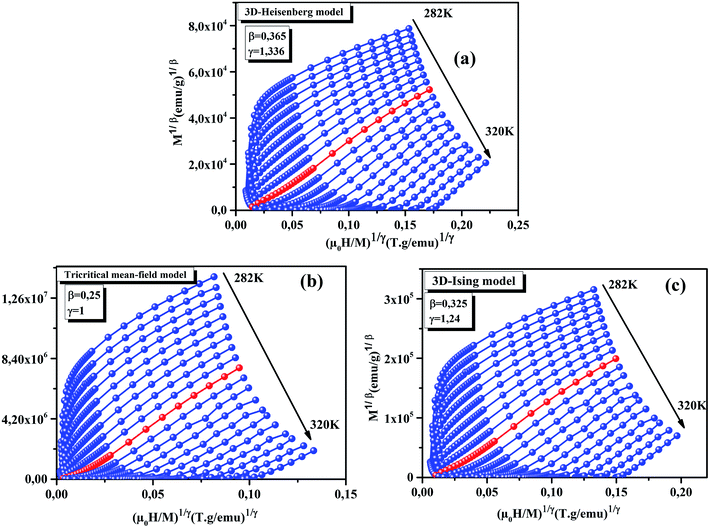 |
| | Fig. 2 Modified Arrott plots: (M1/β vs. μ0H/M) for the La0.75Ca0.05Na0.20MnO3 sample. | |
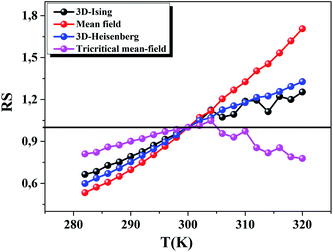 |
| | Fig. 3 RS versus temperature for the La0.75Ca0.05Na0.20MnO3 sample. | |
The high field straight line portions of the isotherms in Fig. 2(b) can be linearly extrapolated to obtain the spontaneous magnetization MS(T, 0) and the inverse susceptibility (χ0−1(T)). The temperature dependence of MS(T, 0) and χ0−1(T) for our sample are shown in Fig. 4. The continuous curves in Fig. 4 denote the power law fitting of MS(T, 0) and χ0−1(T) as a function of temperature according to eqn (1) and (2), respectively. This gives the values of β = 0.24 ± 0.004 with TC = 299.48 ± 0.12 K and γ = 0.98 ± 0.065, with TC = 299 ± 0.66 K. Moreover, β, γ and TC can be also determined from the Kouvel–Fisher (KF) method23 based on the following expressions:
| |
 | (6) |
| |
 | (7) |
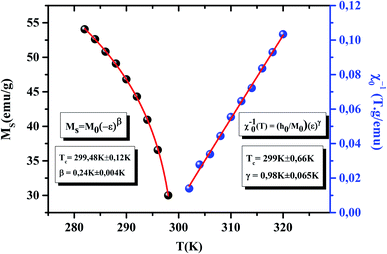 |
| | Fig. 4 MS (left) and χ0−1 (right) as function of temperature for the La0.75Ca0.05Na0.20MnO3 sample (solid lines are fits to the model). | |
According to eqn (6) and (7), we plotted MS(T)[dMS(T)/dT]−1 and χ0−1(T)[dχ0−1(T)/dT]−1 from the obtained MS(T) and χ0−1(T) curves, which should yield straight lines with slopes 1/β and 1/γ respectively. The TC values are obtained from the intercepts on the T axis. The KF curve for our sample is shown in Fig. 5. Besides, the parameters obtained from the linear fitting are found to be β = 0.220 ± 0.006 with TC = 299.04 ± 0.03 K and γ = 1.034 ± 0.063 with TC = 298.53 ± 0.06 K for our sample. Obviously, the values of the critical exponents and TC obtained using the KF method are in agreement with those obtained using the MAP of the Tricritical model. The value of δ can be determined from the linear fitting of the critical isotherm M(TC, μ0H). Fig. 6 displays M(μ0H) curve at 300 K, chosen as the critical isotherm based on the previous discussion. The inset (a) of Fig. 6 shows the same curve M vs. μ0H on the ln–ln scale. The solid straight line with a slope 1/δ is the fitting result using eqn (3). From the linear fit, we obtained the third critical exponent δ, which is found to be 4.86 ± 0.004. According to the statistical theory, these three critical exponents must fulfill the Widom scaling relation:24
| |
δ = 1 + ![[thin space (1/6-em)]](https://www.rsc.org/images/entities/char_2009.gif) γ/β γ/β
| (8) |
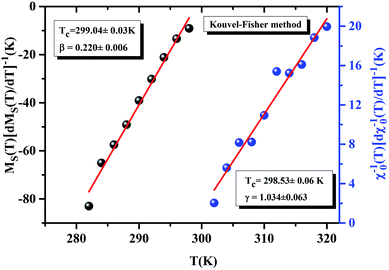 |
| | Fig. 5 K–F plots for the La0.75Ca0.05Na0.20MnO3 sample (solid lines are fits to the model). | |
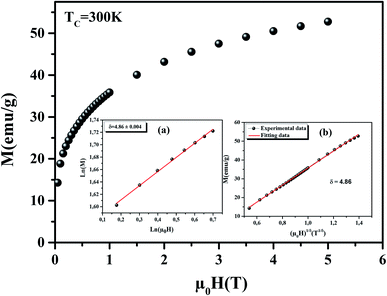 |
| | Fig. 6 M vs. μ0H plot for the La0.75Ca0.05Na0.20MnO3 sample at TC = 300 K. The inset (a) displays the same plot in ln–ln scale and the inset (b) shows M(TC) as function of μ0H1/δ. | |
Using this scaling relation and the estimated values of β and γ, we found that δ value is close to the value directly determined from the critical isotherm at TC, implying that the obtained β and γ values are consistent. All the obtained critical exponents determined from the various methods are listed in Table 1 and compared with other works.2,25–30
Furthermore, the relationship between critical exponents can also be verified by plotting M(TC) as a function of μ0H1/δ (inset (b) of Fig. 6). The plot shows a linear curve, which proves that the different critical exponents and TC obey the Widom scaling relation, and that the determined β and γ values are reliable. In order to make sure of the reliability of the determined critical exponent values and check our data in the critical region, we plotted M|ε|β as a function of μ0H|ε|(β+γ) in the low and high field region. The plots are shown in Fig. 7, using the critical exponents obtained via the KF method. From this figure, we observe that all the points fall into two curves, one below TC and another one above TC. This suggests that the values of the exponents and that of the TC are reasonably accurate. The inset of Fig. 7 displays the same plot on a log–log scale. One can see the same behavior is observed in Fig. 7. This confirms that our obtained critical exponents and TC are in agreement with the scaling hypothesis.16 Besides, the reliability of the critical exponents can be tested by other rigorous methods. The first method is based on the m2 vs. μ0h/m curve.18 Here, m = M(μ0H, ε)ε−β and h = μ0Hε−(β+γ) are the renormalized magnetization and field, respectively. The m2 vs. μ0h/m curve for our sample is shown in Fig. 8. We can see from this figure that all the data still fall on two separate curves. These results confirm that the critical exponents can generate the scaling equation of state for La0.75Ca0.05Na0.20MnO3.
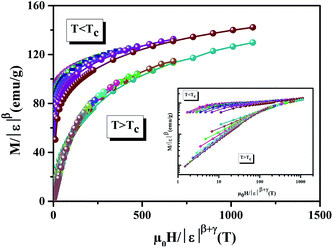 |
| | Fig. 7 Scaling plot below and above TC for the La0.75Ca0.05Na0.20MnO3 sample. The inset shows the same plots on a ln–ln scale. | |
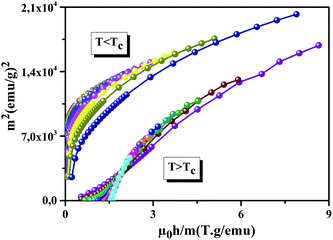 |
| | Fig. 8 The renormalized magnetization m2 versus μ0h/m for the La0.75Ca0.05Na0.20MnO3 sample. | |
The second method is shown in Fig. 9. According to the scaling equation of state:31
| |
 | (9) |
where
h is the scaling function. Based on this, we can confirm the reliability of the used
TC and the critical exponents. The hypothesis from the scaling
eqn (9) is that all the experimental data points should collapse onto a universal curve.
32 Fig. 9 displays
M/(
μ0H)
1/δ vs. ε/(
μ0H)
1/β+γ, using the critical exponents and the
TC determined from the KF method and the critical isotherm. It is clear that our curves collapse onto a universal curve, which confirms that the critical exponents are appropriate.
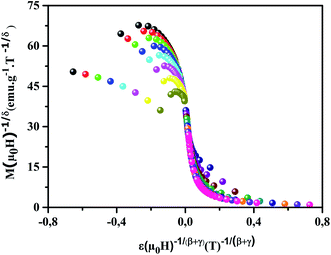 |
| | Fig. 9 M(μ0H)−1/δ as function of ε(μ0H)−1/(β+γ) for the La0.75Ca0.05Na0.20MnO3 sample in the critical region, at different temperatures. | |
Moreover, the reliability of the critical exponents can be checked by an equation proposed by Franco et al.33 In fact, for magnetic systems, the scaling equation of state takes the form:
| |
 | (10) |
Eqn (10) is based on the relationship between the critical exponents and the magnetic entropy change, where Δ = β + γ![[thin space (1/6-em)]](https://www.rsc.org/images/entities/char_2009.gif) and α + 2β + γ = 2 are the usual critical exponents. According to eqn (10) and using the critical exponents from MAP, Fig. 10 shows
and α + 2β + γ = 2 are the usual critical exponents. According to eqn (10) and using the critical exponents from MAP, Fig. 10 shows  vs.
vs.  plot. We can see that all (−ΔSM) curves collapse on a single curve. This indicates excellent agreement between the critical exponents and the scaling hypothesis near the magnetic transition.
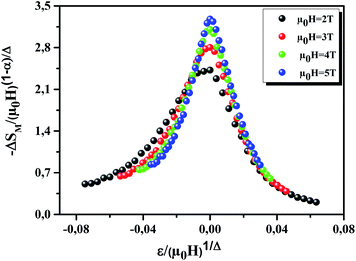 |
| | Fig. 10 The variation of  vs. vs.  | |
4. Conclusion
In the present study, we have comprehensively studied the critical phenomenon at the FM–PM phase transition in a polycrystalline manganite of La0.75Ca0.05Na0.20MnO3 via dc magnetization. The values of the critical exponents for our sample were extracted using the MAP method, KF method and critical isotherm analysis. Interestingly, the obtained exponent values are very close to the values expected for the universality class of the Tricritical Mean Field model. The validity of the obtained critical exponents using the various methods was confirmed by the Widom scaling relation and the universal scaling hypothesis.
Conflicts of interest
The authors declare no conflict of interest.
References
- K. Chahara, T. Ohno, M. Kasai and Y. Kosono, Appl. Phys. Lett., 1993, 63, 1990–1992 CrossRef CAS.
- K. Ghosh, C. J. Lobb, R. L. Greene, S. G. Karabashev, D. A. Shulyatev, A. A. Arsenov and Y. Mukovskii, Phys. Rev. Lett., 1998, 81, 4740–4743 CrossRef CAS.
- M. S. Kim, J. B. Yang, Q. Cai, X. D. Zhou, W. J. James, W. B. Yelon, P. E. Parris, D. Buddhikot and S. K. Malik, Phys. Rev. B: Condens. Matter Mater. Phys., 2005, 71, 014433 CrossRef.
- A. Urushibara, Y. Morimoto, T. Arima, A. Masamitsu, G. Kido and Y. Tokura, Phys. Rev. B: Condens. Matter Mater. Phys., 1995, 51, 14103–14109 CrossRef CAS.
- M. McCormack, S. Jin, T. H. Teifel, R. M. Fleming, J. M. Phillips and R. Ramesh, Appl. Phys. Lett., 1994, 64, 3045–3047 CrossRef CAS.
- C. Zener, Phys. Rev., 1951, 82, 403–405 CrossRef CAS.
- M. Uehara, S. Mori, C. H. Chen and S. W. Cheong, Nature, 1999, 399, 560–563 CrossRef CAS.
- X. G. Li, R. K. Zheng, G. Li, H. D. Zhou, R. X. Huang, J. Q. Xie and Z. D. Wang, Europhys. Lett., 2002, 60, 670–676 CrossRef CAS.
- K. Kubo and N. Ohata, J. Phys. Soc. Jpn., 1972, 33, 21–32 CrossRef CAS.
- Y. Motome and N. Furulawa, J. Phys. Soc. Jpn., 2001, 70, 1487–1490 CrossRef CAS.
- S. Taran, B. K. Chaudhuri, S. Chatterjee, H. D. Yang, S. Veeleshwar and Y. Y. Chen, J. Appl. Phys., 2005, 98, 103903 CrossRef.
- A. Tozri, E. Dhahri and E. K. Hlil, Phys. Lett. A, 2011, 375, 1528–1533 CrossRef CAS.
- L. Chen, J. H. He, Y. Mei, Y. Z. Cao, W. WXia, H. F. Xu, Z. W. Zhu and Z. A. Xu, Phys. B, 2009, 404, 1879–1882 CrossRef CAS.
- D. Kim, B. L. Zink, F. Hellman and J. D. Coey, Phys. Rev. B: Condens. Matter Mater. Phys., 2002, 65, 214424–214431 CrossRef.
- S. Bouzidi, M. A. Gdaiem, J. Dhahri and E. K. Hlil, RSC Adv., 2019, 9, 65–76 RSC.
- H. E. Stanley, Introduction to Phase Transitions and critical Phenomena, Oxford University, London, 1971 Search PubMed.
- H. E. Stanley, Rev. Mod. Phys., 1999, 71, 358–366 CrossRef.
- S. N. Kaul, J. Magn. Magn. Mater., 1985, 53, 5–53 CrossRef CAS.
- K. Huang, Statistical Mechanics, Wiley, New York, 2nd edn, 1987 Search PubMed.
- A. Arrott, Phys. Rev., 1957, 108, 1394–1396 CrossRef CAS.
- A. Arrott and J. E. Noakes, Phys. Rev. Lett., 1967, 19, 786–789 CrossRef CAS.
- A. Schwartz, M. Scheffler and S. M. Anlage, Phys. Rev. B: Condens. Matter Mater. Phys., 2000, 61, R870–R873 CrossRef CAS.
- J. S. Kouvel and M. E. Fisher, Phys. Rev., 1964, 136, 1626–1632 CrossRef CAS.
- B. Widom, J. Chem. Phys., 1965, 43, 3898–3905 CrossRef.
- J. Fan, L. Ling, B. Hong, L. Zhang, L. Pi and Y. Zhang, Phys. Rev. B: Condens. Matter Mater. Phys., 2010, 81, 144426 CrossRef.
- T. L. Phan, T. A. Ho, P. D. Thang, Q. T. Tran, T. D. Thanh, N. X. Phuc, M. H. Phan, B. T. Huy and S. C. Yu, J. Alloys Compd., 2014, 615, 937–945 CrossRef CAS.
- M. Ziese, J. Phys.: Condens. Matter, 2001, 13, 2919–2934 CrossRef CAS.
- T. L. Phan, Q. T. Tran, P. Q. Thanh, P. D. H. Yen, T. D. Thanh and S. C. Yu, Solid State Commun., 2014, 184, 40–46 CrossRef CAS.
- N. Dhahri, J. Dhahri, E. K. Hlil and E. Dhahri, J. Magn. Magn. Mater., 2012, 324, 806–811 CrossRef CAS.
- D. Kim, B. Revaz, B. L. Zink, F. Hellman, J. J. Rhyne and J. F. Mitchell, Phys. Rev. Lett., 2002, 89, 227202 CrossRef CAS PubMed.
- V. Franco, R. Caballero-Flores, A. Conde, K. E. Knipling and M. A. Willard, Appl. Phys. Lett., 2011, 98, 102505 CrossRef.
- R. M'nassri, N. Chniba-Boudjada and A. Cheikhrouhou, J. Alloys Compd., 2015, 640, 183–192 CrossRef.
- V. Franco and A. Conde, Int. J. Refrig., 2010, 33, 465–473 CrossRef CAS.
|
| This journal is © The Royal Society of Chemistry 2019 |
Click here to see how this site uses Cookies. View our privacy policy here.  Open Access Article
 *a,
J. Dhahri
 a and
E. K. Hlilc
 with ε = (T − TC)/TC being the reduced temperature. These results suggest short-range interaction in our sample.
![[3 with combining macron]](https://www.rsc.org/images/entities/char_0033_0304.gif) c space group and had a detectable secondary phase of Mn3O4.15 The relative amount of Mn3O4 as determined from the XRD patterns of the sample was found to be 10%. To extract the critical exponent of the samples accurately, the magnetic isotherm for the sample was measured in the range of 0–5 T, in the vicinity of the PM to FM phase transition. The isothermals were corrected by a demagnetization factor D that was determined by a standard procedure from the low-field dc magnetization measurement at low temperatures (H = Happ − DM).
c space group and had a detectable secondary phase of Mn3O4.15 The relative amount of Mn3O4 as determined from the XRD patterns of the sample was found to be 10%. To extract the critical exponent of the samples accurately, the magnetic isotherm for the sample was measured in the range of 0–5 T, in the vicinity of the PM to FM phase transition. The isothermals were corrected by a demagnetization factor D that was determined by a standard procedure from the low-field dc magnetization measurement at low temperatures (H = Happ − DM).
 just below TC), γ (relevant to the initial magnetic susceptibility χ0,
  just above TC), and δ (associated with the critical isotherm M(TC, μ0H) at TC) are given as:16


![[thin space (1/6-em)]](https://www.rsc.org/images/entities/char_2009.gif) ± are the regular analytical functions with f+ for T > TC, and f− for T < TC.17,18
± are the regular analytical functions with f+ for T > TC, and f− for T < TC.17,18


![[thin space (1/6-em)]](https://www.rsc.org/images/entities/char_2009.gif) γ/β
γ/β


![[thin space (1/6-em)]](https://www.rsc.org/images/entities/char_2009.gif) and α + 2β + γ = 2 are the usual critical exponents. According to eqn (10) and using the critical exponents from MAP, Fig. 10 shows
and α + 2β + γ = 2 are the usual critical exponents. According to eqn (10) and using the critical exponents from MAP, Fig. 10 shows  vs.
vs.  plot. We can see that all (−ΔSM) curves collapse on a single curve. This indicates excellent agreement between the critical exponents and the scaling hypothesis near the magnetic transition.


