 Open Access Article
Fe3+-codoped ultra-small NaGdF4:Nd3+ nanophosphors: enhanced near-infrared luminescence, reduced particle size and bioimaging applications†
Yabing Li‡
ab,
Fujin Li‡b,
Yanan Huangb,
Haiyan Wuab,
Jian Wang ab,
Jin Yangab,
Qingbo Xiao
 bc and
Hongzhen Lin*ab
aSchool of Nano Technology and Nano Bionics, University of Science and Technology of China, Hefei, Anhui 230026, China
bi -Lab, Suzhou Institute of Nano-tech and Nano-bionics (SINANO), Chinese Academy of Sciences, Suzhou, 215123, China. E-mail: hzlin2010@sinano.ac.cn
cState Key Laboratory of Structural Chemistry, Fujian Institute of Research on the Structure of Matter, Chinese Academy of Sciences, Fuzhou, Fujian 350002, China
First published on 10th June 2019
Abstract
Small-sized lanthanide-doped nanoparticles (NPs) exhibiting superior near-infrared (NIR) luminescence properties are highly desired for bioimaging applications. Herein, Fe3+ ions are codoped in NaGdF4:Nd3+ nanocrystals via a simple coprecipitation method, which can simultaneously reduce the particle size and enhance the downconverting NIR luminescence of the NPs. The NIR luminescence intensity reaches the maximum for the obtained sub-5 nm NPs when the doping concentration of Fe3+ is tuned to 20 mol%, which is ∼1.7 times higher than that of the pristine 8.7 nm NPs without Fe3+ doping. After being modified with targeting molecules, the ultra-small NaGdF4:Nd3+,Fe3+ NPs were successfully applied as luminescent probes for targeted NIR imaging of tumors in biological tissues. Moreover, they also show great potential as a high contrast agent for T2-weighted MRI imaging.
1. Introduction
Lanthanide (Ln3+)-doped fluoride nanoparticles (NPs) simultaneously exhibiting small particle size and strong photoluminescence (PL) intensity are in high demand for their potential application in bioimaging.1–8 In particular, the trivalent neodymium (Nd3+) doped NPs show superior optical properties in luminescent bioimaging as both their excitation and emission can be located at the near-infrared (NIR) region, which provides high penetration depth and signal-to-noise ratio in biological specimens.9–12 For minimizing the potential interference in cellular systems and favoring the easier excretion from the body, ultra-small NPs with particle sizes of less than 6 nm are also necessary.13,14 Unfortunately, the PL intensity of Ln3+ ions in ultra-small NPs is always diminished by the notorious size-dependent surface quenching. For example, Nd3+-doped NPs with an average size of about 5 nm have been synthesized previously.9,10 Although the absolute quantum yield of such ultra-small NPs is much higher as compared to the upconversion (UC) NPs involving multiplexed excitation processes, their NIR luminescence intensity is only ∼25% of that for 15 nm-sized counterparts. Coating a layer of homo- or heterogeneous inorganic shell to eliminate the surface quenching is an effective way in enhancing the emission efficiency Nd3+ in the NPs.11,15,16 However, the core–shell structure requires complicated multi-step synthesis processes and the shell coating inevitably causes the growth of particle size. Another effective strategy for enhancing the luminescence efficiency of Ln3+ is altering the crystal-field (CF) surroundings around Ln3+ by codoping with metal ions, in view that the optical transitions of Ln3+ are sensitive to their local coordination. Very recently, various metal ions, such as Li+, K+, Co2+, Bi3+, Sc3+, Fe3+ and Mo3+, have been successfully adopted to tailor the host lattice and modify the PL intensities of Ln3+ in the NPs.17–23 Unfortunately, these studies are mainly focused on the UCNPs such as NaYF4:Yb3+,Er3+. So far, there is no report on improving the downconverting NIR luminescence of Nd3+ in small NPs by codoping with metal ions.In this paper, we report the synthesis of Fe3+ doped NaGdF4:Nd3+ NPs via a facile coprecipitation method. For the first time, enhanced NIR emission and reduced particle size are achieved at the same time by doping of metal ions. By further modifying the NPs with folic acid, targeted imaging of tumours in nude mouse can also be realized.
2. Experimental section
2.1 Materials
GdCl3 (99.99%), NdCl3 (99.99%), YCl3 (99.99%) were purchased from Jinan Henghua Sci. & Tec. Co., Ltd. FeCl3 (99.9%), folic acid (FA, 97%), oleic acid (technical grade, 90%), 1-octadecene (ODE, 90%) were purchased from Sigma-Aldrich. Ammonium fluoride (NH4F) and dimethylsulfoxide (DMSO, 99.99%) were purchased from Aladdin. N-hydroxythiosuccinimide sodium salt (NHS, 98%), 1-(3-dimethylaminopropyl)-3-ethylcarbodiimide hydrochloride (EDC) were purchased from Bailingwei Technology Co., Ltd. PEG phospholipid (DSPE–PEG (2000)–NH2) was purchased from Avanti Polar Lipids. NaOH, ethanol, methanol, cyclohexane, and chloroform were purchased from Sinopharm Chemical Reagent Co, Ltd (China). All reagents were used as received without further purification.2.2 Synthesis of Fe3+ doped NaGdF4:Nd3+ NPs
Monodispersed NaGdF4 NPs doped with Nd3+ (3 mol%) and Fe3+ (10, 20, 30, 40 mol%) were synthesized using a modified coprecipitation method. Briefly, 0.97-x mmol of GdCl3, 0.03 mmol of NdCl3, x mmol of FeCl3 were added to a mixture of oleic acid (20 mL) and 1-octadecene (15 mL). The mixture was heated to 160 °C under nitrogen protection and remained for 30 min to form the lanthanide oleate complexes. After cooled down to room temperature (RT), 4 mL of methanol solution containing 4 mmol NaOH and 6.4 mmol NH4F was added slowly, and stirred for 30 min at 70 °C to evaporate the methanol. Then, the mixture was slowly heated to 300 °C under stirring for 60 min. After cooling down to RT, the resulting NPs were precipitated by the addition of ethanol, separated by centrifugation, washed several times with ethanol and finally redispersed in cyclohexane.For comparison, 30 nm-sized NaYF4:Nd3+ NPs were also synthesized with the similar method, except that GdCl3 was replaced by YCl3, the NH4F was replaced as 4 mmol, NaOH was replaced as 2.5 mmol, and finally maintained at 310 °C for 90 min.
2.3 Modifying the NPs with PEG (PEG-NPs)
In a typical experiment, a dispersion containing 25 mg of NPs and 5 mL of chloroform was added into a 50 mL round-bottom flask equipped with a magnetic stir bar, and then another 5 mL of chloroform solution containing 10 mg of DSPE–PEG was added. After gently stirring for 30 min, the solvent was evaporated by rotary evaporation, and the residual was readily dispersed in water. After ultrasonication for 5 min, the resulting dispersion was filtered through a 0.22 μm membrane filter and then kept at 4 °C for further use.2.4 Target modification with folic acid (PEG-NPs-FA)
First, 30 mg of FA, 60 mg of NHS and 36 mg of EDC were dissolved in 6 mL of deionized water at room temperature, the pH value is controlled in the range of 7–8. Then, 4 mL of PEG-NPs-NH2 with a concentration of 5 mg mL−1 was added, and stirred in dark for 24 h at RT, dialyzed in deionized water for 48 hours. Finally, the mixture was freeze-dried to obtain the yellow PEG-NPs-FA powder and stored at −20 °C.2.5 Characterization
The powder X-ray diffraction (XRD) patterns of the samples were recorded by a BRUKER D8 Discover X-ray diffractometer (λ = 0.154 nm). Both transmission electron microscopy (TEM) and high-resolution TEM (HRTEM) measurements were performed using a Tecnai G2 F20 S-Twin field-emission TEM equipped with the energy-dispersive X-ray spectrum (EDS). The concentration of Gd3+ was measured on an inductively Coupled Plasma Optical Emission Spectrometer (PerkinElmer ICP-OES 2100DV). Fourier transforms infrared spectroscopy (FTIR) was measured on a Perkin-Elmer IR spectrometer using the KBr pellet technique. Dynamic light scattering (DLS) experiments were carried out on an ALV-5000 spectrometer goniometer equipped with an ALV/LSE-5004 light scattering electronic and multiple Tau digital correlator and a JDS Uniphase He–Ne laser (632.8 nm) with an output power of 22 mW. The MR images were measured using a Bruker 11.7 T micro-MRI system. The NIR PL spectra were measured using an Applied Nano Fluorescence spectrometer (USA) at RT with an excitation laser source of 785 nm.2.6 In vivo near-infrared imaging
Animal handling was carried out at the Animal Laboratory of Soochow University (Suzhou, China). All animal experiments were conducted in accordance with the university's guidelines and were approved by the university's ethics committee.The NIR imaging in vivo was performed with a 640 × 512 pixel 2D InGaAs/SWIR camera (Photonic Science, UK) equipped with an 880 nm long-pass filter and an 1100 nm long-pass filter (Daheng Optics and Fine Mechanics Co., Ltd, China). A near-infrared lens pair SWIR-35 (Navitar, US) was used to focus the image onto the detector. The excitation light was provided by an 808 nm diode laser (Starway Laser Inc., China). For in vivo NIR imaging, 100 μL of PEG-NPs-FA (2 mg mL−1) were intravenously injected in tail vein of a nude mouse. The mouse was scanned after post-injection of three hours under illumination of the 808 nm light at a power of 6.8 W and the exposure time of 100 s.
2.7 Cytotoxicity measurements
The cytotoxicity of the NPs was assessed by cell viability based on the MTT assay. The assay was performed in triplicate in the same manner. Briefly, HeLa cells were seeded into 96-well plates at a density of 1 × 10⁴ cells per wells in 150 μL of media. After overnight growth, the cells were incubated with various concentrations of PEG-NPs-FA (0, 20, 50, 100, 200, 300, 400, 500, 600 μg mL−1) for 24 h (37 °C, 5% CO2). Then 100 μL of MTT solution (1 mg mL−1) was added to each well and the cells were further incubated for 3 h at 37 °C. After the MTT solution was removed, 150 μL of DMSO was added to each well and the plate was gently shaken for 10 min to dissolve the precipitated violet crystals. The optical density (OD) was measured at 490 nm using a microplate reader (Perkin Elmer, Victor X4). Cell viability was evaluated as a percentage compared to control cells. The measured OD values of the blank, control, and experimental groups were coded as ODbla, ODcon, and ODexp, respectively. Cellular survival rates were calculated by,3. Result and discussion
3.1 Synthesis and characterization
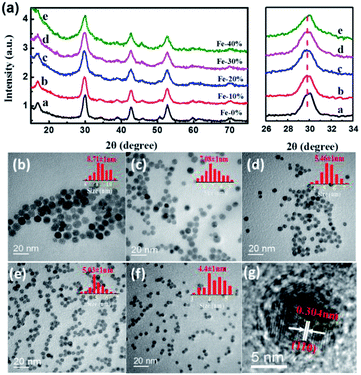
The NaGdF4:Nd3+,Fe3+ NPs were synthesized via a facile coprecipitation method. The XRD patterns of the samples confirm the formation of hexagonal-phase structure NaGdF4 (JCPDs: 00-27-0699) with no impurity peaks (Fig. 1a). Obviously, doping of Fe3+ ions has no effect on the crystal phase of NaGdF4:Nd3+,Fe3+ NPs. The ionic radii of Fe3+ and Gd3+ are 0.64 Å and 0.94 Å, respectively, which render the replacement of Gd3+ by Fe3+ in the fluoride NPs.24,25 The magnified diffraction peak of (111) at around 30° was also shown in Fig. 1a. As the Fe3+ doping concentration increases from 0 to 20 mol%, the diffraction peak (111) slightly shifts to the smaller angle, indicating that Fe3+ with smaller ionic radius was successfully doped into the lattice site of NaGdF4 and thus decreased unit cell volume and interplanar spacing. However, as increasing the Fe3+ concentration, Fe3+ occupies the interstitial sites in the NPs and induces abundant defects, which leads to decrease of unit cell volume and enlargement of diffraction peak of (111). Similar unit cell volume shrinking or expanding can also be seen in the Fe3+, Li+ or Mo3+ doped upconversion NPs.19–21,25 As shown in Fig. S1,† the EDX shows the presence of Gd, Na, F, Nd and Fe in NaGdF4:Nd3+,Fe3+ NPs, further indicating that Fe3+ can be doped into the nanoparticles. The TEM and HRTEM images of the NPs are also shown in Fig. 1. It can be seen from Fig. 1b–f that the as-prepared NPs with Fe3+concentraion varying from 0 to 40 mol% are all monodispersed in the solution. Moreover, the grain size of NaGdF4:Nd3+ NPs can be facilely regulated by the dopant of Fe3+ ions. When the doping concentration of Fe3+ increases from 0 to 40 mol%, the particle size of the NPs gradually decrease from 8.7 to 4.4 nm (see also Fig. S2†). Similar phenomenon can be seen in the NaYF4 NPs doped with high concentration of Li3+.23 As shown in the Fig. 1g, the HRTEM image clearly shows the high crystalline nature of the NaGdF4:Nd3+,Fe3+ NPs. The lattice fringes with a d-spacing of 0.304 nm agree well with the lattice spacing for the (110) plane of hexagonal-phase NaGdF4.3.2 Enhanced NIR emissions by Fe3+ doping
The NIR luminescence spectra of NaGdF4:Nd3+,Fe3+ NPs were recorded upon excitation at 785 nm. As shown in Fig. 2, all the NaGdF4:Nd3+,Fe3+ NPs exhibit two peaks centered at 1058 nm and 1335 nm in the NIR region, corresponding to the radiative relaxations from 4F3/2 to the low-lying multiplets of 4I11/2 and 4I13/2, respectively. The shapes of NIR luminescence spectra for Nd3+ in NaGdF4:Nd3+,Fe3+ NPs are similar to those in hexagonal-phase hosts such as NaGdF4 NPs but quit different in terms of line positions, indicative of the incorporation of Nd3+ ions in the lattice site of NaGdF4:Nd3+,Fe3+ NPs. Obviously, the doping of Fe3+ has a great influence on the NIR luminescence intensity of the NaGdF4:Nd3+ NPs (Fig. 2a). The NIR luminescence intensity at 1058 nm and 1335 nm significantly enhances when the Fe3+ doping concentration increases from 0 to 20 mol%, and gradually attenuates as the further increment of Fe3+ concentration. The maximum NIR intensity of NaGdF4:Nd3+ NPs doped with 20 mol% of Fe3+ is 1.7 times stronger than that of the Fe3+-free counterparts (Fig. 2b). Previous researches have proved that the optical transitions of rare earth ions in inorganic hosts highly depends on their local coordination, and engineering the local structure of Ln3+ in the inorganic NPs has been regarded as a facile strategy for improving their luminescence intensity.26–28 As has been discussed before, the doping of Fe3+ with small ionic radius in β-NaGdF4 will regulate the local structure around Nd3+ in the crystal field. The volumetric shrinkage breaks the symmetry of the local crystal field around the Nd3+ ions, which leads to the high-sensitivity transmission and PL intensity enhancement of Nd3+ when the concentration of Fe3+ increase from 0 to 20 mol%. However, when the further increase the dopant content of Fe3+, lots of lattice distortion and defects would appear due to excessive Fe3+ doping, which thus decrease the luminescence intensity of Nd3+. The change of local crystal field around the Nd3+ by Fe3+ may also be reflected by difference in the radiative relaxations of 4F3/2 → 4I11/2 and 4F3/2 → 4I13/2. As can be seen in Fig. S3,† the integrated PL intensities of the band centered at 1058 nm are slightly stronger than those of at 1335 nm when doped with different concentration of Fe3+, indicating that the doping of Fe3+ is a little more prone to increase the 4F3/2 → 4I11/2 transition as compared to 4F3/2 → 4I13/2.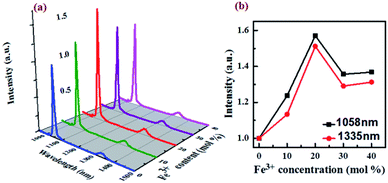 | ||
| Fig. 2 (a) NIR luminescence spectra of NaGdF4:Nd3+,Fe3+ NPs with Fe3+ doping concentration of 0–40 mol%. (b) Effect of Fe3+ doping on the NIR. | ||
3.3 Targeted NIR bioimaging
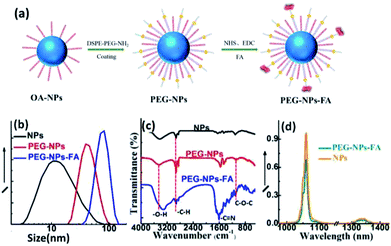
The as synthesized NaGdF4:Nd3+,Fe3+ NPs are coated by hydrophobic oleic acid ligands and not suitable for the practical biological applications. The amphiphilic polymer DSPE–PEG (2000)–NH2 was selected as capping ligands to convert the NPs into hydrophilic ones (PEG-NPs).29–32 The NPs would become water-dispersible driven by the hydrophobic van der Waals interactions between the hydrophobic tail of the phospholipids and the primary oleate ligands on the NPs surface. The fatty acid chains of the phospholipids are embedded in the hydrophobic surface of the NPs, while the hydrophilic part points out toward the aqueous environment. In such a way, the surfaces of NPs can be modified with PEG, an inert, nontoxic, and nonimmunogenic hydrophilic polymer.33 Since DSPE–PEG–NH2 has a reactive group –NH2, (Fig. S9†). It can bind to the carboxyl group in FA. To facilitate targeted bioimaging in tissues, the NPs were further modified with the folic acid (FA) molecules (PEG-NPs-FA).34–37 The schematic representation of the surface modification processes are shown in Fig. 3a. After surface modification, the size distribution of PEG-NPs and PEG-NPs-FA in aqueous solution was measured by DLS, and the hydrated particle sizes are determined to be 36 and 101 nm, respectively (Fig. 3b). The increase in hydrated size compared to the pristine nanoparticles may be due to the outward extension of the PEG phospholipid chain and slight aggregation of the NPs after surface modification. The stability of NPs in physiological medium was shown in Fig. S5–S7.† The successful modification of PEG and FA on the surface of nanoparticles was further demonstrated by FTIR. As shown in Fig. 3c, the pristine NPs, PEG-NPs and PEG-NPs-FA all exhibit broad absorption peaks centered at around 3438 cm−1, which is corresponding to the stretching vibration of O–H bonds. After PEG modification, there is a significant enhancement of the peak at 2900 cm−1 ascribing to vibration of C–H band. Moreover, the tensile vibration of the C–O–C bond of PEG peak at 1110 cm−1 can also be observed, demonstrating the successful coating of PEG on the NPs. A new peak (1607 cm−1) attributing to the stretching vibration of the –C![[double bond, length as m-dash]](https://www.rsc.org/images/entities/char_e001.gif) N bond of FA molecule can be observed in PEG-NPs-FA, which demonstrates the successful modification of FA at the NP surface. After FA modification, the zeta potential of the NPs change from 33.8 mV for PEG-NPs to −8.59 mV for PEG-NPs-FA due to the existence of –COOH in FA molecules (Fig. S4†). The amount of FA adsorbed was approximately 20% weight of the NPs. (Fig. S10†). After targeted modification of PEG and FA, the PEG-NPs-FA still retained strong NIR luminescence and relatively lower cytotoxicity (Fig. 3d and S8†), showing the excellent properties of the PEG-NPs-FA for bioimaging applications.
N bond of FA molecule can be observed in PEG-NPs-FA, which demonstrates the successful modification of FA at the NP surface. After FA modification, the zeta potential of the NPs change from 33.8 mV for PEG-NPs to −8.59 mV for PEG-NPs-FA due to the existence of –COOH in FA molecules (Fig. S4†). The amount of FA adsorbed was approximately 20% weight of the NPs. (Fig. S10†). After targeted modification of PEG and FA, the PEG-NPs-FA still retained strong NIR luminescence and relatively lower cytotoxicity (Fig. 3d and S8†), showing the excellent properties of the PEG-NPs-FA for bioimaging applications.
To test the ability of our sample for targeting imaging, nude mice with HeLa tumors were treated with PEG-NPs-FA. As can be seen in Fig. 4a, after 3 hours of injection into the tail vein, bright luminescence could be seen at the tumor under external 800 nm laser irradiation, demonstrating that PEG-NPs-FA can be used for targeted imaging in vivo. Since both the excitation and the emission are in the near-infrared range, the penetration depth can be greatly improved as compared to the visible lights.38 In order to assess the dynamic flow, the images of mice were captured at different time periods. It can be seen that for the PEG-NPs-FA with hydrodynamic dimension of ∼101 nm, the NIR intensity at the tumor reaches the maximum within about 15 min, indicating that the NPs are accumulated at the tumor site in 15 min. For comparison, the NPs with hydrodynamic dimension of 150 nm were accumulated much faster at the tumor site, with the NIR intensity reaching the maximum in ∼5 min (Fig. 4b and S11†). As shown in Fig. S12 in the ESI,† we also have used other mice for in targeting, For comparison, we have used PEG-NPs for non-targeted testing of other mice. The results show no passive accumulation of the nanoparticles in the tumor (Fig. S13†). Such phenomenon reflects that the smaller NPs are more prone to resist aggregation in tissues.
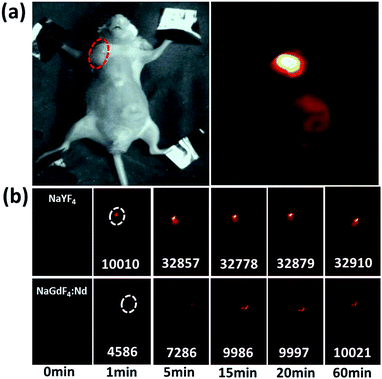 | ||
| Fig. 4 (a) Targeted NIR imaging of the tumors by PEG-NPs-FA, and (b) comparison of the flow of the NPs with different hydrodynamic dimensions. | ||
3.4 High contrast MR imaging
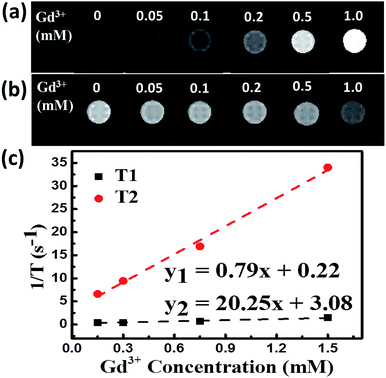
The longitudinal relaxation time (T1) and transverse relaxation time (T2) for different concentrations of PEG-NPs-FA were tested to evaluate their MRI properties. As can be seen in the Fig. 5a, b and S14a,† the MRI images of the NPs in aqueous solutions significantly enhanced with T2-weighted sequences as the increment of Gd3+ concentration. The obtained T1 and T2 values were plotted as 1/T1 (r1) and 1/T2 (r2) versus Gd3+ molar concentrations, respectively. The slope of these lines provides the molar longitudinal relaxivity r1 and transversal relaxivity r2, which are commonly used to evaluate the performance of MRI contrast agents.38,39 Both experiments show a linear relation between concentration and relaxation times of protons. Obviously, the ratio of r2/r1 for NaGdF4:Nd3+,Fe3+ NPs (25.63) (Fig. 5c) is much higher than that of NaGdF4:Nd3+ (7.94) (Fig. S14b†). The large value of r2/r1 enables high contrast for T2-weighted MRI.39–41 Obviously, doping of Fe3+ in the NaGdF4:Nd3+ NPs can significantly increase the contrast of T2-weighted MRI under ultra-high magnetic field.4. Conclusion
We have synthesized the Fe3+-doped NaGdF4:Nd3+ NPs by a facile coprecipitation method. The doping of Fe3+ can significantly decrease the particle size and enhance the NIR luminescence intensity of the NPs simultaneously. Due to reduced local symmetry by Fe3+ doping, the NIR intensity increased by 1.7 times when the NPs size decrease from 8.7 nm to 4.4 nm. Through modification with targeting molecules, targeted NIR imaging of biological tissue tumors was achieved by the ultra-small NaGdF4:Nd3+,Fe3+ NPs. The so-obtained NPs also show great potential in T2-weighted MRI imaging.Conflicts of interest
There are no conflicts to declare.Acknowledgements
This work is supported by the National Key Research and Development Program (2016YFA0200700), the National Natural Science Foundation of China (No. 21773294 and 21433013), the State Key Laboratory of Structural Chemistry, Chinese Academy of Sciences (20180029).Notes and references
- H. Fu, P. Peng, R. Li, C. Liu, Y. Liu, F. Jiang, M. Hong and X. Chen, Nanoscale, 2018, 10, 9353–9359 RSC.
- A. Gautam and P. Komal, Coord. Chem. Rev., 2018, 376, 393–404 CrossRef CAS.
- A. M. Kaczmarek, M. K. Kaczmarek and R. Van Deun, Nanoscale, 2019, 11, 833–837 RSC.
- B. Liu, C. Li, P. Yang, Z. Hou and J. Lin, Adv. Mater., 2017, 29, 1605434 CrossRef.
- M. Liu, Z. Shi, X. Wang, Y. Zhang, X. Mo, R. Jiang, Z. Liu, L. Fan, C. G. Ma and F. Shi, Nanoscale, 2018, 10, 20279–20288 RSC.
- Q. Qiang, S. Du, X. Ma, W. Chen, G. Zhang and Y. Wang, Dalton Trans., 2018, 47, 8656–8662 RSC.
- M. Wang, Y. Tian, F. Zhao, R. Li, W. You, Z. Fang, X. Chen, W. Huang and Q. Ju, J. Mater. Chem. C, 2017, 5, 1537–1543 RSC.
- W. You, D. Tu, W. Zheng, P. Huang and X. Chen, J. Lumin., 2018, 201, 255–264 CrossRef CAS.
- B. Liu, Y. Y. Chen, C. X. Li, F. He, Z. Y. Hou, S. S. Huang, H. M. Zhu, X. Y. Chen and J. Lin, Adv. Funct. Mater., 2015, 25, 4717–4729 CrossRef CAS.
- J. Peng, C. L. Teoh, X. Zeng, A. Samanta, L. Wang, W. Xu, D. Su, L. Yuan, X. Liu and Y.-T. Chang, Adv. Funct. Mater., 2016, 26, 191–199 CrossRef CAS.
- B. Zhou, W. Yang, S. Han, Q. Sun and X. Liu, Adv. Mater., 2015, 27, 6208–6212 CrossRef CAS.
- X. Li, X. Liu, D. M. Chevrier, X. Qin, X. Xie, S. Song, H. Zhang, P. Zhang and X. Liu, Angew. Chem., Int. Ed. Engl., 2015, 54, 13312–13317 CrossRef CAS.
- G. Tian, X. Zheng, X. Zhang, W. Yin, J. Yu, D. Wang, Z. Zhang, X. Yang, Z. Gu and Y. Zhao, Biomaterials, 2015, 40, 107–116 CrossRef CAS.
- W. Zheng, D. T. Tu, P. Huang, S. Y. Zhou, Z. Chen and X. Y. Chen, Chem. Commun., 2015, 51, 4129–4143 RSC.
- W. Zheng, P. Huang, D. T. Tu, E. Ma, H. M. Zhu and X. Y. Chen, Chem. Soc. Rev., 2015, 44, 1379–1415 RSC.
- X. Li, R. Wang, F. Zhang, L. Zhou, D. Shen, C. Yao and D. Zhao, Sci. Rep., 2013, 3, 3536 CrossRef PubMed.
- L. N. Sun, X. Q. Ge, J. L. Liu, Y. N. Qiu, Z. W. Wei, B. Tian and L. Y. Shi, Nanoscale, 2014, 6, 13242–13252 RSC.
- C. Dong, J. Pichaandi, T. Regier and F. C. J. M. van Veggel, J. Phys. Chem. C, 2011, 115, 15950–15958 CrossRef CAS.
- G. Chen, T. Y. Ohulchanskyy, S. Liu, W.-C. Law, F. Wu, M. T. Swihart, H. Ågren and P. N. Prasad, ACS Nano, 2012, 6, 2969–2977 CrossRef CAS.
- H. Yu, Q. M. Huang, E. Ma, X. Q. Zhang and J. C. Yu, J. Alloys Compd., 2014, 613, 253–259 CrossRef CAS.
- A. Xia, X. F. Zhang, J. Zhang, Y. Y. Deng, Q. Chen, S. S. Wu, X. H. Huang and J. Shen, Biomaterials, 2014, 35, 9167–9176 CrossRef CAS PubMed.
- Y. Ding, X. Zhang, H. Gao, S. Xu, C. Wei and Y. Zhao, J. Alloys Compd., 2014, 599, 60–64 CrossRef CAS.
- Q. Cheng, J. Sui and W. Cai, Nanoscale, 2012, 4, 779–784 RSC.
- P. Ramasamy, P. Chandra, S. W. Rhee and J. Kim, Nanoscale, 2013, 5, 8711–8717 RSC.
- Y. Zhang, Y. Shen, M. Liu, Y. Han, X. Mo, R. Jiang, Z. Lei, Z. Liu, F. Shi and W. Qin, CrystEngComm, 2017, 19, 1304–1310 RSC.
- H. Wang and T. Nann, ACS Nano, 2009, 3, 3804–3808 CrossRef CAS PubMed.
- J. Tang, L. Chen, J. Li, Z. Wang, J. Zhang, L. Zhang, Y. Luo and X. Wang, Nanoscale, 2015, 7, 14752–14759 RSC.
- D. Wang, B. Xue, X. Kong, L. Tu, X. Liu, Y. Zhang, Y. Chang, Y. Luo, H. Zhao and H. Zhang, Nanoscale, 2015, 7, 190–197 RSC.
- Q. Zhan, J. Qian, H. Liang, S. Gabriel, D. Wang, S. He, Z. Zhang and a. S. Andersson-Engels, ACS Nano, 2011, 5, 3744–3757 CrossRef CAS PubMed.
- H. Lin, D. Xu, D. Teng, S. Yang and Y. Zhang, Opt. Mater., 2015, 45, 229–234 CrossRef CAS.
- T. Fan, Q. Zhang and Z. Jiang, Opt. Commun., 2011, 284, 1594–1597 CrossRef CAS.
- X. Chen, Z. Zhao, M. Jiang, D. Que, S. Shi and N. Zheng, New J. Chem., 2013, 37, 1782–1788 RSC.
- L. L. Li, R. Zhang, L. Yin, K. Zheng, W. Qin, P. R. Selvin and Y. Lu, Angew. Chem., Int. Ed. Engl., 2012, 51, 6121–6125 CrossRef CAS.
- A. Basu, P. Upadhyay, A. Ghosh, D. Chattopadhyay and A. Adhikary, ACS Biomater. Sci. Eng., 2018, 5, 373–389 CrossRef.
- Y. Li, J. Lin, X. Yang, Y. Li, S. Wu, Y. Huang, S. Ye, L. Xie, L. Dai and Z. Hou, ACS Appl. Mater. Interfaces, 2015, 7, 17573–17581 CrossRef CAS.
- J. Wu, Q. Liu and R. J. Lee, Int. J. Pharm., 2006, 316, 148–153 CrossRef CAS PubMed.
- Z. Zhang and J. Yao, AAPS PharmSciTech, 2012, 13, 802–810 CrossRef CAS PubMed.
- Y. Feng, Q. Xiao, Y. Zhang, F. Li, Y. Li, C. Li, Q. Wang, L. Shi and H. Lin, J. Mater. Chem. B, 2017, 5, 504–510 RSC.
- S. Biju, J. Gallo, M. Banobre-Lopez, B. B. Manshian, S. J. Soenen, U. Himmelreich, L. Vander Elst and T. N. Parac-Vogt, Chemistry, 2018, 24, 7388–7397 CrossRef CAS PubMed.
- X. Jin, F. Fang, J. Liu, C. Jiang, X. Han, Z. Song, J. Chen, G. Sun, H. Lei and L. Lu, Nanoscale, 2015, 7, 15680–15688 RSC.
- H. Yang, Y. Zhuang, Y. Sun, A. Dai, X. Shi, D. Wu, F. Li, H. Hu and S. Yang, Biomaterials, 2011, 32, 4584–4593 CrossRef CAS PubMed.
Footnotes |
| † Electronic supplementary information (ESI) available. See DOI: 10.1039/c9ra00798a |
| ‡ These authors contributed equally to this work. |
| This journal is © The Royal Society of Chemistry 2019 |


