 Open Access Article
A MnO2–[Ru(dpp)3]Cl2 system for colorimetric and fluorimetric dual-readout detection of H2O2
Yuan Zhanga,
Kewei Hub,
Zhenbao Ling*a and
Weihua Di *b
*b
aCollege of Instrumentation and Electrical Engineering, Jilin University, Changchun 130022, People's Republic of China. E-mail: lingzhenbao@jlu.edu.cn
bState Key Laboratory on Integrated Optoelectronics, College of Electronic Science and Engineering, Jilin University, Changchun 130012, People's Republic of China. E-mail: whdi@jlu.edu.cn
First published on 8th March 2019
Abstract
Two-dimensional (2D) MnO2 nanosheets were synthesized by a template-free and one-step route, and the dye [Ru(dpp)3]Cl2 was linked onto the MnO2 nanosheet surface via electrostatic interaction. The formed MnO2–[Ru(dpp)3]Cl2 hybrid was used for a dual optical detection for H2O2, an important reactive oxygen species (ROS). Upon addition of H2O2, the reaction of MnO2 with H2O2 results in the dissolution of MnO2 nanosheets and simultaneous generation of O2. The fading of the solution and simultaneous fluorescence change of [Ru(dpp)3]Cl2, sensitive to O2, enables colorimetric and fluorimetric dual-mode detection of H2O2. The dual-output assay in a single probe provides a good sensitivity with a detection limit of 0.18 μM H2O2. The dual-signal strategy can efficiently overcome the shortcoming of the single detection mode, and improve the detection accuracy by an additional correction of output signals from each other. Moreover, the successful determination of H2O2 in the serum samples demonstrates the potential applicability of the MnO2–[Ru(dpp)3]Cl2 based probe in biosensing and bioanalysis.
1. Introduction
Hydrogen peroxide (H2O2), one of the most important reactive oxygen species (ROS), is present in various biological tissues, and plays critical roles in redox biology and cell signaling.1–4 Misregulation of H2O2 can produce and accumulate oxidative stress inside cells, resulting in damage to biomolecules such as DNA, proteins, and lipids. In the long term, this damage leads to various disorders, such as neurodegeneration, HIV activation, cardiovascular diseases, cancer and aging.5–10 Also, H2O2 is a main intermediate or final product of many enzymatic reactions by a large number of oxidases, thus enabling quantitative assays of the activity of the enzyme as well as various enzyme substrates such as protein and carbohydrate in living organisms via a H2O2-mediated process.11–15 Therefore, the accurate and sensitive detection of H2O2 is essential to evaluate its concentration in various biological events and understand the related biological effects.To date, various analytical techniques have been developed for the detection of H2O2, such as high performance liquid chromatography (HPLC) detection,16 optical sensing,17–21 colorimetric method,22–25 electrochemical analysis,26–28 etc. It is well known that colorimetric and fluorimetric methods are relatively simple, rapid and low cost, but they are of high sensitivity and specificity, and thus they are the typical sensing techniques of optical sensors, which can be easily transformed molecular events into fluorescence intensity or color changes. Colorimetric detection is usually achieved by monitoring the absorbance variation at a specific wavelength induced by the analyte concentration. Moreover, this method permits “naked eye” detection via color change with no requirement for sophisticated instrumentation.29,30 Fluorimetric methods are performed with the assistance of suitable probes, whose fluorescent signals respond to their interactions with analytes via photo-induced electron transfer (PET), fluorescence resonance energy transfer (FRET) and inner filter effect (IFE).30–32
It is of great interest to integrate both optical modes into one sensor, by a fluorimetric and colorimetric dual mode strategy, which can minimize the measurement errors and has been proven to be more efficient than the single mode method.33 Compared with the single-readout analytical strategy, the dual-readout nanomaterials-based protocols endow sensors with improved exactness and increased sensitivity. Commonly, two individual readout probes are combined to realize this dual-readout strategy, which probably complicates the detection process and even leads to unexpected interference. Therefore, a single probe with dual-readout performance was distinctly superior to the combinations of two individual probes in the dual-readout design.34–37
In this work, two-dimensional (2D) MnO2 nanosheets were synthesized by a template-free redox route, and the dye [Ru(dpp)3]Cl2 was linked onto the surface of MnO2 nanosheets via an electrostatic interaction. The formed MnO2–[Ru(dpp)3]Cl2 hybrid was used for a colorimetric and fluorimetric detection of H2O2, performing the dual-output assay in a single probe. The dual-signal detection strategy in a single probe can hold an additional correction of output signals from each other, thus improving the detection accuracy.
2. Experimental
2.1. Chemicals
Analytical grade KMnO4, sodium dodecyl sulfate (SDS), concentrated sulfuric acid (H2SO4), hydrogen peroxide (H2O2) were obtained from Beijing Chemicals Reagents. [Ru(dpp)3]Cl2 was purchased from Sigma-Aldrich Co. (Shanghai, China). MilliQ water was used throughout. All other chemical reagents were of analytical reagent grade. The citrate buffer was prepared by mixing an approximate ratio of citric acid and sodium citrate solutions.2.2. Synthesis of MnO2 nanosheets
MnO2 nanosheets were synthesized according to previous publications.38 Typically, 32 mL of SDS solution (0.1 M) and 1.6 mL of H2SO4 solution (0.1 M) were added into 283.2 mL distilled water and heated at 95 °C for 15 min. 3.2 mL of KMnO4 solution (0.05 M) was added into the above solution quickly to start the reaction, and the reaction mixture was maintained at 95 °C for 60 min. In this process, the initial KMnO4 solution with purplish red color was gradually transformed to the dark brown colloidal suspension. The resulting suspensions were centrifuged, and the precipitates were thoroughly washed with ethanol for 3 times and subsequently dried in air at 50 °C for various analyses. The purified MnO2 was dispersed in MilliQ water to form a colloidal suspension for analyte detection.2.3. Preparation of MnO2/[Ru(dpp)3]Cl2 hybrid
A specified concentration (20 μg mL−1) of MnO2 nanosheets and 50 μM of [Ru(dpp)3]Cl2 were added to ethanol, ultrasonicated at room temperature for 30 min and left overnight. Then, they were centrifugated at 12![[thin space (1/6-em)]](https://www.rsc.org/images/entities/char_2009.gif) 000 rpm for 15 min to remove the supernatant. The precipitates were dissolved in aqueous solution.
000 rpm for 15 min to remove the supernatant. The precipitates were dissolved in aqueous solution.
2.4. Characterizations
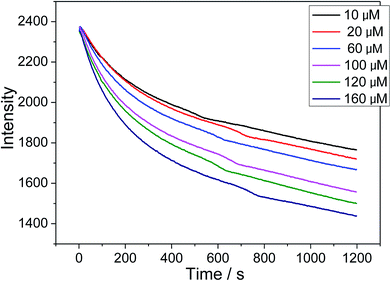
The X-ray powder diffraction (XRD) data were collected on an X'Pert MPD Philips diffractometer (CuKα X-radiation at 40 kV and 50 mA) with a scanning step of 0.02°. The transmission electron microscopy (TEM) observations were carried out using a JEOL 2200FS microscope. Samples for TEM investigations were prepared by first dispersing the particles in ethanol under assistance of ultrasonification and then dropping one drop of the suspension on a copper TEM grid coated with a holey carbon film. Fourier transform infrared (FT-IR) spectra (Mattson 5000) of the samples were measured in the range of 4000–450 cm−1 in transmission mode. The pellets were prepared by adding 0.8 mg of the sample powder to 80 mg of KBr. The powders were mixed homogeneously and compressed at a pressure of 10 KPa to form transparent pellets. X-ray photoelectron spectroscopy (XPS) analysis was performed using a PHI Quantera SXM (ULVAC-PHI) device operating at a pressure of 10−8 torr. The photoelectron emission spectra were recorded using a monochromatic Al Kα source (100 W). The angle between the X-ray direction and the emitted electron direction was 45°. The UV-vis absorbance measurements were carried out using a Schimadzu UV-2550 scanning spectrophotometer with a scan rate of 240 nm min−1. The zeta potential measurements were conducted on the same Malvern Nano ZS instrument. The fluorescent response and emission spectrum of the sensor were measured using a 1 cm glass cuvette at 25 °C in citrate buffer (pH 5.6) with a fluorescence spectrophotometer (Hitachi F-4500, Japan) equipped with a xenon lamp. All response curves were acquired with an excitation wavelength of 535 nm. The fluorescence intensity of MnO2/[Ru(dpp)3]Cl2 (10 μg mL−1) at 625 nm as a function of time was recorded by adding 30 μL of H2O2 solution to 3 mL of MnO2/[Ru(dpp)3]Cl2 suspensions.2.5. H2O2 detection
H2O2 detection was conducted in an open cuvette configuration. In a typical process of H2O2 detection, 2 mL of MnO2/[Ru(dpp)3]Cl2 solution (10 μg mL−1) was added to an open cuvette, and a given concentration of H2O2 solution was then added slowly. After reaction 5 min, the emission spectrum of [Ru(dpp)3]Cl2 was recorded immediately with an excitation of 535 nm.3. Results and discussion
3.1. Synthesis and characterization of MnO2 nanosheets and MnO2/[Ru(dpp)3]Cl2 hybrid
A template-free and one-step method was used to synthesize the MnO2 nanosheets via a redox reaction of KMnO4 and sodium dodecyl sulfate (SDS). The crystal structure of the synthesized product was characterized by XRD. The XRD profile shown in Fig. 1(a) exhibited four characteristic peaks at 2 theta = 12.1°, 24.2°, 36.7°, 66°, indicating a typical lamellar structure. All the diffraction peaks can be well indexed to δ-MnO2 phase (JCPDS no. 18-0802). Fig. 1(b) shows a TEM image of representative areas of the as-synthesized product. The sample was typically composed of ultrathin and transparent lamellar structure with ample graphene-like wrinkles and folds, displaying a typical 2D morphology of MnO2 nanosheets.39 The perceived average lateral dimension of the nanosheets is estimated to be ∼200 nm.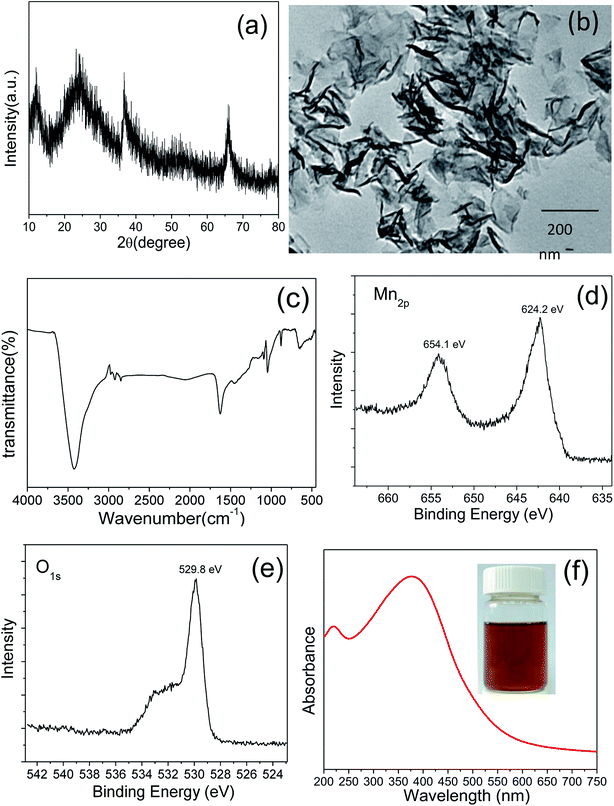 | ||
| Fig. 1 XRD pattern (a), TEM image (b), FT-IR spectrum (c), XPS spectra of Mn2p (d) and O1s (e), and UV-vis absorption spectrum (f) of the synthesized MnO2 nanosheets. | ||
The FT-IR spectrum (Fig. 1(c)) provides further insight into the structure and surface state of synthesized MnO2. The peaks at 518, 473 cm−1 are assigned to the characteristic absorption of the Mn–O stretching vibration of octahedral [MnO6] framework.40,41 Two intense bands at 3420 and 1625 cm−1 are attributed to the physically adsorbed water and the interlayer water in the MnO2 nanosheets.40 The low intensity of peaks in the 2922–2995 cm−1 region are assignable to the asymmetric and symmetric –CH2 and –CH3 stretching due to the use of SDS in the synthesis.42
XPS was used to make a qualitative analysis of chemical valence and binding of the element for the synthesized MnO2. Two characteristic peaks centered at 642.2 and 654.1 eV correspond to Mn 2p3/2 and Mn 2p1/2 of MnO2, respectively (Fig. 1(d)).40,43 The spin-energy separation of ∼11.9 eV is also consistent with those previous reports by other research groups.40,44 No additional signals attributed to Mn2O3 and KMnO4 were found in the XPS spectrum, indicating the generation of pure MnO2. The XPS spectrum of oxygen exhibits two peaks centered at 529.8 and 532.7 eV (Fig. 1(e)), which are assigned to the lattice oxygen of [MnO6] octahedra and the oxygen in the interlayer H2O or H3O+, in good agreement with the FTIR result.40
The UV-vis absorption spectrum (Fig. 1(f)) of the synthesized MnO2 solution exhibits a broad absorption band around ∼375 nm, which is attributed to the d–d transition of Mn(IV) in the octahedral [MnO6] unit. The wavelength and intensity of the absorbance are in line with the previous findings of single-layer MnO2 nanosheets by other groups.45–47 The colloidal suspension of single-layer MnO2 nanosheets shows good stability and remains stable at 4 °C in the dark for more than 15 days without any precipitates.
The dye [Ru(dpp)3]Cl2 was linked onto the MnO2 nanosheet surface via an electrostatic interaction. In order to verify the interaction between MnO2 nanosheets and [Ru(dpp)3]Cl2, the zeta potential of MnO2 nanosheets was measured. The zeta potential of MnO2 nanosheets was 57.2 mV (pH = 7), while it decreased to 36.5 mV as MnO2 nanosheets were treated with [Ru(dpp)3]Cl2. This indicates that there exists an electrostatic interaction, leading to the conjugation of [Ru(dpp)3]Cl2 at the surface of MnO2 nanosheets. This indicates that [Ru(dpp)3]Cl2 could be linked onto the MnO2 nanosheets via an electrostatic interaction.
3.2. Design of dual-signal assay for H2O2 in a single probe
The present sensor for H2O2 detection consists of MnO2 nanosheets and an oxygen responsive fluorescent transducer, [Ru(dpp)3]Cl2. The as-synthesized MnO2 nanosheets were firstly incubated with the dye [Ru(dpp)3]Cl2, and the dye [Ru(dpp)3]Cl2 was linked onto the surface of MnO2 nanosheets by an electrostatic interaction. Upon the addition of H2O2, MnO2 nanosheets interact with H2O2 via a redox reaction following the eqn (1), resulting in the dissolution of MnO2 nanosheets, which makes the solution fade gradually, enabling the colorimetric detection of H2O2. Meanwhile, the in situ generated O2 in the reaction of MnO2 with H2O2 quenches the luminescence of [Ru(dpp)3]Cl2 that is an O2-sensitive phosphorescent dye.48 The changes of oxygen concentration induced by H2O2 addition can be transformed into a fluorescence signal using an oxygen responsive transducer, enabling the fluorimetric detection of H2O2. Therefore, the present MnO2–[Ru(dpp)3]Cl2 system enables a dual optical detection of H2O2, performing the dual readout assay in a single probe.| MnO2 + H2O2 + 2H+ = Mn2+ + O2 + 2H2O | (1) |
3.3. Optimization of the sensing system
To verify whether the above dual readout sensing principle for H2O2 detection is feasible, we conducted a preliminary experiment that a small amount of H2O2 was tentatively added to the MnO2–[Ru(dpp)3]Cl2 system. The fading of MnO2 solution was observed; meanwhile, the luminescence of [Ru(dpp)3]Cl2 was decreased, indicating the feasibility of sensing strategy.The sensing performances can be influenced by several factors, such as reaction pH value, incubation time of MnO2 and [Ru(dpp)3]Cl2 and so on. Therefore, these experimental parameters should be systematically optimized for H2O2 detection. The effect of the incubation time of MnO2 and [Ru(dpp)3]Cl2 on H2O2 detection was investigated. In the preparation process, the MnO2 nanosheets were first incubated with the dye [Ru(dpp)3]Cl2, and then centrifugated. The incubation time has significant influence on the numbers of [Ru(dpp)3]Cl2 molecule linked onto the surface of MnO2 nanosheets. With the increase of incubation time, the luminescence of [Ru(dpp)3]Cl2 increases. Up to 30 min, the luminescence was no longer increased. Thus, the incubation time of 30 min was chosen for the preparation of MnO2–[Ru(dpp)3]Cl2 sample.
The reactivity of MnO2 with H2O2 was found to be strongly dependent on the solution pH value. To demonstrate the effect of solution pH on the reactivity of MnO2 with H2O2, the experiments were conducted as below. The equivalent quantities of MnO2 were dispersed in 5 mL citrate buffer with different pH values ranging from 4.8 to 6.5 and MilliQ water with pH 7.4, respectively. Then, 50 μL of H2O2 solution (100 μM) was immediately added and reacted at room temperature for 3 min. The supernatant was immediately moved to a quartz cuvette for UV-vis absorption measurement. The absorbance of MnO2 solution with the addition of H2O2 decreases remarkably with the decrease of pH value (Fig. 2). For a parallel comparison, we also measured the absorption spectra of MnO2 solution under different pH conditions, but without the addition of H2O2. We can see that the absorbance of MnO2 solution without the addition of H2O2 decreases slightly with the decrease of pH values ranging from 7.4 to 4.8, indicating a slight decomposition of MnO2 nanosheets under an acidic condition. In contrast, the absorbance of MnO2 solution with the addition of H2O2 decreases remarkably (Fig. 2). The above results indicate that an acidic reaction condition benefits the reaction of MnO2 nanosheets with H2O2, and that the presence of H2O2 remarkably accelerates the decomposition of MnO2 in acidic solution. It is also considered that the speed of O2 release cannot be too fast during H2O2 detection. Here, the citrate buffer of pH 5.6 was chosen for H2O2 detection.
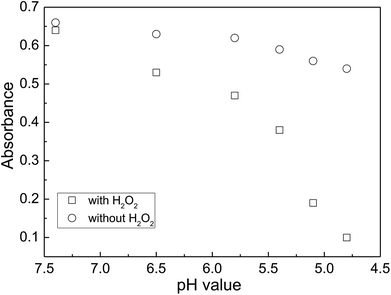 | ||
| Fig. 2 A comparison of the MnO2 solution absorbance with and without the addition of H2O2 under the reaction conditions with different pH values. The reaction time was fixed at 3 min. | ||
3.4. Colorimetric detection of H2O2
Fig. 3 shows the UV-vis absorption spectra of MnO2 solution after reaction upon the addition of various concentrations of H2O2 at pH 5.6. All UV-vis absorption spectra exhibited a broad band around 375 nm that originates from the d–d transition of Mn(IV) in the octahedral [MnO6] unit.38 With an increase of H2O2 concentration, the absorbance of the solution decreases gradually due to the reduction of MnO2 to Mn2+ by H2O2. Indeed, the variation of color depth of the solution as a result of the change of H2O2 concentration added can be observed directly by the naked eyes, as shown in the photographs taken for samples treated with various concentrations of H2O2 (inset of Fig. (2)). With the increase of H2O2 concentration added, the solution faded gradually. The absorbance exhibits a good linear relationship against H2O2 concentration in the range of 0–200 μM. By a linear fitting, the regression equation for H2O2 was A = 1.464 − 7370[H2O2] (M), where A represents the absorbance of the resulting solution at a given H2O2 concentration added. Thus, this colorimetric method provides a simple, low-cost and convenient assay for H2O2 since the synthesis of MnO2 nanosheets is quite simple and this method does not need expensive instruments and complicated operations.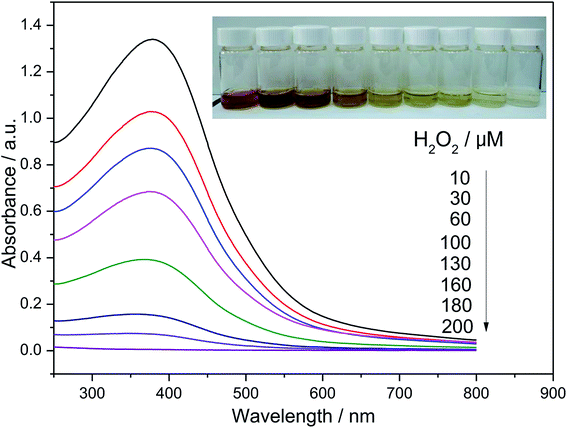 | ||
| Fig. 3 UV-vis absorption spectra of MnO2 solution upon the addition of H2O2 solution with various concentrations. The inset shows the corresponding photographs of the reaction solution. | ||
3.5. Fluorimetric detection of H2O2
The quenching of luminescence in dilute solutions is described by the Stern–Volmer relationship, as shown in the eqn (2).49–51
| F0/F = 1 + KSV[Q] | (2) |
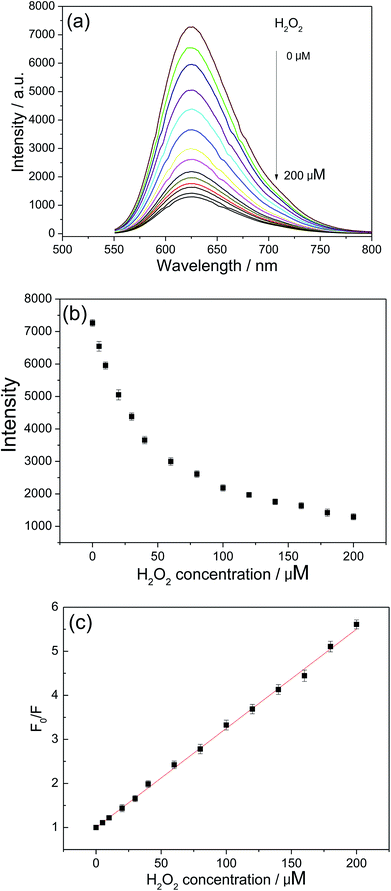
![[thin space (1/6-em)]](https://www.rsc.org/images/entities/char_2009.gif) 520 M−1 based on eqn (2) and the linear regression equation for H2O2 was F0/F = 0.99845 + 22
520 M−1 based on eqn (2) and the linear regression equation for H2O2 was F0/F = 0.99845 + 22![[thin space (1/6-em)]](https://www.rsc.org/images/entities/char_2009.gif) 520[H2O2] (M). The detection limit (LOD) was defined by the equation LOD = (3σ/s) at the signal-to-noise of 3, where σ is the standard deviation of the blank signals (n = 11) and s is the slope of the calibration curve. Based on this equation, the LOD for H2O2 was calculated to be 0.18 μM. The relative standard deviation (RSD) was 4.7% and 3.8% for the determination of 8 μM and 68 μM of H2O2 (n = 6), respectively. The above results indicate high reproducibility and reliability of this method for H2O2 sensing.
520[H2O2] (M). The detection limit (LOD) was defined by the equation LOD = (3σ/s) at the signal-to-noise of 3, where σ is the standard deviation of the blank signals (n = 11) and s is the slope of the calibration curve. Based on this equation, the LOD for H2O2 was calculated to be 0.18 μM. The relative standard deviation (RSD) was 4.7% and 3.8% for the determination of 8 μM and 68 μM of H2O2 (n = 6), respectively. The above results indicate high reproducibility and reliability of this method for H2O2 sensing.
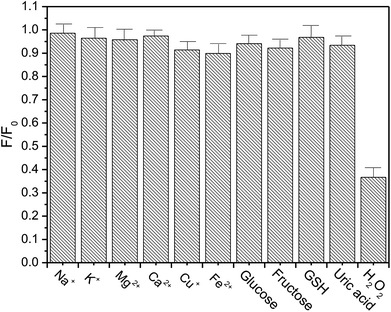
In addition, several common metal ions in biological fluids, such as Na+, K+, Mg2+, Ca2+, Cu+ and Fe2+ were added to examine their influence on sensing properties (Fig. 6). The luminescence of [Ru(dpp)3]Cl2 was almost unaffected by the extra addition of a certain amount of Na+, K+, Mg2+ and Ca2+. Even if several biologically relevant redox active metal ions, such as Cu+ and Fe2+, were introduced into this sensing system, the luminescence shows only a slight change, compared with the case of added H2O2. The above results indicate that the response of our present sensor toward H2O2 is highly selective.
| Sample numbers | Added (μM) | Obtained by our sensor (μM) | Recovery (%) |
|---|---|---|---|
| 1 | 20 | 22.5 | 112.5 |
| 2 | 50 | 48.1 | 96.2 |
| 3 | 100 | 92.5 | 92.5 |
4. Conclusions
2D MnO2 nanosheets were synthesized by a template-free redox route, and the dye [Ru(dpp)3]Cl2 was linked onto the MnO2 nanosheet surface via an electrostatic interaction. The formed MnO2–[Ru(dpp)3]Cl2 hybrid was used for a dual optical detection of H2O2. Upon addition of H2O2, the fading of MnO2 solution enables the colorimetric detection for H2O2 owing to the decomposition of MnO2. Simultaneously, the produced O2 quenches the luminescence of [Ru(dpp)3]Cl2, enabling the fluorescent detection of H2O2. This sensing system responds linearly and quickly in a wide H2O2 concentration range of 0–200 μM, and achieves a detection limit of 0.18 μM and a relative standard deviation lower than 4.7%. The devised dual-readout sensor here could thereby be a reliable option to quantitatively detect H2O2 in biological and environmental samples due to additional signal correction from each other, which validated its efficiency in on-site application.Conflicts of interest
There are no conflicts to declare.Acknowledgements
We acknowledge financial support from the National Science Foundation of China (Grant No. 61178073, 61222508).References
- S. G. Rhee, Science, 2006, 312, 1882–1883 CrossRef PubMed.
- C. C. Winterbourn, Nat. Chem. Biol., 2008, 4, 278–286 CrossRef CAS PubMed.
- M. Schieber and N. S. Chandel, Curr. Biol., 2014, 24, R453–R462 CrossRef CAS PubMed.
- C. X. Li, S. Q. Wang, Y. M. Huang, Q. Wen, L. Wang and Y. H. Kan, Dalton Trans., 2014, 43, 5595–5602 RSC.
- A. R. Lippert, G. C. V. De Bittner and C. J. Chang, Acc. Chem. Res., 2011, 44, 793–804 CrossRef CAS PubMed.
- K. Sinha, J. Das, P. B. Pal and P. C. Sil, Arch. Toxicol., 2013, 87, 1157–1180 CrossRef CAS PubMed.
- J. Xu, J. Zhai, Y. Xu, J. Zhu, Y. Qin and D. Jiang, Analyst, 2016, 141, 2380–2383 RSC.
- L. Zhang, M. Chen, Y. Jiang, M. Chen, Y. Ding and Q. Liu, Sens. Actuators, B, 2017, 239, 28–35 CrossRef CAS.
- Y. Sun, M. Luo, X. Meng, J. Xiang, L. Wang, Q. Ren and S. Guo, Anal. Chem., 2017, 89, 3761–3767 CrossRef CAS PubMed.
- S. Ghosh, P. Roy, N. Karmodak, E. D. Jemmis and G. Mugesh, Angew. Chem., Int. Ed., 2018, 57, 4510–4515 CrossRef CAS PubMed.
- L. Shang, S. J. Dong and G. U. Nienhaus, Nano Today, 2011, 6, 401 CrossRef CAS.
- G. W. Yan, Y. Zhang and W. H. Di, Analyst, 2018, 143, 2915–2922 RSC.
- H. Deng, G. Wu, D. He, H. Peng, A. Liu, X. Xia and W. Chen, Analyst, 2015, 140, 7650–7656 RSC.
- X. Peng, G. Wan, L. Wu, M. Zeng, S. Lin and G. Wang, Sens. Actuators, B, 2018, 257, 166–177 CrossRef CAS.
- X. Zhang, X. Q. Bi, W. H. Di and W. P. Qin, Sens. Actuators, B, 2016, 231, 714–722 CrossRef CAS.
- S. Wiesufer, A. Boddenberg, A. P. Ligon, G. Dallmann, W. V. Turner and S. Gab, Environ. Sci. Pollut. Res., 2002, 4, 41–47 Search PubMed.
- C. Tagad, S. Dugasani, R. Aiyer, S. Park, A. Kulkani and S. Sabharwal, Sens. Actuators, B, 2013, 183, 144–149 CrossRef CAS.
- C. J. Lv, W. H. Di, Z. H. Liu, K. Z. Zheng and W. P. Qin, Analyst, 2014, 139, 4547–4555 RSC.
- X. Y. Shan, L. J. Chai, J. J. Ma, Z. S. Qian, J. R. Chen and H. Feng, Analyst, 2014, 139, 2322–2325 RSC.
- H. Tan, C. Ma, Q. Li, L. Wang, F. Xu, S. Chen and Y. Song, Analyst, 2014, 139, 5516–5522 RSC.
- D. Sodzel, V. Khranovskyy, V. Beni, A. P. F. Turner, R. Viter, M. O. Eriksson, P. Holtz, J. Janot, M. Bechelany, S. Balme, V. Smyntyna, E. Kolesneva, L. Dubovakaya, I. Volotovski, A. Ubelis and R. Yakimova, Microchim. Acta, 2015, 182, 1819–1826 CrossRef CAS.
- H. Wei and E. Wang, Anal. Chem., 2008, 80, 2250–2254 CrossRef CAS PubMed.
- X. Chen, B. Su, Z. Cai, X. Chen and M. Oyama, Sens. Actuators, B, 2014, 201, 286–292 CrossRef CAS.
- Z. C. Xing, J. Q. Tian, A. M. Asiri, A. H. Qusti, A. O. Al-Youbi and X. P. Sun, Biosens. Bioelectron., 2014, 52, 452–457 CrossRef CAS PubMed.
- Y. W. Zhang, J. Q. Tian, S. Liu, L. Wang, X. Y. Qin, W. B. Lu, G. H. Chang, Y. L. Luo, A. M. Asiri, A. O. Al-Youbi and X. P. Sun, Analyst, 2012, 137, 1325–1328 RSC.
- S. Azizi, S. Ghasemi, A. Samadi-Maybodi and M. Ranjbar, Sens. Actuators, B, 2015, 216, 271–278 CrossRef CAS.
- M. Mahmoudian, Y. Alias, W. Basirun, P. Woi and M. Sookhakian, Sens. Actuators, B, 2014, 201, 526–534 CrossRef CAS.
- W. Xiang, G. W. Wang, S. Cao, Q. G. Wang, X. Y. Xiao, T. Li and M. H. Yang, Microchim. Acta, 2018, 185, 335 CrossRef PubMed.
- L. Xu, S. Wei, Q. Diao, P. Ma, X. Liu, Y. Sun, D. Song and X. Wang, Sens. Actuators, B, 2017, 246, 395–401 CrossRef CAS.
- C. Li, J. R. Zhao, Y. Q. Chen, X. Y. Wang, X. B. Sun, W. Pan, G. F. Yu, Z. Yan and J. P. Wang, Analyst, 2018 Search PubMed.
- C. Li, W. Liu, X. Sun, W. Pan and J. Wang, Sens. Actuators, B, 2017, 252, 544–553 CrossRef CAS.
- J. P. Sheng, X. X. Jiang, L. Q. Wang, M. H. Yang and Y. N. Liu, Anal. Chem., 2018, 90, 2926–2932 CrossRef CAS PubMed.
- Y. Li, S. He, Y. Lu and X. Zeng, Org. Biomol. Chem., 2011, 9, 2606–2609 RSC.
- H. Ouyang, X. Tu, Z. Fu, W. Wang, S. Fu, C. Du and Y. Lin, Biosens. Bioelectron., 2018, 106, 43–49 CrossRef CAS PubMed.
- D. Zhao, C. Chen, J. Sun and X. Yang, Analyst, 2016, 141, 3280–3288 RSC.
- C. Chen, D. Zhao, J. Sun and X. Yang, Analyst, 2016, 141, 2581–2587 RSC.
- W. S. Zou, C. H. Ye, Y. Q. Wang, W. H. Li and X. H. Huang, Sens. Actuators, B, 2018, 271, 54–63 CrossRef CAS.
- W. H. Di, X. Zhang and W. P. Qin, Appl. Surf. Sci., 2017, 400, 200–205 CrossRef CAS.
- Z. N. Liu, K. L. Xu, H. Sun and S. Y. Yin, Small, 2015, 11, 2182–2191 CrossRef CAS PubMed.
- G. Zhao, J. Li, L. Jiang, H. Dong, X. Wang and W. Hu, Chem. Sci., 2012, 3, 433–437 RSC.
- S. Shi, C. J. Xu, C. Yang, Y. Y. Chen, J. J. Liu and F. Y. Kang, Sci. Rep., 2013, 3, 2598 CrossRef PubMed.
- L. Z. Wang, Y. Omomo, N. Sakai, K. Fukuda, I. Nakai, Y. Ebina, K. Takada, M. Watanabe and T. Sasaki, Chem. Mater., 2003, 15, 2873–2878 CrossRef CAS.
- L. Peng, X. Peng, B. Liu, C. Wu, Y. Xie and G. Yu, Nano Lett., 2013, 13, 2151–2157 CrossRef CAS PubMed.
- L. Wei, C. Li, H. Chu and Y. Li, Dalton Trans., 2011, 40, 2332–2337 RSC.
- Y. Omomo, T. Sasaki, L. Wang and M. Watanabe, J. Am. Chem. Soc., 2003, 125, 3568–3575 CrossRef CAS PubMed.
- L. Z. Wang, Y. Omomo, N. Sakai, K. Fukuda, I. Nakai, Y. Ebina, K. Takada, M. Watanabe and T. Sasaki, Chem. Mater., 2003, 15, 2873–2878 CrossRef CAS.
- K. Kai, Y. Yoshida, H. Kageyama, G. Saito, T. Ishigaki, Y. Furukawa and J. Kawamata, J. Am. Chem. Soc., 2008, 130, 15938–15943 CrossRef CAS PubMed.
- H. C. Chen, J. W. Tian, W. J. He and Z. J. Guo, J. Am. Chem. Soc., 2015, 137, 1539–1547 CrossRef CAS PubMed.
- D. J. Desilets, P. T. Kissinger and F. E. Lytle, Anal. Chem., 1987, 59, 1830–1834 CrossRef CAS PubMed.
- M. Shamsipur, M. Shanehasz, K. Khajeh, N. Mollania and S. H. Kazemi, Analyst, 2012, 137, 5553–5559 RSC.
- J. B. Xiao, Y. R. Zhao, F. F. Mao, J. Liu, M. X. Wu and X. B. Yu, Analyst, 2012, 137, 195–201 RSC.
| This journal is © The Royal Society of Chemistry 2019 |

