 Open Access Article
Tannic acid-stabilized gold nano-particles are superior to native tannic acid in inducing ROS-dependent mitochondrial apoptosis in colorectal carcinoma cells via the p53/AKT axis†
Sayoni Nag,
Krishnendu Manna and
Krishna Das Saha *
*
Cancer Biology and Inflammatory Disorder Division, CSIR-Indian Institute of Chemical Biology, 4 Raja S.C. Mullick Road, Kolkata-700032, West Bengal, India. E-mail: krishna@iicb.res.in; Fax: +91 33 2473 5197; Tel: +91 33 2499 5810
First published on 11th March 2019
Abstract
Gold nanoparticle formulated tannic acid (AuNP-TA) was synthesized, and its anticancer activity was compared to that of free tannic acid (TA). The half maximal inhibitory concentration (IC50) was reduced by half when cell lines were treated with AuNP-TA as compared to IC50 values upon free TA treatment. Both showed better cytotoxic activity in HCT116 cell line as compared to MCF7 and HepG2. AuNP-TA induced death of HCT116 cells was associated with characteristic apoptotic changes. At the same treatment dose, AuNP-TA generated more ROS, caused a more extensive DNA damage and promoted higher expression of p53 and p21 than TA. Treatment with AuNP-TA regulated generation of p53 and ROS bi-directionally. Binding studies showed that TA lowered the expression of Akt, which inhibited the survival of colon cancer cells. Also, cell cycle arrest at the G2/M phase, enhanced expression of caspase-3/9, Bak, and Bax, loss of mitochondrial membrane potential, and enhanced level of cytosolic cytochrome c were observed in AuNP-TA treated HCT116 cells. Thus, AuNP-TA is more efficient than TA in inducing apoptotic cell death of HCT116 cells via the ROS/P53/Akt axis.
Introduction
Phytochemicals have been used historically to treat cancer because they are safe, readily available and non-toxic.1 However, in spite of their potent anticancer characteristics, they exhibit major disadvantages, such as poor bio-availability and low water solubility.2 Polyphenols are secondary metabolites that act as signaling molecules during growth and development and provide defense against microbe and herbivore attacks. Polyphenols exhibit anticancer activity both in vivo and in vitro.3 Tannic acid (TA), a polyphenol, has also been reported to exert anticancer,4 pro-oxidant,5 antimicrobial6 and antiviral7 effects. It is toxic at high doses and leads to hepatic necrosis. As described in a previous study, a complete uptake of tannic acid via rat gut wall was prevented.8There are reports of polyphenols being modified in the small intestine, colon and liver, where most conjugation occurs.9,10 All these modifications profoundly affect biological activity of polyphenols. As a result, the compounds reaching the cells and tissues are chemically, biologically and functionally different from the original dietary form.11 The field of nanotechnology has overcome many of these limitations. Phytochemicals are more soluble when delivered by nanocarriers and show a better effect on cancer cells as compared to their free form.12
Metal nanoparticles are important because their surface area and the proportion of surface atoms are high.13 The biological effects of GNPs (gold nano-particles) are significant for human health and cosmetics applications.14 In the 18th century, the Egyptians used gold metal, solubilized in water, for the betterment of mental and spiritual health. Even in rural villages, peasants cooked their rice with gold pellets to replace the minerals in the body via intake of food.15 Gold nano conjugated polyphenols are stable, non-agglomerated and biologically active.16 GNPs also exhibit special properties, such as surface plasmon resonance (SPR) and the ability to bind to thiol and amine groups, thus, permitting surface modification and biomedical application.17 The in vivo and in vitro cytotoxic effects of GNPs have been reported in several studies, some of which showed that GNPs exhibit anticancer properties via the induction of oxidative stress by generating reactive oxygen species, ultimately leading to death of the cancerous cells.18
Reactive oxygen species (ROS) is an essential regulator of DNA damage.19 Mutation in p53 gene is the most common mutation in human cancer cells that plays a vital role in the genomic examination. It is needed for the cell cycle arrest because it provides the necessary time for DNA repair. The cell cycle can resume after DNA damage has been repaired. Otherwise, the cells are destructed via apoptosis. p53 mediates cell cycle arrest and apoptosis via its effector p21.20
PI3K (phosphatidylinositol 3-kinase)/AKT (protein kinase B) signaling is often disturbed in human cancers with AKT being a central constituent of the pathway, influencing various processes that are involved in cell survival and tumorigenesis. Targeting AKT is, therefore, an attractive anti-cancer strategy with multiple AKT inhibitors now in use at different stages of clinical development.21 Many anticancer drugs, like tamoxifen and 5-fluorouracil, operate via upregulation of ROS and p53 and downregulation of Akt.22,23
It was stated in previous reports that TA leads to apoptosis via ROS generation in human glioma cells.24 It has been suggested that the combined effect of resveratrol and TA triggers apoptosis in colon cancer cells.25 However, the cellular pathway by which TA alone leads to colon cancer cell death and the role of ROS and signaling cascade of colon cancer cells have not been explored yet. Thus, this study aimed to investigate the enhanced anti-cancer activity of tannic acid in HCT116 cells with the exploration of the ROS-p53-Akt pathway and to compare its anti-cancer efficacy with that of tannic acid-stabilized gold nanoparticles.
Materials and methods
Chemicals
Tetrachloroauric acid (HAuCl4), TA, propidium iodide (PI), caspase-3 and caspase-9 activity assay kit were bought from Sigma Aldrich (USA). 3-(4,5-Dimethylthiazol-2-yl)-2,5-diphenyltetrazolium bromide (MTT), Annexin-V/FITC kits and rhodamine 123 were obtained from Calbiochem. All cell lines were bought from National Centre For Cell Science (NCCS), Pune, Govt. of India. Fetal bovine serum, Dulbecco's Modified Eagle Medium, Pen-strep (penicillin and streptomycin) antibiotic, and trypsin were obtained from Gibco BRL (Grand Island, USA). Cell culture plastic wares were obtained from NUNC (Denmark) and protein assay reagent, BCA, was purchased from Pierce. DAPI (4′,6-diamidino-2-phenylindole dihydrochloride), acridine orange (AO), and ethidium bromide (EtBr) were supplied by Invitrogen (California). All primary and secondary antibodies were purchased from Cell Signaling Technology (CST). All other reagents were bought from Sigma-Aldrich Company, USA.Preparation of AuNP-TA
Reduction of Au3+ ions to Au0 was performed by heating the solution of 20 ml of 0.25 mM TA at 45 °C for 15 min and adding 100 μl of 30 mM HAuCl4 dropwise. A deep pink solution was obtained within 10 min. The solution was stirred on a magnetic stirrer for 1 h without heating. AuNP-TA nanoparticles were centrifuged at 14![[thin space (1/6-em)]](https://www.rsc.org/images/entities/char_2009.gif) 000 rpm for 30 min to remove any unconjugated TA that remained in the supernatant. The amount of unbound free TA in the supernatant was determined to be 0.642 μM by monitoring the UV absorption at 250 nm using the extinction coefficient of ε = 27
000 rpm for 30 min to remove any unconjugated TA that remained in the supernatant. The amount of unbound free TA in the supernatant was determined to be 0.642 μM by monitoring the UV absorption at 250 nm using the extinction coefficient of ε = 27![[thin space (1/6-em)]](https://www.rsc.org/images/entities/char_2009.gif) 200 M−1 cm−1. Thus, the final concentration of conjugated TA on AuNP was 0.2482 mM. The amount of unbound free AuNP in the supernatant was determined to be 1.134 μM by monitoring the UV-Vis absorption at 450 nm using the extinction coefficient of ε = 72
200 M−1 cm−1. Thus, the final concentration of conjugated TA on AuNP was 0.2482 mM. The amount of unbound free AuNP in the supernatant was determined to be 1.134 μM by monitoring the UV-Vis absorption at 450 nm using the extinction coefficient of ε = 72![[thin space (1/6-em)]](https://www.rsc.org/images/entities/char_2009.gif) 246.8 M−1 cm−1. Thus, the final concentration of AuNP was 29.739 mM.
246.8 M−1 cm−1. Thus, the final concentration of AuNP was 29.739 mM.
Next, the obtained pellet was washed with double distilled de-ionized water and suspended in 1 ml of PBS before administration to cells.
Characterization of AuNP-TA
AuNP-TA was characterized using techniques like UV absorbance, DLS, AFM, and FTIR according to the standard protocol.Cell culture
HepG2 (human hepatocellular carcinoma), MCF-7 (human breast cancer), and HCT 116 (human colorectal carcinoma) cells were cultured in DMEM, supplemented with 10% fetal bovine serum (FBS) and 1% pen-strep at 37 °C in a humidified environment under 5% CO2. After 60–80% confluency, cells were collected using 0.05% trypsin and 0.50 mM EDTA in phosphate buffered saline (PBS, pH = 7.4) and seeded at a necessary density to allow them to grow well for a day before performing the experimentation.MTT assay
MTT assay was performed to determine cell viability. The cells (1 × 10⁵ per well) were seeded in 96 well plates and treated with different concentrations of TA and AuNP-TA for 24 h. Four hours after adding MTT, the generated purple formazan was solubilized in DMSO, and the absorbance was measured at 595 nm using an ELISA (enzyme-linked immune sorbent assay) reader.Fluorescence microscopy
For detecting the damage to nuclear or chromatin condensation, untreated and treated cells (3 × 10⁴ per well) were stained with 10 μg ml−1 DAPI. Cells were also stained with AO/EB to distinguish the live, apoptotic and necrotic ones and observed under a fluorescence microscope (Olympus, Tokyo, Japan). Images were obtained at excitation and emission wavelengths of 488 and 550 nm.Quantification of apoptosis using Annexin-V
Apoptosis was detected using an Annexin-V FITC apoptosis detection kit. Cells were treated with or without AuNP-TA and then washed and stained with PI and Annexin-V-FITC according to the instructions in the kit. The percentage of live, apoptotic and necrotic cells was determined using flow cytometry (Beckton Dickinson, San Jose, CA, USA).Measurement of ROS generation
ROS generation was measured using H2DCF-DA. After treatment with or without AuNP-TA in a time-dependent manner, the cells were incubated with 10 mM H2DCF-DA for 20 min at room temperature. The intracellular reactive oxygen species (ROS) causes oxidation of H2DCF-DA to 2′,7′-dichlorofluorescein (DCF), a fluorescent compound. Cell pellets were suspended in 500 μl PBS, and samples were analyzed at excitation and emission wavelengths of 480 nm and 525 nm using a spectrofluorometer and a flow cytometer (Becton Dickinson, San Jose, CA, USA).Cell death detection assay
Quantification of histone-associated DNA fragments (mono- and oligo-nucleosomes) in the cytoplasm after inducing cell death with TA and AuNP-TA was performed using ELISA kit (Sigma-Aldrich, St. Louis, USA) according to the manufacturer instructions.Cell cycle analysis
After treatment with TA and AuNP-TA, cells were pelleted and fixed overnight in 70% ethanol at 4 °C. Next day the cells were pelleted and suspended in PBS containing 25 μg ml−1 RNase and Triton X-100 (0.5%) and incubated for 1 h at 37 °C. Next, they were stained with 50 μg ml−1 PI at 4 °C for 15 min and analysed using flow cytometry. A total of 1 × 10⁴ cells were counted.Caspase activity assay
Levels of active caspases were assayed using colorimetric assay kits (Calbiochem) following the instructions on the kit.Western blot analysis
The cell lysate proteins were separated using 12% SDS-PAGE (sodium dodecyl sulfate-polyacrylamide gel electrophoresis) and transferred to PVDF (polyvinylidene fluoride) membranes (Millipore, Bedford, MA) using standard electroblotting techniques.Confocal microscopy
The effect of TA and AuNP-TA on levels of p53 and p21 expression in cells was examined employing immunocytochemical analysis using standard techniques and evaluated under Olympus FV10i automated laser scanning confocal microscope.Measurement of mitochondrial membrane potential
In order to measure the mitochondrial membrane potential, the treated or untreated cells were washed and incubated with rhodamine 123 (5 μg ml−1). Emission at 535 nm was measured using a spectrofluorometer (LS50B; Perkin Elmer).Protein expression determination via flow cytometry
To analyse protein expression, cells were fixed with 4% paraformaldehyde for 15 min, perforated with 0.05% Triton-X for 10 min and centrifuged. The cell pellet was washed with PBS, labeled with primary and fluorochrome-conjugated secondary antibodies and analyzed using a flow cytometer.Docking studies
The SwissDock online based server was used for performing docking studies of our compound and other proteins.Statistical analysis
All values are expressed here as mean ± SD. Statistical significance was calculated between control and treatment groups using one-way analysis of variance (ANOVA). Data were considered to be statistically significant when P values were found to be <0.01.Results
AuNP-TA characterization
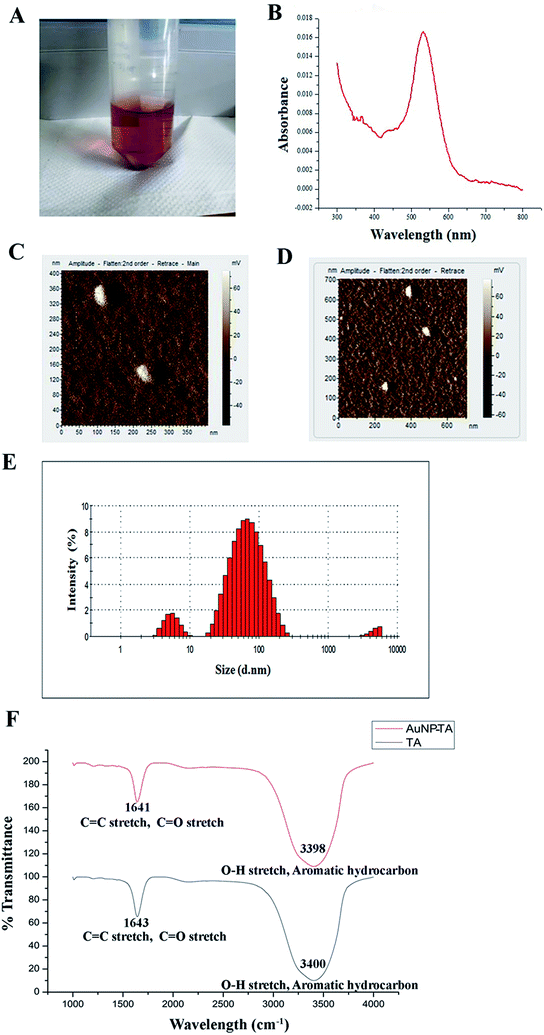
AuNP-TA exhibited a characteristic rose pink color (Fig. 1A). The presence of the surface plasmon resonance band of AuNP-TA at ∼537 nm confirmed26 its identity (Fig. 1B). As determined by atomic force microscopy measurements, the surface topology of AuNP-TA particles was uniform; they had a spherical shape with size ranging between 60–80 nm (Fig. 1C and D). The size of AuNP-TA particles, obtained from the differential light scattering study, ranged between 68.06–78.82 nm (Fig. 1E).FTIR analysis of free TA and AuNP-TA was performed to analyse the involvement of various functional groups. A broad peak was seen at 3400 cm−1 for TA and 3398 cm−1 for AuNP-TA, attributed to O–H bond stretching and consistent with the presence of alcoholic and phenolic compounds. One more peak at 1643 cm−1 for TA and 1641 cm−1 for AuNP-TA indicated the presence of amide (C![[double bond, length as m-dash]](https://www.rsc.org/images/entities/char_e001.gif) O) and alkene (C
O) and alkene (C![[double bond, length as m-dash]](https://www.rsc.org/images/entities/char_e001.gif) C) groups. Smaller peaks, detected at 1209 cm−1 for TA and 1211 cm−1 for AuNP-TA, confirmed the presence of esters. A major difference was observed between the two peaks at 3398 cm−1 and 1641 cm−1 for AuNP-TA (Fig. 1F), indicating the role of C
C) groups. Smaller peaks, detected at 1209 cm−1 for TA and 1211 cm−1 for AuNP-TA, confirmed the presence of esters. A major difference was observed between the two peaks at 3398 cm−1 and 1641 cm−1 for AuNP-TA (Fig. 1F), indicating the role of C![[double bond, length as m-dash]](https://www.rsc.org/images/entities/char_e001.gif) O and O–H bonds in the reduction of Au(III) ions to Au atoms.27
O and O–H bonds in the reduction of Au(III) ions to Au atoms.27
Effect of TA and AuNP-TA on the growth of cancer cells
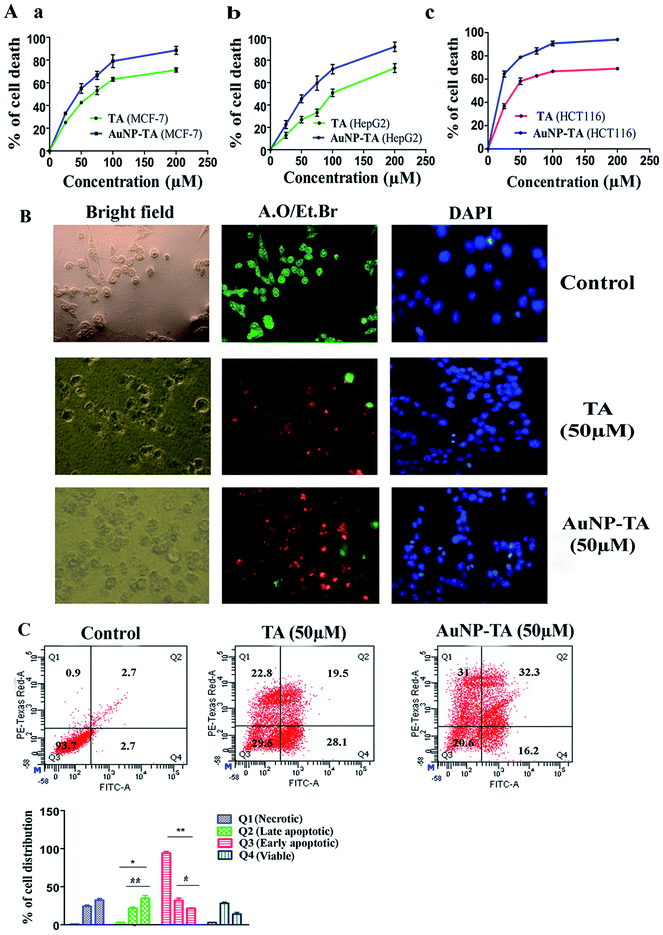
Treatment with TA and AuNP-TA, ranging in concentration from 0 to 200 μM, of three human cancer cell lines, MCF-7, HCT116, and HepG2, for 24 h showed different degrees of cell death, as shown in Fig. 2A(a–c). For comparison with free TA, we used the same dose of AuNP-TA. Both showed higher cytotoxicity in HCT116 cells (IC50 values of 48.37 ± 3.24 μM and 23.21 ± 2.45 μM) than in HepG2 cells (IC50 of 105.5 ± 5.6 μM and 57.6 ± 3.1 μM) or MCF-7 (IC50 of 72.35 ± 3.7 μM and 39.25 ± 2.6 μM). Hence, we have conducted further studies in HCT116 cell line using 50 μM dose of AuNP-TA (the concentration of TA on AuNP), the dose which resulted in optimum cell death.TA and AuNP-TA-induced apoptosis and enhanced Annexin V positive cells
AuNP-TA treated HCT116 cells were studied to determine the mechanism of cell death. Apoptosis is often desired for the death of cancer cells.28 Cells, treated with 50 μM TA or AuNP-TA for 24 h, showed characteristic features of apoptosis-like rounding and shrinking under a light microscope.28 Fluorescence microscopy study of treated HCT cells using DAPI staining showed intact blue nuclei in the control group and brighter fragmented nuclei in the treated cells. Use of AO/EtBr for staining revealed the presence of whole green nuclei in the control group cells but greenish yellow, orange and reddish fragmented nuclei in treated cells.29 The effect of apoptosis was more profound when cells were treated with AuNP-TA rather than with TA (Fig. 2B).At the beginning stage of apoptosis, phosphatidylserine is exposed from the inner to the outer membrane. The content of phosphatidylserine in the outer membrane of HCT116 cells, following treatment with 50 μM of TA or AuNP-TA for 24 h, was assessed by flow cytometric analysis using Annexin-V/FITC.30 It was determined that the percentage of viable cells was lowered by 64.1% and 73.1%, respectively, while the total number of apoptotic cells increased by 25.4% and 13.5%, respectively, in LR (early apoptotic quadrant) and by 16.8% and 30.6% in UR (late apoptotic quadrant). This study, therefore, confirmed that both TA and AuNP-TA-induced apoptosis in HCT116 cells, but AuNP-TA increased the percentage of cells in UR more by 13.8% as compared to TA at the same dose (Fig. 2C).
AuNP-TA treatment promotes enhanced ROS generation and ROS dependent cell death
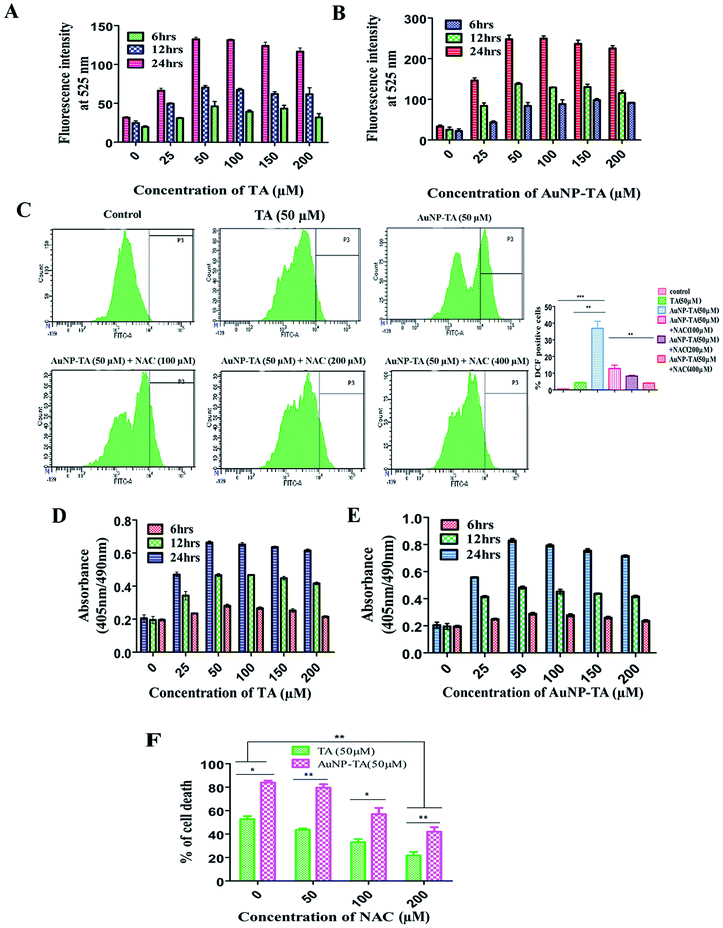
Previous reports suggested that polyphenols can kill cancer cells by inducing ROS generation.31 Also, gold nanoparticle treated carcinoma cells displayed an increased generation of ROS, ultimately leading to the death of cancerous cells.18 After treatment of HCT116 cells with different concentrations of TA and AuNP-TA (0–200 μM) at different time points (6, 12 and 24 h) and measuring ROS generation using a spectrofluorimeter, it was observed that ROS generation in HCT116 cells increased with dose and time. Also, around 1.9 times higher ROS generation was observed when cells were treated with 50 μM of AuNP-TA rather than TA (Fig. 3A and B).ROS generation, which can lead to cancer cell death via apoptosis,32 was studied next in HCT116 cells using the ROS inhibitor NAC (N-acetyl-L-cysteine).33 We found that at 24 h, it increased by 9 and 67.8 times as compared to control when cells were treated with 50 μM of TA and 50 μM of AuNP-TA. But pre-treatment with 100, 200, or 400 μM of NAC gradually lowered the level of ROS generation, induced by AuNP-TA, by 3.0, 4.29 and 8.69 fold, respectively (Fig. 3C). Also, the percentage of dead HCT116 cells after the 50 μM AuNP-TA treatment decreased by 33.8% and 47.4% after pre-treatment with 100 and 200 μM NAC, respectively (Fig. 3F).
TA and AuNP-TA cause ROS dependent DNA damage in HCT116 cells
ROS are capable of inducing DNA damage in cells.34,35 After the treatment of HCT116 cells with different concentrations of TA and AuNP-TA (0–200 μM) at different time points (6, 12 and 24 h), DNA fragmentation was measured using a spectrofluorimeter to find that it increased with dose and time. O.D. of untreated cells was 0.212, but 0.660 for 50 μM TA and 0.993 for 50 μM AuNP-TA treated HCT116 cells after 24 h. These values decreased by 1.766-fold and 2.56-fold when cells were treated with 100 and 200 μM NAC before the treatment with 50 μM AuNP-TA, showing that the increase in ROS generation leads to increased DNA damage, which was decreased upon inhibition of ROS production by NAC (Fig. 3D and E).TA and AuNP-TA-induced DNA damage leads to p53 and p21 upregulation and translocation to the nucleus
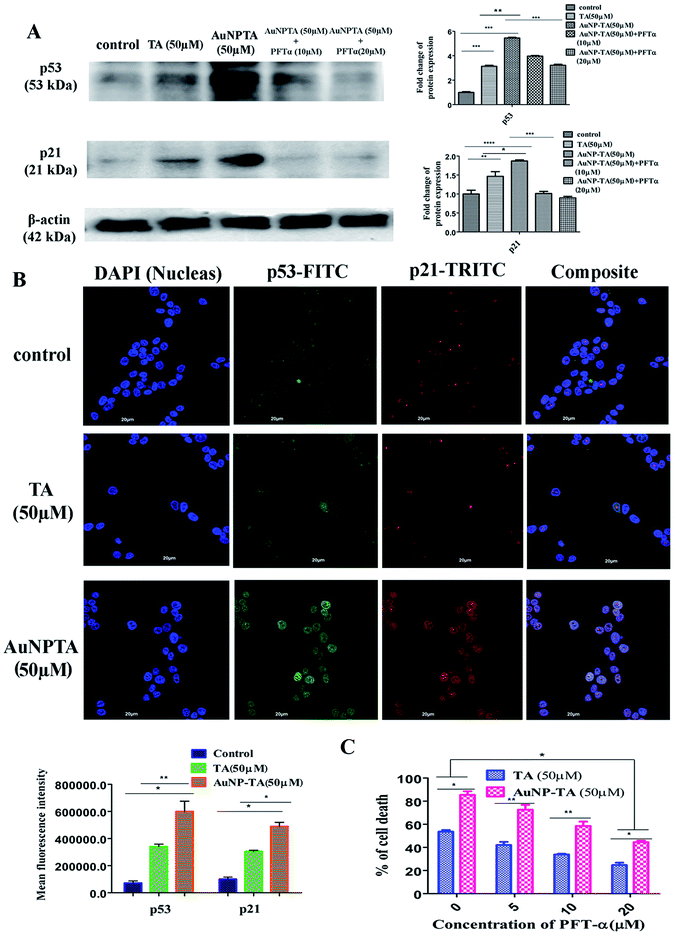
DNA damage caused by ROS leads to activation of p53.36,37 The increased capability of p53 to bind DNA mediates transcriptional activation of many downstream genes, most importantly, p21, whose products trigger cell-cycle arrest.38 As expected, western blot results indicated a higher expression of p53 and p21 when cells were treated with 50 μM AuNP-TA rather than 50 μM TA. AuNP-TA induced higher expression levels of p53 and its downstream product p21. When cells were treated with p53 inhibitor pifithrin-α,39 the expression levels of p53 and its downstream product p21 decreased (Fig. 4A).P53 synthesis occurs in the cytoplasm, and it is transported into the nucleus to activate transcription of downstream targets after its exposure to cellular stress.40,41 Also, p21 enters the nucleus to affect downstream cell cycle arrest. In case of cells, co-incubated with primary p53 and p21 antibodies and developed with FITC and TRITC labeled secondary antibodies, respectively, co-translocation in the nuclei was observed for both proteins in 50 μM TA and 50 μM AuNP-TA treated cells; in the untreated cells, p53 and p21 were found mainly in the cytoplasm. However, more profound co-localization of p53 and p21 proteins was observed in cells, treated with AuNP-TA rather than TA (Fig. 4B).
As revealed by MTT assay, the percentage of dead AuNP-TA treated HCT116 cells was found to decrease by 33.8 and 45.4% after treatment with 10 and 20 μM PFT-α, respectively, before the 50 μM AuNP-TA treatment (Fig. 4C).
TA and AuNP-TA induced ROS generation and p53 upregulation affect each other bi-directionally
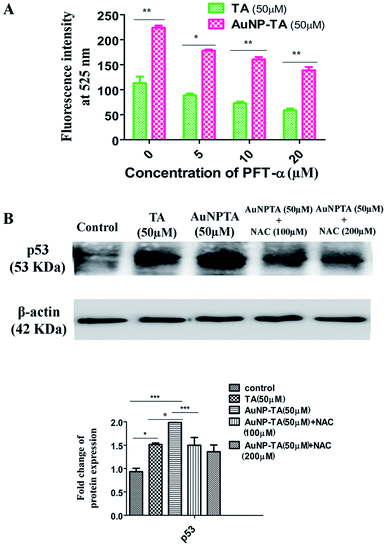
Next, we wanted to determine whether p53 also controlled ROS generation42 or just ROS controls p53 when HCT116 cells were treated with AuNP-TA. Spectrofluorimetry measurements showed decreased ROS generation when HCT116 cells were pre-treated with 10 and 20 μM pifithrin-α, followed by treatment with 50 μM AuNP-TA, as compared to ROS generation when HCT116 cells were treated with 50 μM AuNP-TA (Fig. 5A). Western blot data showed a decrease in p53 expression in cells treated with 50 μM AuNP-TA when they were pre-treated with 100 and 200 μM of NAC (Fig. 5B).TA and AuNP-TA cause G2/M cell cycle arrest in HCT116 cells
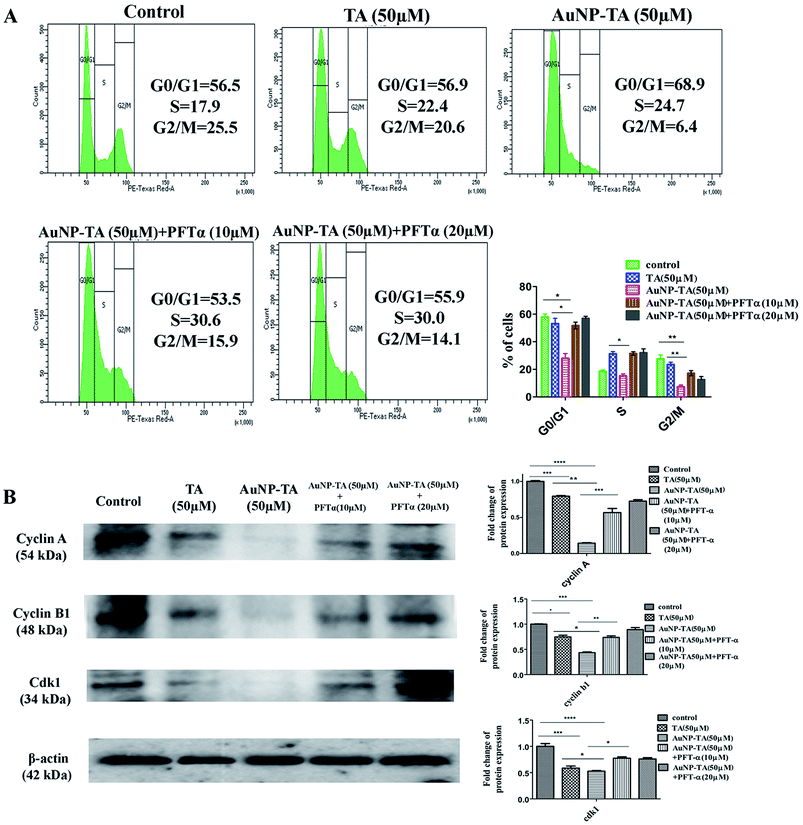
To determine ROS mediated cell cycle arrest,43,44 we have tested the cell cycle status after treating cells with 50 μM TA or 50 μM AuNP-TA, and cells pre-treated with 10 and 20 μM PFT-α also with 50 μM AuNP-TA. G2/M cell cycle arrest occurred after TA and AuNP-TA treatment as the proportion of cells in G2/M phase decreased by 4.9% for TA and 19.1% for AuNP-TA groups but increased by 8.8% and 10.6% in cells, pre-treated with 10 and 20 μM PFT-α (Fig. 6A).Protein p53 regulates expression of cyclins, controlling the cell cycle.45,46 Expression levels of cyclin A, cyclin B1, and CDK1 (Cyclin-Dependent Kinase) decreased, the extent being more pronounced when cells were treated with 50 μM of AuNP-TA and not TA. But there was an increase in the expression levels when cells were pre-treated with 10 or 20 μM of pifithrin-α (Fig. 6B).
TA binds to AKT, and TA, AuNP-TA regulate AKT expression levels
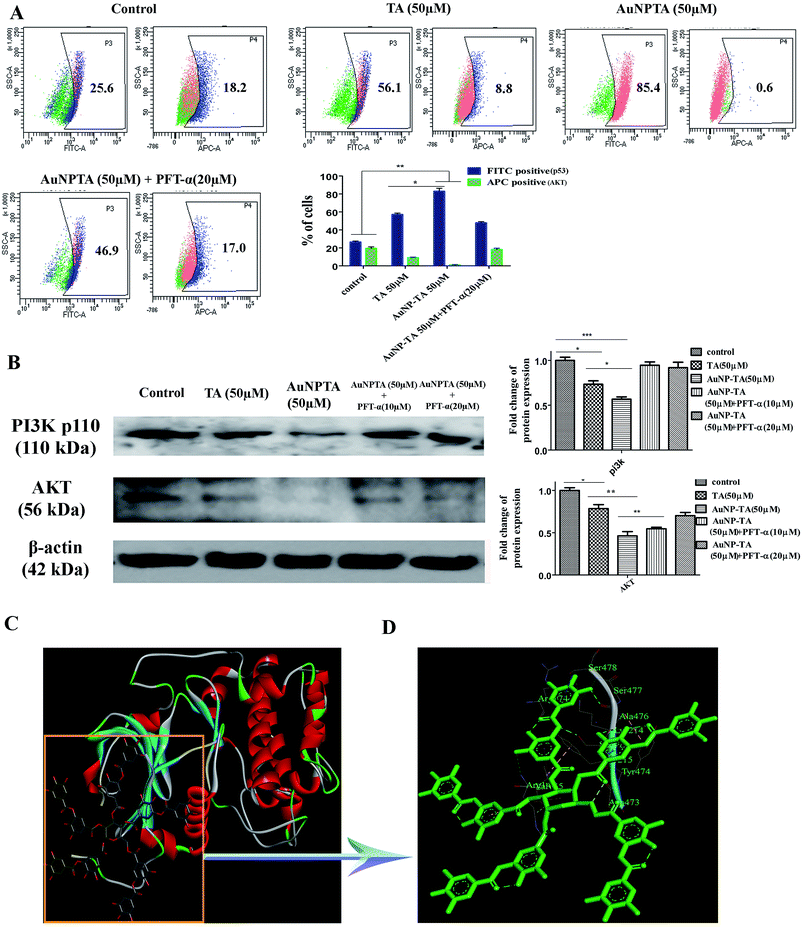
PI3K/Akt mediates negative control of p53 expression level by targeting p53 for proteasomal degradation.47 In our case, the flow cytometry data showed that p53 expression increased after treatment with 50 μM TA, but Akt levels decreased. The levels decreased further upon treatment with 50 μM AuNP-TA. Pre-treatment of HCT cells with PFT-α before treatment with 50 μM AuNP-TA decreased the levels of p53 and increased the levels of Akt as compared to treatment with 50 μM AuNP-TA (Fig. 7A). Also, as demonstrated by western blot analysis, PI3K and Akt levels decreased upon treatment with 50 μM AuNP-TA but increased when PFT-α was used (Fig. 7B).As it has not been previously studied, we intended to analyse the interaction of Akt with TA on atomic level, and, hence, we searched Protein Databank (PDB) (http://www.rcsb.org/pdb) for suitable crystal structures (Fig. 7C). The residue interactions across TA–Akt interface are pictorially represented. The protein–protein interactions of TA–Akt had been analyzed, and the atom–atom interactions across the interface showed that TA interacts with S478, S477, K214, and R74 residues of Akt via hydrogen bonding. To explore the strength of interaction between the ligand and complex, the binding free energy (ΔGbind) was calculated using MM-GBSA method. Negative ΔG values showed a higher binding affinity between TA and Akt (Fig. 7D).
TA and AuNP-TA induced cell death in HCT116 cells follows the mitochondrial pathway of apoptosis
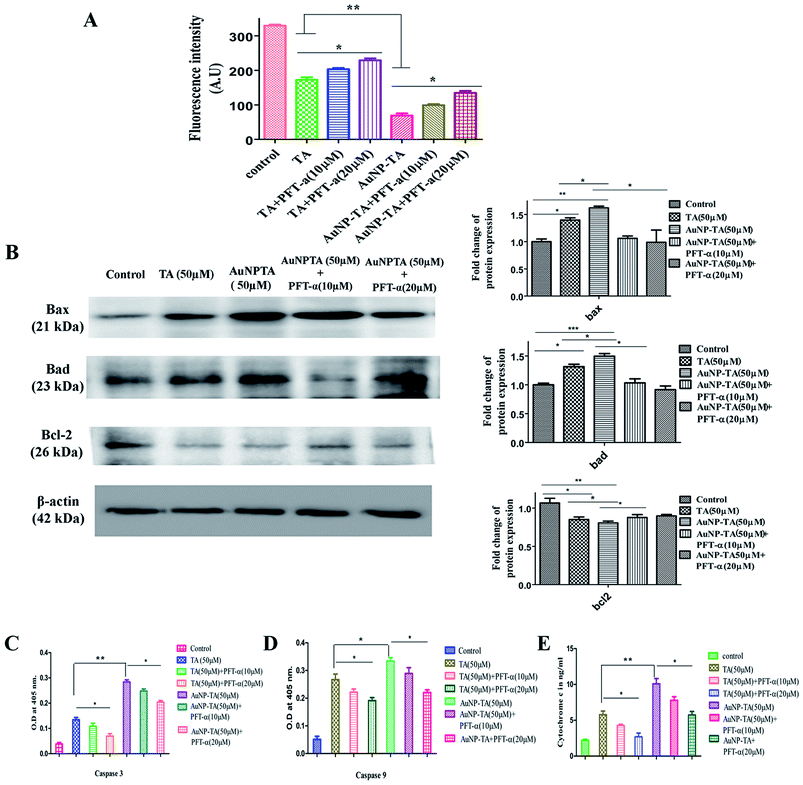
Cellular apoptosis follows intrinsic (mitochondrial) or extrinsic pathway and sometimes both.48 Mitochondrial membrane potential was lowered (Fig. 8A) and cytosolic cytochrome c level was raised (Fig. 8E) 24 h after the addition of 50 μM of TA and AuNP-TA. When HCT116 cells were pre-treated with PFT-α, mitochondrial potential increased and cytochrome c levels decreased as compared to those upon treatment with 50 μM of AuNP-TA alone.To test the presence of mitochondrial pathway, levels of caspase-9 and caspase-3, pro-apoptotic Bax and Bad, and anti-apoptotic Bcl-2 were measured, and the mitochondrial membrane potential was determined. Treatment with 50 μM TA and 50 μM AuNP-TA for 24 h significantly increased the levels of caspase-9 (Fig. 8C) and caspase-3 (Fig. 8D) and raised the levels of Bax and Bad; these were, however, reduced upon treatment with 10 μM or 20 μM PFT-α. Also, the Bcl2 level, which was lowered upon treatment with TA and AuNP-TA, was increased when cells were treated with PFT-α (Fig. 8B).
Discussion
We consume tannic acid while eating grapes, pomegranates, and cereals. There are previous reports of tannic acid preventing breast cancer,49,50 ovarian cancer,51 gingival cancer52 and brain cancer.24 However, the exact mechanism or pathway by which tannic acid kills colon cancer cells was not fully understood.In the present study, during a screening of TA against different cancer cell lines for cytotoxicity, a strong effect was noted in colorectal carcinoma cells with an IC50 of 48.37 μM. To reduce the IC50 dose value and, possibly, increase efficiency, AuNP-TA was synthesized. Indeed, the IC50 value of TA in HCT116 cells was reduced to half when AuNP-TA was used. Also, following treatment with AuNP-TA of colon cancer cells (HCT116), blebbing of the membrane, chromosome condensation and fragmentation of DNA (hallmarks of apoptosis) were observed via A.O./EtBr and DAPI staining and confirmed via Annexin V/PI staining.
TA and AuNP-TA-induced apoptosis proved to be ROS-dependent because an increase in the concentration of TA and AuNP-TA and time caused a significant increase in the production of ROS, while pre-treatment with NAC increased HCT116 cell viability. More ROS were generated upon treatment with AuNP-TA as compared to treatment with TA at the same concentration. This led to DNA damage, which was decreased when NAC was used. The TA or AuNP-TA induced DNA damage of HCT116 cells led to increased expression of p53 and of the downstream effector gene p21. Confocal microscopy revealed that overexpressed p53 and p21 were co-localized in the nucleus. Increased p53 expression caused cell death, and the percentage of dead cells decreased when HCT116 cells were pre-treated with pifithrin-α. Induced DNA damage and p53/p21 expression were higher upon treatment with AuNP-TA as compared to those upon treatment with TA at the same concentration. It was also determined that ROS and p53 regulated each other bi-directionally. p21 inhibited the kinase activity of cyclin A, cyclin B, and CDK1, which controlled the G2/M transition, thereby, leading to cell cycle arrest.
From flow-cytometry data, it was found that ROS-induced increase in p53 expression was accompanied by a simultaneous decrease in Akt expression. Thus, TA may directly interact with Akt protein, and this inhibition of Akt may lead to p53 up-regulation. So we performed docking studies to find out if TA interacted with the Akt protein. These studies revealed that TA interacted with various residues of Akt, and the derived negative Gibbs free energy indicated a high binding affinity between TA and Akt. Lowered expression of Akt also inhibited the survival of colon cancer cells.
Induction of apoptosis by TA and AuNP-TA in HCT116 cells was further confirmed by activation of caspase 3, caspase 9, and pro-apoptotic Bax and Bad; pre-treatment with p53 inhibitor decreased the activation. At 50 μM dosage of TA and AuNP-TA, the appearance of caspases and pro-apoptotic proteins was more by AuNP-TA treatment as compared to treatment with TA. Anti-apoptotic Bcl-2 showed decreased expression upon treatment with AuNP-TA as compared to TA, but the expression increased when the p53 inhibitor was used. Loss of mitochondrial membrane potential (MMP) was more pronounced when treatment was done with AuNP-TA as compared to TA, but pre-treatment with PFT-α led to a gain in membrane potential.
Another factor which seems to contribute to better anticancer activity of AuNP-TA is its improved stability. AuNP-TA solution was stable for 50 days after its preparation, confirmed by UV-Vis absorption spectroscopy measurements (Fig. S1†). Also, toxicity study conducted on a normal cell line (human epithelial kidney cell line, HEK 293) showed that 50% of cells were dead at 16.67 ± 3.24 μM dose of tannic acid but 80.45 ± 4.62 μM dose of AuNP-TA. Therefore, AuNP-TA was much less toxic to normal cells than TA.
Drug release kinetics also show a more sustained release of AuNP-TA as compared to that of TA (Fig. S2†). Sustained release of AuNP-TA can also contribute to its better anticancer activity as compared to TA. Therefore, AuNP-TA was superior to TA in many respects.
Conclusion
The results of this study suggest that TA leads to apoptosis in HCT116 cells via the ROS/p53/Akt axis, though it is much less potent than AuNP-TA. It is, however, necessary to undertake further studies to explore the function of AuNP-TA in various in vivo cancer models to help with development of a novel treatment for cancer that would lead to effective colon cancer cell death.Conflict of interest
The authors have no conflict of interest.Acknowledgements
The research is supported by the CSIR, Government of India. A research fellowship from UGC-SRF, Govt. of India to Mrs Sayoni Nag is gratefully acknowledged. The authors gratefully acknowledge Mr Tanmoy Dalui, Sri. Binayak Pal and Smt. Banasri Das of Central Instrumentation Facility, CSIR-Indian Institute of Chemical Biology for providing flow cytometry and confocal microscopy facilities. The authors are very grateful to National Medicinal Plant Board (NMPB), Department of Biotechnology (DBT), and Department of Science & Technology (DST), Government of India for partial funding support. We are also extremely grateful to Dr Basudeb Achari, ex-senior scientist, CSIR-IICB for necessary English corrections.References
- P. Pratheeshkumar, C. Sreekala, Z. Zhang, A. Budhraja, S. Ding and Y.-O. Son, et al., Adv. Anticancer Agents Med. Chem., 2012, 12(10), 1159–1184 CrossRef CAS.
- M. Rizwanullah, S. Amin and J. Ahmad, J. Drug Targeting, 2017, 25, 58–74 CrossRef CAS PubMed.
- M. Fantini, M. Benvenuto, L. Masuelli, G. V. Frajese, I. Tresoldi and A. Modesti, et al., Int. J. Mol. Sci., 2015, 16, 9236–9282 CrossRef CAS PubMed.
- C. J. Bridgeman, T. U. Nguyen and V. Kishore, J. Biomater. Sci., Polym. Ed., 2018, 29(4), 412–427 CrossRef CAS PubMed.
- İ. Gülçin, Z. Huyut, M. Elmastaş and H. Y. Aboul-Enein, Arabian J. Chem., 2010, 3(1), 43–53 CrossRef.
- G. Dong, H. Liu, X. Yu, X. Zhang, H. Lu and T. Zhou, et al., Nat. Prod. Res., 2018, 32(18), 2225–2228 CrossRef CAS PubMed.
- P. Orlowski, E. Tomaszewska, M. Gniadek, P. Baska, J. Nowakowska, J. Sokolowska, Z. Nowak, M. Donten, G. Celichowski, J. Grobelny and M. Krzyzowska, PLoS One, 2014, 9, e104113 CrossRef PubMed.
- M. Carbonaro, G. Grant and A. Pusztai, Eur. J. Clin. Nutr., 2001, 40(2), 84–90 CrossRef CAS.
- K. B. Pandey and S. I. Rizvi, Oxid. Med. Cell. Longevity, 2009, 2, 270–278 CrossRef PubMed.
- L. Marín, E. M. Miguélez, C. J. Villar and F. Lombó, Biomed Res. Int., 2015, 2015, 905215 Search PubMed.
- M. D'Archivio, C. Filesi, R. Varì, B. Scazzocchio and R. Masella, Int. J. Mol. Sci., 2010, 11, 1321–1342 CrossRef PubMed.
- A. P. Subramanian, S. K. Jaganathan, A. Manikandan, K. N. Pandiaraj, N. Gomathi and E. Supriyanto, RSC Adv., 2016, 6, 48294–48314 RSC.
- M. R. Kamala Priya and P. R. J. A. N. Iyer, Int. J. Pharmacol. Res., 2015, 5, 443–448 CAS.
- P. Kuppusamy, M. M. Yusoff, G. P. Maniam and N. Govindan, Saudi Pharm. J., 2016, 24, 473–484 CrossRef PubMed.
- F. K. Alanazi, A. A. Radwan and I. A. Alsarra, Saudi Pharm. J., 2010, 18, 179–193 CrossRef CAS PubMed.
- M. Sengani, A. M. Grumezescu and V. D. Rajeswari, OpenNano, 2017, 2, 37–46 CrossRef.
- A. Kumar, B. Mazinder Boruah and X.-J. Liang, J. Nanomater., 2011, 2011, 17 Search PubMed.
- A. A. Dayem, M. K. Hossain, S. B. Lee, K. Kim, S. K. Saha and G. M. Yang, et al., Int. J. Mol. Sci., 2017, 18(1), 1–21 Search PubMed.
- G. Waris and H. Ahsan, J. Carcinog., 2006, 5, 14 CrossRef PubMed.
- N. S. Pellegata, R. J. Antoniono, J. L. Redpath and E. J. Stanbridge, Proc. Natl. Acad. Sci., 1996, 93(26), 15209–15214 CrossRef CAS.
- J. S. Brown and U. Banerji, Pharmacol. Ther., 2017, 172, 101–115 CrossRef CAS PubMed.
- L.-F. Shyur, C.-H. Chen, C.-P. Lo, S.-Y. Wang, P.-L. Kang and S.-J. Sun, et al., J. Biomed. Sci., 2004, 11(6), 928–939 CAS.
- H. Liu, X. Liu, C. Zhang, H. Zhu, Q. Xu and Y. Bu, et al., J. Cancer, 2017, 8, 1586–1597 CrossRef PubMed.
- J. Zhang, D. Chen, D. Han, Y. Cheng, C. Dai and X. Wu, et al., Oncol. Lett., 2018, 17, 6845–6850 Search PubMed.
- D. Cosan, A. Soyocak, A. Basaran, I. Degirmenci and H. V. Gunes, Saudi Med. J., 2009 Feb 7, 30(2), 191–195 Search PubMed.
- X. Huang and M. A. El-Sayed, J. Adv. Res., 2010, 1, 13–28 CrossRef.
- T. Jurkin, M. Guliš, G. Dražić and M. Gotić, Gold Bull., 2016, 49(1–2), 21–33 CrossRef CAS.
- R. S. Y. Wong, J. Exp. Clin. Cancer Res., 2011, 30(1), 87 CrossRef CAS PubMed.
- X. Wu, Med. Sci. Monit. Basic Res., 2015, 21, 15–20 CrossRef PubMed.
- S. H. Lee, X. W. Meng, K. S. Flatten, D. A. Loegering and S. H. Kaufmann, Cell Death Differ., 2013, 20(1), 64–76 CrossRef CAS PubMed.
- A. J. León-González, C. Auger and V. B. Schini-Kerth, Biochem. Pharmacol., 2015, 98(3), 371–380 CrossRef PubMed.
- F. Thayyullathil, S. Chathoth, A. Hago, M. Patel and S. Galadari, Free Radical Biol. Med., 2008, 45(10), 1403–1412 CrossRef CAS PubMed.
- M. Halasi, M. Wang, T. S. Chavan, V. Gaponenko, N. Hay and A. L. Gartel, Biochem. J., 2013, 454(2), 201–208 CrossRef CAS PubMed.
- J. E. Klaunig, Z. Wang, X. Pu and S. Zhou, Toxicol. Appl. Pharmacol., 2011, 254(2), 86–99 CrossRef CAS PubMed.
- J. E. Klaunig, L. M. Kamendulis and B. A. Hocevar, Toxicol. Pathol., 2010, 38, 96–109 CrossRef CAS PubMed.
- N. D. Lakin and S. P. Jackson, Oncogene, 1999, 18, 7644–7655 CrossRef CAS PubMed.
- D. W. Meek, DNA Repair, 2004, 3, 1049–1056 CrossRef CAS PubMed.
- L. A. Kachnic, B. Wu, H. Wunsch, K. L. Mekeel, J. S. DeFrank and W. Tang, et al., J. Biol. Chem., 1999, 274(19), 13111–13117 CrossRef CAS PubMed.
- S. Rocha, K. J. Campbell, K. C. Roche and N. D. Perkins, BMC Mol. Biol., 2003, 4, 9 CrossRef PubMed.
- M. Redza-Dutordoir and D. A. Averill-Bates, Biochim. Biophys. Acta, Mol. Cell Res., 2016, 1863(12), 2977–2992 CrossRef CAS PubMed.
- K. O'Keefe, H. Li and Y. Zhang, Mol. Cell. Biol., 2003, 23(18), 6396–6405 CrossRef.
- T. M. Johnson, Z. X. Yu, V. J. Ferrans, R. A. Lowenstein and T. Finkel, Proc. Natl. Acad. Sci. U. S. A., 1996, 93(21), 11848–11852 CrossRef CAS.
- A. Agarwal, A. Kasinathan, R. Ganesan, A. Balasubramanian, J. Bhaskaran and S. Suresh, et al., Nutr. Res., 2018, 51, 67–81 CrossRef CAS PubMed.
- L. Tian, D. Yin, Y. Ren, C. Gong, A. Chen and F. J. Guo, Mol. Med. Rep., 2012, 5(1), 126–132 CAS.
- P. H. Shaw, Pathol., Res. Pract., 1996, 192, 669–675 CrossRef CAS.
- E. Senturk and J. J. Manfredi, Methods Mol. Biol., 2013, 962, 49–61 CrossRef PubMed.
- G. Nayak and G. M. Cooper, Cell Death Dis., 2012, 3, e400 CrossRef CAS PubMed.
- S. Elmore, Toxicol. Pathol., 2007, 35, 495–516 CrossRef CAS PubMed.
- B. W. Booth, B. D. Inskeep, H. Shah, J. P. Park, E. J. Hay and K. J. L. Burg, Int. J. Breast Cancer, 2013, 2013, 369609 Search PubMed.
- K. Tikoo, M. S. Sane and C. Gupta, Toxicol. Appl. Pharmacol., 2011, 251(3), 191–200 CrossRef CAS PubMed.
- Y. Sun, T. Zhang, B. Wang, H. Li and P. Li, Anticancer Drugs, 2012, 23(9), 979–990 CAS.
- P. Darvin, S. J. Baeg, Y. H. Joung, S. P. Nipin, D. Y. Kang and H. J. Byun, et al., Int. J. Oncol., 2015, 47(3), 1111–1120 CrossRef PubMed.
Footnote |
| † Electronic supplementary information (ESI) available. See DOI: 10.1039/c9ra00808j |
| This journal is © The Royal Society of Chemistry 2019 |

