 Open Access Article
The influence of siloxane side-chains on the photovoltaic performance of a conjugated polymer†
Gaël H. L. Heintgesab,
Koen H. Hendriksac,
Fallon J. M. Colbertsa,
Mengmeng Lia,
Junyu Lid and
René A. J. Janssen *ac
*ac
aMolecular Materials and Nanosystems, Institute for Complex Molecular Systems, Eindhoven University of Technology, P. O. Box 513, 5600 MB Eindhoven, The Netherlands. E-mail: r.a.j.janssen@tue.nl
bInstitute for Materials Research (IMO-IMOMEC), Design & Synthesis of Organic Semiconductors (DSOS), Hasselt University, Agoralaan, 3590 Diepenbeek, Belgium
cDutch Institute for Fundamental Energy Research, De Zaale 20, 5612 AJ Eindhoven, The Netherlands
dDSM DMSC R&D Solutions, P. O. Box 18, 6160 MD Geleen, The Netherlands
First published on 15th March 2019
Abstract
The effect of gradually replacing the branched alkyl side chains of a diketopyrrolopyrrole (DPP) conjugated polymer by linear side chains containing branched siloxane end groups on the photovoltaic performance of blends of these polymers with a common fullerene acceptor is investigated. With an increasing proportion of siloxane side chains, the molecular weight and solubility of the polymers decreases. While the siloxane containing polymers exhibit a higher hole mobility in field-effect transistors, their performance in solar cells is less than the polymer with only alkyl sides chains. Using grazing-incidence wide-angle X-ray scattering, transmission electron microscopy, and fluorescence spectroscopy we identify two main reasons for the reduced performance of siloxane containing polymers in solar cells. The first one is a somewhat coarser phase-separated morphology with slightly wider polymer fibers. This is unexpected as often the fiber width is inversely correlated with polymer solubility. The second one is stronger non-radiative decay of the pristine polymers containing siloxane side chains.
Introduction
Organic bulk heterojunction (BHJ) solar cells have attracted attention over the past years as a novel, green energy technology.1,2 An essential parameter influencing the performance of these solar cells is the morphology of the BHJ layer, which has been shown to be directly influenced by the solubility of the components in the processing solvents.3–6 In particular, it has been found that in blends consisting of a polymer donor and a fullerene acceptor, the polymer should self-organize to achieve a high power conversion efficiency (PCE). For diketopyrrolopyrrole (DPP) polymers the most optimal, finely dispersed morphology in combination with fullerenes has been achieved for polymers with shorter side chains and higher molecular weights.3,7 This behavior has been explained by a nucleation-and-growth model applied to fibrous networks.3 By using co-solvents in which the DPP polymers are only sparsely soluble these insights resulted in record high PCEs.8 Following these trends, high PCEs can be obtained by reducing the solubility, while of course maintaining a high enough level to ensure processability. In conjugated polymers, a straightforward way to influence the solubility and tendency to aggregate is to alter the solubilizing side-chains, which strongly influences the solar cell performance.6–13 By introducing chemical functionalities other than alkyl side chains in these polymers, a further fine-tuning of the aggregation behavior can be achieved.9,11,14–16 Additionally, by changing the side-chains also the miscibility of the donor and acceptor17,18 and the packing of the polymer chains can be affected. These two effects also influence the morphology of the layer and the performance of the solar cells.Siloxane-containing side chains have been investigated in conjugated polymers for organic field-effect transistor (OFET) applications19–24 and have shown to increase the crystallinity and decrease solubility, therefore directly affecting the charge mobility of these materials. Also in solar cells siloxane containing polymers have been introduced to increase crystallinity of the electron donor, influencing the morphology of the blend layers.25–28 This has led to highly performance solar cells, with PCE of 11%, when siloxane side chains were combined with regular alkyl chains within the same polymer.27 Interestingly, it was shown that the number average molecular weight (Mn) decreased with increasing siloxane content, as polymers with high siloxane content were less soluble and could not reach high Mn's before becoming insoluble.27
In this work, siloxane side chains are employed on diketopyrrolopyrrole (DPP) polymers, a class of conjugated polymers that has shown high promise in solar cell applications.29 In particular, siloxane side chains were introduced in varying concentrations on poly[{2,5-bis(2-hexyldecyl)-2,3,5,6-tetrahydro-3,6-dioxopyrrolo[3,4-c]pyrrole-1,4-diyl}-alt-{[2,2′-(1,4-phenylene)bisthiophene]-5,5′-diyl}] (PDPPTPT),30 in this way finely tuning the solubility. In previous studies and theories on the morphology formation in active layers, the effect of solubility has always been observed and applied holistically. Looking into detail at the factors determining solubility and aggregation behavior, two important properties can easily be identified: the solubility of the monomers or repeat unit, from here on in called the ‘intrinsic solubility’, and the average molecular weight of the polymers. Whereas the influence of molecular weight has separately been investigated in the past,3,31–37 separating the influence of the intrinsic solubility from the influence of the molecular weight has proven difficult. By mixing siloxane and alkyl side chains however, a series of polymers has been obtained with varying intrinsic solubility not positively correlated to the molecular weight, hereby providing further insight in the factors that govern morphology formation and solar cell performance.
Results and discussion
A series of DPP polymers was designed in which the 2-hexyldecyl side chains of PDPPTPT are gradually replaced by 6-(1,5-di-tert-butyl-1,1,3,5,5-pentamethyltrisiloxan-3-yl)hexyl side chains. This siloxane side chain with tert-butyl substituents was chosen to provide enough solubility while moving the branching point on the side chain far away from the DPP core to encourage π–π stacking. The siloxane was synthesized and then attached via a hydrosilylation reaction to a hexene substituted DPP as shown in Scheme 1, essentially following a procedure previously reported.20,22 The monomer was then brominated in preparation for the Suzuki polymerization with 1,4-benzenediboronic acid bis(pinacol) ester (Scheme 2).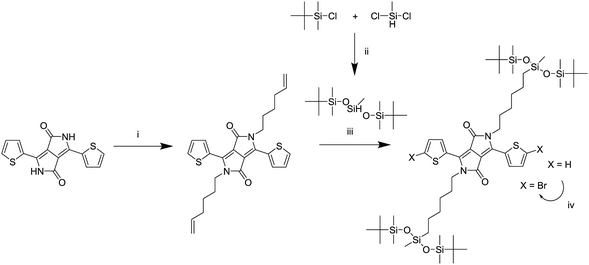 | ||
| Scheme 1 Synthesis of the monomer adapted from a previously reported route.20,22 (i) K2CO3, 6-bromohexene, DMF, 120 °C, (ii) isopropyl ether, 70 °C, (iii) Karstedt's catalyst, toluene, 80 °C, (iv) NBS, chloroform, room temperature. | ||
By combining different ratios of alkyl and siloxane substituted DPP monomers with phenylene, a series of copolymers was obtained with similar electronic properties but different intrinsic solubilities. After the synthesis differences in physical properties could be immediately observed, with the polymers having a high siloxane content being slightly more difficult to dissolve and being more brittle in the solid state.
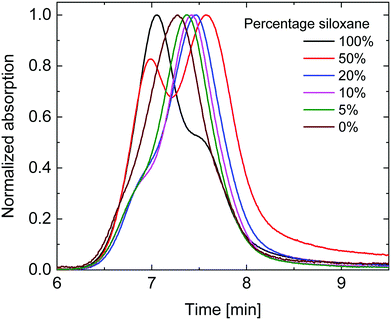
Gel permeation chromatography (GPC) in ortho-dichlorobenzene (o-DCB) was performed at 140 °C to determine the molecular weights (Fig. 1). As is seen in Fig. 1, the polymers with high siloxane content showed two distinct peaks in the gel permeation chromatogram, with the peak at shorter retention times decreasing in intensity with diminishing siloxane content. The UV-vis-NIR spectrum of the short retention time peak (not shown) displayed a distinct red-shifted shoulder which is commonly associated with aggregation of DPP polymers. This coincides with the solubility of the polymers decreasing with increased siloxane content. The peak at longer retention times revealed a more blue-shifted UV-vis-NIR spectrum (not shown) associated with molecularly dissolved polymers and is therefore most likely a better estimate of the true molecular weight. When considering the peak molecular weight (Mp) of the main peak (Table 1), a clear trend can be seen of decreasing Mp with increasing siloxane content, except for the 100% siloxane polymer where aggregation seems to prevail. This trend indicates that a lower degree of polymerization was achieved for polymers with higher siloxane content, but that these nevertheless show a higher tendency for aggregation in o-DCB at elevated temperature. The difference in degree of polymerization could therefore be related to premature aggregation in the polymerization mixture, thereby inhibiting the reaction, an effect previously observed by Liu et al.,27 indicating that polymer solubility during polymerization can have an effect on molecular weight obtained. This implies that polymers with a high siloxane content have a low intrinsic and overall solubility coupled with a low Mp, whereas polymers with a low siloxane content have higher intrinsic and overall solubilities coupled with a high Mp. In this way this set of polymers provides a case where solubility is not positively correlated with Mp, providing a platform to further investigate the effects of Mp and intrinsic solubility separately.
| Siloxane fraction | Mp [kDa] | HOMOb [eV] | LUMOb [eV] | Eg,SWc [eV] | Eg,optc [eV] | d-spacing (TEM) [Å] | d-spacing (GIWAXS) [Å] | Mobility [cm2 V−1 s−1] |
|---|---|---|---|---|---|---|---|---|
| a Estimate based on a Gaussian fit to the low-Mp shoulder of un-aggregated polymer chains in the GPC.b Determined with square wave voltammetry vs. Fc/Fc+, which was set at −4.8 eV vs. vacuum.c Eg,SW is the difference between HOMO and LUMO energies. Eg,opt is the optical band gap. | ||||||||
| 100% | 15.1a | −5.20 | −3.31 | 1.89 | 1.54 | 26.2 | 25.1 | 8.2 × 10⁻³ |
| 50% | 15.9 | −5.22 | −3.29 | 1.93 | 1.53 | 24.7 | 24.2 | 3.1 × 10⁻² |
| 20% | 21.4 | −5.26 | −3.30 | 1.96 | 1.53 | 21.5 | 21.9 | 2.4 × 10⁻² |
| 10% | 24.4 | −5.29 | −3.29 | 1.99 | 1.52 | 20.6 | 20.3 | 1.5 × 10⁻² |
| 5% | 28.7 | −5.27 | −3.30 | 1.96 | 1.52 | 19.8 | 19.6 | 1.3 × 10⁻² |
| 0% | 38.5 | −5.27 | −3.29 | 1.98 | 1.51 | 18.5 | 19.2 | 4.5 × 10⁻⁴ |
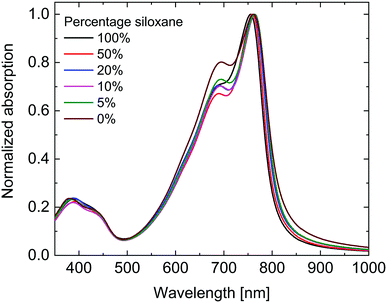
As can be seen in Fig. 2 the UV-vis-NIR absorption spectra of all polymers are virtually identical in the solid state. While the peak position shows no clear trend, the onset of absorption at long wavelengths shows a small blue shift with increasing siloxane content, indicating a small increase in optical band gap (Eg,opt) (Table 1). This is most likely due to differences in aggregation and packing caused by the more bulky siloxane groups.
To gain further insight in the aggregation behavior of these polymers their temperature dependent UV-vis-NIR spectra were recorded in 1,1,2,2-tetrachloroethane (TCE) (Fig. 3). For the polymers with a higher siloxane content the peak at 760 nm, associated with aggregates, decreased less than for the polymers with low siloxane content with increasing temperature, indicating once again that the polymers with high siloxane content have a stronger tendency for aggregation.
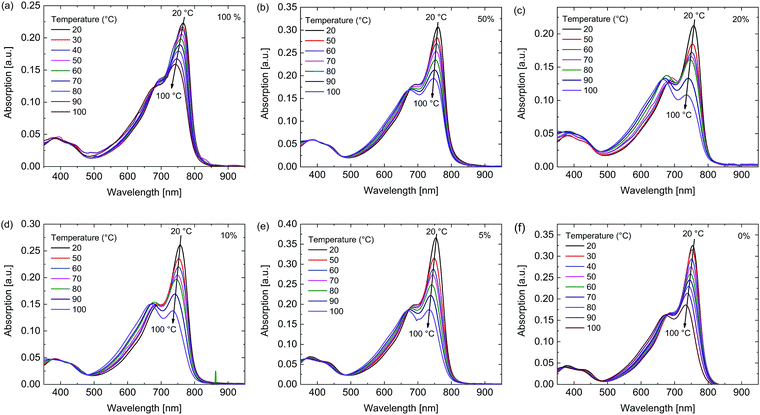 | ||
| Fig. 3 Temperature dependent UV-vis-NIR spectra in TCE of the polymers. Percentage siloxane (a) 100%, (b) 50%, (c) 20%, (d) 10%, (e) 5%, (f) 0%. | ||
Square wave voltammetry was performed on the polymers to determine the oxidation and reduction potentials (Fig. S1 and S2, ESI†). The polymers were studied as thin films on a Pt wire and measured in acetonitrile containing 0.1 M tetrabutylammonium hexafluorophosphate as electrolyte. Ferrocene/ferrocenium (Fc/Fc+) was used as internal standard. The reduction waves of the six polymers are virtually identical, but the oxidation potentials slowly decrease with increasing siloxane content. The resulting HOMO and LUMO levels are summarized in Table 1.
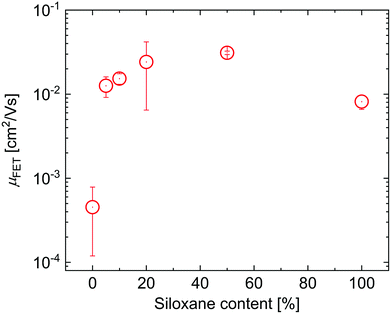
To evaluate the effects of the side chains on the hole mobility, field-effect transistors were fabricated in a bottom-gate, bottom-contact architecture. The results are collected in Table 1. As can be seen in Fig. 4, the hole mobility increases by an order of magnitude upon the introduction of siloxanes and is comparable for all polymers containing siloxane side chains. The higher hole mobility of PDPPTPT with siloxane-terminated solubilizing groups, is consistent with previous observations.19,20
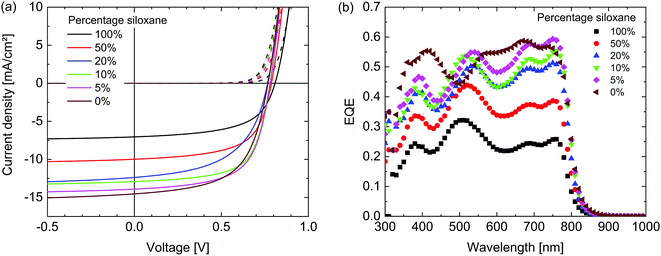
The photovoltaic performance of the materials was evaluated by fabricating solar cells with an ITO/ZnO/active layer/MoO3/Ag configuration. For the active layer, the polymers were combined with [6,6]-phenyl-C71-butyric acid methyl ester ([70]PCBM) as an acceptor in a 1![[thin space (1/6-em)]](https://www.rsc.org/images/entities/char_2009.gif) :
:![[thin space (1/6-em)]](https://www.rsc.org/images/entities/char_2009.gif) 2 weight ratio and spin coated from solutions in chloroform containing 2% diphenyl ether (DPE). These conditions were found to be optimal in terms of power conversion efficiency (PCE) for both the 100% siloxane as well as the 0% siloxane polymer after an optimization of the solvent and co-solvent ratio. Fig. 5 shows the current-density – voltage (J–V) characteristics in dark and under simulated AM1.5G (100 mW cm−2) illumination and external quantum efficiencies (EQE) of the optimized devices. The photovoltaic parameters are summarized in Table 2. The short-circuit current density (Jsc) reduces for polymers with increased siloxane content. Analysis of the corresponding EQE spectra reveals that the decrease in current generation is proportional over all wavelengths. As the electronic and optical properties of all polymers are very similar, the most likely cause therefore is differences in the morphology of the blend layers. As can be seen in Table 2, there is no clear trend in the fill factor (FF). Since the fill factor relates to the competition between extraction and recombination of free charges,38 the balance between these two processes appears similar in all layers. A weak trend between the siloxane content and the open-circuit voltage (Voc) is observed, with a ∼40 mV increase in Voc with 100% siloxane content. Although differences are small, we note that this trend is opposite to the change in HOMO levels, where the 100% siloxane polymer has a ∼70 meV shallower HOMO level (Table 1), which generally would provide a lower Voc. Overall the PCE of the PDPPTPT
2 weight ratio and spin coated from solutions in chloroform containing 2% diphenyl ether (DPE). These conditions were found to be optimal in terms of power conversion efficiency (PCE) for both the 100% siloxane as well as the 0% siloxane polymer after an optimization of the solvent and co-solvent ratio. Fig. 5 shows the current-density – voltage (J–V) characteristics in dark and under simulated AM1.5G (100 mW cm−2) illumination and external quantum efficiencies (EQE) of the optimized devices. The photovoltaic parameters are summarized in Table 2. The short-circuit current density (Jsc) reduces for polymers with increased siloxane content. Analysis of the corresponding EQE spectra reveals that the decrease in current generation is proportional over all wavelengths. As the electronic and optical properties of all polymers are very similar, the most likely cause therefore is differences in the morphology of the blend layers. As can be seen in Table 2, there is no clear trend in the fill factor (FF). Since the fill factor relates to the competition between extraction and recombination of free charges,38 the balance between these two processes appears similar in all layers. A weak trend between the siloxane content and the open-circuit voltage (Voc) is observed, with a ∼40 mV increase in Voc with 100% siloxane content. Although differences are small, we note that this trend is opposite to the change in HOMO levels, where the 100% siloxane polymer has a ∼70 meV shallower HOMO level (Table 1), which generally would provide a lower Voc. Overall the PCE of the PDPPTPT![[thin space (1/6-em)]](https://www.rsc.org/images/entities/char_2009.gif) :
:![[thin space (1/6-em)]](https://www.rsc.org/images/entities/char_2009.gif) [70]PCBM blends drops by a factor of over 2, going from 0% to 100% siloxane side chains. A preliminary study on the stability (see ESI†) revealed that the polymers can be safely stored under ambient conditions in the dark for >1 year, and that the photovoltaic devices do not degrade when stored under protective dry N2 atmosphere for 6 months.
[70]PCBM blends drops by a factor of over 2, going from 0% to 100% siloxane side chains. A preliminary study on the stability (see ESI†) revealed that the polymers can be safely stored under ambient conditions in the dark for >1 year, and that the photovoltaic devices do not degrade when stored under protective dry N2 atmosphere for 6 months.
![[thin space (1/6-em)]](https://www.rsc.org/images/entities/char_2009.gif) :
:![[thin space (1/6-em)]](https://www.rsc.org/images/entities/char_2009.gif) [70]PCBM 1
[70]PCBM 1![[thin space (1/6-em)]](https://www.rsc.org/images/entities/char_2009.gif) :
:![[thin space (1/6-em)]](https://www.rsc.org/images/entities/char_2009.gif) 2 (w/w) blendsa
2 (w/w) blendsa
| Siloxane fraction | d [nm] | Jsc [mA cm−2] | Voc [V] | FF | PCE [%] |
|---|---|---|---|---|---|
| a Best cells are shown, numbers between parentheses refer to the average over 4 cells. | |||||
| 100% | 125 | 6.8 (6.7) | 0.81 (0.81) | 0.58 (0.57) | 3.2 (3.1) |
| 50% | 98 | 9.7 (9.6) | 0.79 (0.79) | 0.62 (0.62) | 4.7 (4.7) |
| 20% | 123 | 12.4 (12.1) | 0.77 (0.77) | 0.54 (0.52) | 5.1 (4.9) |
| 10% | 99 | 13.2 (13.4) | 0.78 (0.77) | 0.65 (0.63) | 6.7 (6.6) |
| 5% | 100 | 14.0 (13.9) | 0.78 (0.78) | 0.63 (0.62) | 6.9 (6.7) |
| 0% | 143 | 14.6 (14.6) | 0.77 (0.77) | 0.59 (0.59) | 6.6 (6.6) |
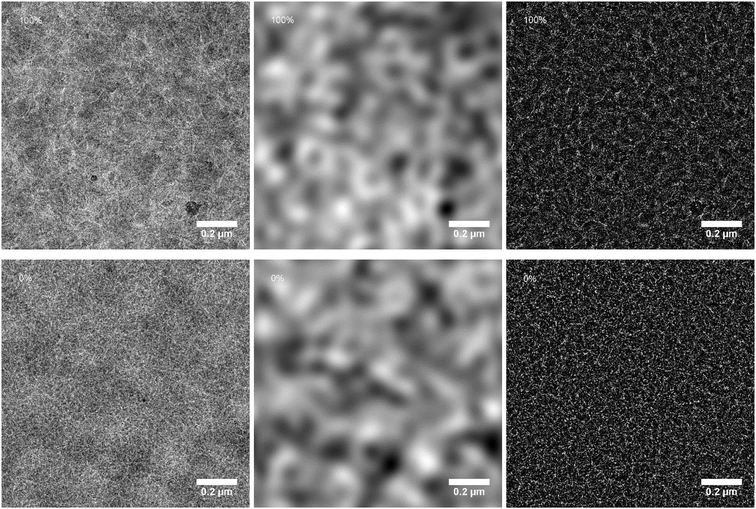
To understand the change in performance with increasing percentage of siloxane side chains, transmission electron microscopy (TEM) was performed to analyze the morphology of the active layers. These are shown in Fig. 6 (left panels) for the 100% and 0% siloxane polymers and in the ESI (Fig. S3†) for the other blends. All mixtures show a fine fiber-like morphology typical for blends of DPP-based polymers with [70]PCBM.7,39 In all cases, the fiber width is small, making a detailed analysis difficult, but for the 100% siloxane the fibers appear wider than for the 0% polymer. At high magnification the TEM images (Fig. S4, ESI†) show lattice fringes that can be associated with the lamellar packing distance (d-spacing) of the polymers chains. By performing a Fourier transform of the images in Fig. S4 (ESI†), an estimate of the d-spacing of the crystalline domains in the blend could be obtained. A significant increase in the d-spacing from 18.5 Å to 26.2 Å was found with increasing siloxane content (Table 1). This is assigned to the bulky nature of the siloxane side chains groups that hinder closer lamellar packing.
Further analysis of the blend morphology was done using two-dimensional grazing incidence wide angle X-ray scattering (2D GIWAXS) (Fig. S5, ESI†). The 2D GIWAXS shows diffuse halos at q ≈ 0.7 Å−1 and q ≈ 1.4 Å−1 that can be attributed to [70]PCBM clusters.40,41 The diffraction around q = 0.25 Å−1 is associated with the lamellar d-spacing of the polymer and values for the different polymers are in accordance with the data obtained from the TEM (Table 1). The 2D GIWAXS and the corresponding in-plane and out-of-plane line cuts (Fig. S6, ESI†) indicate a change in orientation of the polymer chains on the surface with increasing siloxane content. The orientation changes from relatively mostly edge-on for the polymers with low percentages of siloxane, via a mixed edge-on/face-on orientation for the 50% siloxane polymer, to relatively the most face-on for the 100% siloxane polymer. This was further confirmed by a pole figure analysis (see Discussion and Fig. S7, S8 in ESI†). Generally, a face-on orientation, in which the π-face lies in the plane of the substrate, is beneficial for solar cell performance as it favors vertical inter-chain charge transport and may even inhibit charge recombination.42 For the siloxane containing polymers however we see an opposite trend in the solar cell performance and, hence, the difference in polymer orientation does not explain the differences in photovoltaic performance.
To gain further insight in the morphology a filtering was performed on the TEM images: in the Fourier transform image all information pertaining to features larger than 100 nm was cut out and stored separately. Next, the two images were inverse Fourier transformed resulting in two filtered images, one containing only features larger than 100 nm and one with only smaller features (Fig. 6, middle and right panels). In the large-feature images a blurred pattern of dark and light domains can be seen with a distance of 300 to 400 nm, most likely associated with coarse phase separation over these larger length scales. All blends show a very similar distribution of these light and dark regions. In the small-feature images the fibrous structure of the polymers is now more clearly visible. The small size of the fibers still prohibits further formal characterization of the domain sizes, however, a clearer difference between the blends can now be seen. This difference lies mainly in the distances between fibers or fiber-clusters, with the blend of the 100% siloxane polymer showing the roughest structure and the fibers becoming gradually more finely dispersed with decreasing siloxane content. This difference is most clear when comparing the 100%, 50% and 0% siloxane polymer blends. Among the 0%, 5%, 10% and 20% polymer blends the differences are only very subtle. A finer fibrous morphology is known to provide higher quantum efficiencies for charge generation. For thicker fibers, typical exciton diffusion lengths are smaller than the fiber width, causing excitons to decay before charges can be generated at the interface with [70]PCBM.3,7,8,39 Whereas this is a clear trend in the morphology of these layers, the differences remain subtle, and might not fully explain the trend seen in the EQE spectra.
To further investigate the diminishing Jsc with higher siloxane content, fluorescence spectra of pristine polymer layers and their blends with [70]PCBM were measured. The fluorescence intensity was corrected for the absorption intensity of the layers at 750 nm, which was the wavelength used for excitation. As can be seen in Fig. 7, a similar, broad, fluorescence spectrum was measured for all polymers. The fluorescence intensity of the pristine layers is comparable for the 0%, 5% and 10% polymers, and shows a downward trend with increasing siloxane content. The lower fluorescence intensity for the polymers with a high percentage of siloxane side chains indicates a lower fluorescence quantum yield. As the radiative lifetime is not expected to change with the change in side chains, the most likely cause is an increased non-radiative decay. The underlying cause for this trend is not fully understood at present, but could be related to the packing of the polymer chains influencing the amount of non-radiative decay. The fluorescence intensity of the blend layers with [70]PCBM is much lower and comparable for all polymers, except for the 100% polymer which shows a higher intensity. The fluorescence quenching is caused by photoinduced electron transfer between the PDPPTPT polymers and [70]PCBM. The fluorescence quenching is significantly lower for the 50% and 100% polymers compared to the other PDPPTPT polymers. This indicates a lower tendency of charge generation, which is in line with the lower Jsc obtained from these polymers.
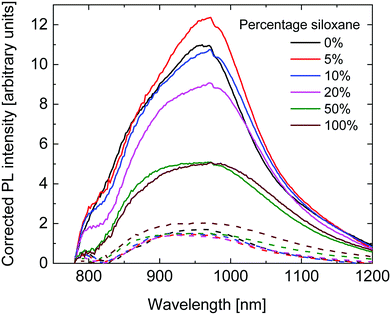 | ||
| Fig. 7 Fluorescence spectra of the pristine polymers (solid lines) and their blends with [70]PCBM (dashed lines), corrected for the absorption at 750 nm. | ||
In summary, we have identified several effects that explain the lower Jsc of solar cells fabricated from polymers with high siloxane content. The (Fourier-filtered) TEM results point to the differences in fiber morphology, where a larger spatial distribution of wider fibers inhibits efficient charge separation. Moreover, the siloxane side chains give rise to a low fluorescence intensity, which is attributed to more efficient non-radiative exciton decay, causing a reduced excited-state lifetime and hence an intrinsic lower chance to generate charges from the corresponding polymers. While we have presented some evidence for the above two mechanisms, other factors may also contribute to the lower Jsc. Exciton mobility, e.g., could be affected by the increased d-spacing of the siloxane containing polymers, further hindering exciton dissociation at the donor–acceptor interface.
Conclusion
A varying ratio of siloxane and alkyl side chains was introduced on PDPPTPT to tune the molecular weight and solubility and investigate the effect of these two parameters on the performance of bulk heterojunction solar cells with a common fullerene acceptor. Increasing the siloxane to alkyl side chain ratio resulted in a reduced peak molecular weight and a reduced solubility. The short-circuit current density and power conversion efficiency of the solar cells were lower with increasing percentage of siloxane. Fourier-filtered transmission electron microscopy and two-dimensional grazing incidence wide angle X-ray scattering revealed a fibrous morphology in which the fibers become wider and the chains are more face-oriented for higher siloxane content. Fluorescence spectroscopy indicated less fluorescence quenching with more siloxane side chains. The conclusion that emerges is that the siloxane side chains give rise to less charge generation due to a coarser morphology with slightly wider polymer fibers and increased non-radiative decay of the pristine polymers.It has repeatedly been demonstrated that enhancing the tendency to aggregate of DPP polymers by reducing the solubility, leads to a better morphology with narrow fibers and higher PCEs.3,7,39,43 Because an increase of the molecular weight of a polymer generally reduces its solubility, high molecular weight can be important for obtaining high PCEs. In the present example of PDPPTPT polymers, partly substituted with siloxane side chains, we have managed to decouple the solubility of the polymer from the molecular weight by using monomers with an intrinsic lower solubility and have made a series of polymers where the trend in solubility is opposite of the trend in molecular weight (Mp). The remarkable result is that in this case the lower solubility does not result in a finer fiber morphology of the bulk heterojunction blend, but rather in one that is similar or even slightly coarser. The fact that the PCE now decreases with decreasing solubility is related to two reasons. The first one is the slight increase in fiber width and coarser morphology; the second one is the intrinsically lower fluorescence of the siloxane containing polymers, which results in a less effective charge generation. It remains an interesting question why the fiber width of the siloxane containing PDPPTPT polymers is not reversely correlated with the solubility.
Conflicts of interest
There are no conflicts to declare.Acknowledgements
G. H. L. Heintges acknowledges the Agency for Innovation by Science and Technology in Flanders (IWT). This project has further received funding from the European Union's Horizon 2020 research and innovation programme under the Marie Skłodowska-Curie grant agreement No. 747422, from the European Research Council under the European Union's Seventh Framework Programme (FP/2007-2013)/ERC Grant Agreement No. 339031 and from the Ministry of Education, Culture and Science (Gravity program 024.001.035).References
- S. Zhang, Y. Qin, J. Zhu and J. Hou, Adv. Mater., 2018, 30, 1800868 CrossRef PubMed
.
- S. Holliday, Y. Li and C. K. Luscombe, Prog. Polym. Sci., 2017, 70, 34–51 CrossRef CAS
.
- J. J. van Franeker, G. H. L. Heintges, C. Schaefer, G. Portale, W. Li, M. M. Wienk, P. van der Schoot and R. A. J. Janssen, J. Am. Chem. Soc., 2015, 137, 11783–11794 CrossRef CAS PubMed
.
- L. Ye, X. Jiao, W. Zhao, S. Zhang, H. Yao, S. Li, H. Ade and J. Hou, Chem. Mater., 2016, 28, 6178–6185 CrossRef CAS
.
- J. Zhao, S. Zhao, Z. Xu, B. Qiao, D. Huang, L. Zhao, Y. Li, Y. Zhu and P. Wang, ACS Appl. Mater. Interfaces, 2016, 8, 18231–18237 CrossRef CAS PubMed
.
- G. H. L. Heintges, P. J. Leenaers and R. A. J. Janssen, J. Mater. Chem. A, 2017, 5, 13748–13756 RSC
.
- W. Li, K. H. Hendriks, A. Furlan, W. S. C. Roelofs, M. M. Wienk and R. A. J. Janssen, Adv. Mater., 2014, 26, 1565–1570 CrossRef CAS PubMed
.
- M. Li, D. Di Carlo Rasi, F. J. M. Colberts, J. Wang, G. H. L. Heintges, B. Lin, W. Li, W. Ma, M. M. Wienk and R. A. J. Janssen, Adv. Energy Mater., 2018, 8, 1800550 CrossRef
.
- W.-S. Chang, J. Gao, L. Dou, C.-C. Chen, Y. Liu and Y. Yang, Adv. Energy Mater., 2014, 4, 1300864 CrossRef
.
- C. Cabanetos, A. El Labban, J. A. Bartelt, J. D. Douglas, W. R. Mateker, J. M. J. Fréchet, M. D. McGehee and P. M. Beaujuge, J. Am. Chem. Soc., 2013, 135, 4656–4659 CrossRef CAS PubMed
.
- X. Chen, Z. Zhang, J. Liu and L. Wang, Polym. Chem., 2017, 8, 5496–5503 RSC
.
- C. Duan, R. E. M. Willems, J. J. van Franeker, M. M. Wienk and R. A. J. Janssen, J. Mater. Chem. A, 2016, 4, 1855–1866 RSC
.
- L. Ye, X. Jiao, S. Zhang, H. Yao, Y. Qin, H. Ade and J. Hou, Adv. Energy Mater., 2017, 7, 1601138 CrossRef
.
- M. Zhang, X. Guo, W. Ma, H. Ade and J. Hou, Adv. Mater., 2014, 26, 5880–5885 CrossRef CAS PubMed
.
- R. Heuvel, F. J. M. Colberts, M. M. Wienk and R. A. J. Janssen, J. Mater. Chem. C, 2018, 6, 3731–3742 RSC
.
- K. H. Hendriks, W. Li, M. M. Wienk and R. A. J. Janssen, Adv. Energy Mater., 2013, 3, 674–679 CrossRef CAS
.
- N. D. Treat, A. Varotto, C. J. Tackacs, N. Batara, M. Al-Hashimi, M. J. Heeney, A. J. Heeger, F. Wudl, C. Hawker and M. L. Chabinyc, J. Am. Chem. Soc., 2012, 134, 15869–15879 CrossRef CAS PubMed
.
- L. Ye, H. Hu, M. Ghasemi, T. Wang, B. A. Colins, J.-H. Kim, K. Jiang, J. H. Carpenter, H. Li, Z. Li, T. McAfee, J. Zhao, X. Chen, J. Lin Yuk Lai, T. Ma, J.-L. Brédas, H. Yan and H. Ade, Nat. Mater., 2018, 17, 253–260 CrossRef CAS PubMed
.
- J. Mei, D. H. Kim, A. L. Ayzner, M. F. Toney and Z. Bao, J. Am. Chem. Soc., 2011, 133, 20130–20133 CrossRef CAS PubMed
.
- H. Li, J. Mei, A. L. Ayzner, M. F. Toney, J. B.-H. Tok and Z. Bao, Org. Electron., 2012, 13, 2450–2460 CrossRef CAS
.
- J. Lee, A.-R. Han, J. Kim, Y. Kim, J. H. Oh and C. Yang, J. Am. Chem. Soc., 2012, 134, 20713–20721 CrossRef CAS PubMed
.
- J. Lee, A.-R. Han, H. Yu, T. J. Shin, C. Yang and J. H. Oh, J. Am. Chem. Soc., 2013, 135, 9540–9547 CrossRef CAS PubMed
.
- J. Mei, H.-C. Wu, Y. Diao, A. Appleton, H. Wang, Y. Zhou, W.-Y. Lee, T. Kurosawa, W.-C. Chen and Z. Bao, Adv. Funct. Mater., 2015, 25, 3455–3462 CrossRef CAS
.
- A.-R. Han, J. Lee, H. R. Lee, J. Lee, S.-H. Kang, H. Ahn, T. J. Shin, J. H. Oh and C. Yang, Macromolecules, 2016, 49, 3739–3748 CrossRef CAS
.
- B. Fan, L. Ying, P. Zhu, F. Pan, F. Liu, J. Chen, F. Huang and Y. Cao, Adv. Mater., 2017, 29, 1703906 CrossRef PubMed
.
- D. H. Kim, A. L. Ayzner, A. L. Appleton, K. Schmidt, J. Mei, M. F. Toney and Z. Bao, Chem. Mater., 2013, 25, 431–440 CrossRef CAS
.
- X. Liu, L. Nian, K. Gao, L. Zhang, L. Qing, Z. Wang, L. Ying, Z. Xie, Y. Ma, Y. Cao, F. Liu and J. J. Chen, J. Mater. Chem. A, 2017, 5, 17619–17631 RSC
.
- S. Feng, C. Liu, X. Xu, X. Liu, L. Zhang, Y. Nian, Y. Cao and J. Chen, ACS Macro Lett., 2017, 6, 1310–1314 CrossRef CAS
.
- W. Li, K. H. Hendriks, M. M. Wienk and R. A. J. Janssen, Acc. Chem. Res., 2016, 49, 78–85 CrossRef CAS PubMed
.
- K. H. Hendriks, G. H. L. Heintges, V. S. Gevaerts, M. M. Wienk and R. A. J. Janssen, Angew. Chem., Int. Ed., 2013, 52, 8341–8344 CrossRef CAS PubMed
.
- J. J. Intemann, K. Yao, H.-L. Yip, Y.-X. Xu, Y.-X. Li, P.-W. Liang, F.-Z. Ding, X. Li and A. K.-Y. Jen, Chem. Mater., 2013, 25, 3188–3195 CrossRef CAS
.
- J. A. Bartelt, J. D. Douglas, W. R. Mateker, A. El Labban, C. J. Tassone, M. F. Toney, J. M. J. Fréchet, P. M. Beaujuge and M. D. McGehee, Adv. Energy Mater., 2014, 4, 1301733 CrossRef
.
- H. K. H. Lee, Z. Li, I. Constantinou, F. So, S. W. Tsang and S. K. So, Adv. Energy Mater., 2014, 4, 1400768 CrossRef
.
- H. Kang, M. A. Udding, C. Lee, K.-H. Kim, T.-L. Nguyen, W. Lee, Y. Li, C. Wang, H. Y. Woo and B. J. Kim, J. Am. Chem. Soc., 2015, 137, 2359–2365 CrossRef CAS PubMed
.
- J. Subbiah, B. Purushothaman, M. Chen, T. Qin, M. Gao, D. Vak, F. H. Scholes, X. Chen, S. E. Watkins, G. J. Wilson, A. B. Holmes, W. W. H. Wong and D. J. Jones, Adv. Mater., 2015, 27, 702–705 CrossRef CAS PubMed
.
- C. Liu, K. Wang, X. Hu, Y. Yang, C.-H. Hsu, W. Zhang, S. Xiao, X. Gong and Y. Cao, ACS Appl. Mater. Interfaces, 2013, 5, 12163–12167 CrossRef CAS PubMed
.
- Z. Xiao, K. Sun, J. Subbiah, T. Qin, S. Lu, B. Purushothaman, D. J. Jones, A. B. Holmes and W. W. H. Wong, Polym. Chem., 2015, 6, 2312–2318 RSC
.
- D. Bartesaghi, I. del Carmen Pérez, J. Kniepert, S. Roland, M. Turbiez, D. Neher and L. J. A. Koster, Nat. Commun., 2015, 6, 7083 CrossRef CAS PubMed
.
- W. Li, K. H. Hendriks, A. Furlan, W. S. C. Roelofs, M. M. Wienk and R. A. J. Janssen, J. Am. Chem. Soc., 2013, 135, 18942–18948 CrossRef CAS PubMed
.
- E. Verploegen, R. Mondal, C. J. Bettinger, S. Sok, M. F. Toney and Z. Bao, Adv. Funct. Mater., 2010, 20, 3519–3529 CrossRef CAS
.
- J. A. Bartelt, Z. M. Beiley, E. T. Hoke, W. R. Mateker, J. D. Douglas, B. A. Collins, J. R. Tumbleston, K. R. Graham, A. Amassian, H. Ade, J. M. J. Fréchet, M. F. Toney and M. D. McGehee, Adv. Energy Mater., 2013, 3, 364–374 CrossRef CAS
.
- J. R. Tumbleston, B. A. Collins, L. Yang, A. C. Stuart, E. Gann, W. Ma, W. You and H. Ade, Nat. Photonics, 2014, 8, 385–391 CrossRef CAS
.
- G. H. L. Heintges, J. J. van Franeker, M. M. Wienk and R. A. J. Janssen, Chem. Commun., 2016, 52, 92–95 RSC
.
Footnote |
| † Electronic supplementary information (ESI) available. See DOI: 10.1039/c9ra00816k |
| This journal is © The Royal Society of Chemistry 2019 |


