 Open Access Article
Electrochemical immunosensor based on an antibody-hierarchical mesoporous SiO2 for the detection of Staphylococcus aureus
Hongsu Wang,
Yi Xiu ,
Yan Chen,
Liping Sun,
Libin Yang,
Honghao Chen and
Xiaodi Niu*
College of Food Science and Engineering, Jilin University, Changchun 130062, People's Republic of China. E-mail: niuxd@jlu.edu.cn; Fax: +86-431-87836376; Tel: +86-431-87836376
First published on 24th May 2019
Abstract
The outbreak of food-borne pathogens has become a serious concern; therefore, the detection of pathogenic bacteria in food is required. Untreated, sensitive, and reliable sensors should be developed for the detection of Staphylococcus aureus (S. aureus). In this study, a sensitive antibody-based electrochemical immunosensor was developed using antibody (Ab)-hierarchical mesoporous silica (HMS) bio-conjugates for label-free detection of low concentrations of S. aureus. First, a bio-template method based on butterfly wings was used to prepare the HMS. Then, the carrier material was amino-functionalized to cross-link the antibody with glutaraldehyde. The Ab-HMS bio-conjugates were then immobilized on a glassy carbon electrode (GCE), and the presence of S. aureus was detected by analyzing the changes in the peak currents after the antigen–antibody complex formation. Differential pulse voltammetry (DPV) was performed with bacterial concentrations ranging from 10 to 2 × 10³ colony forming units (CFU) mL−1. Selective tests were performed using Escherichia coli (E. coli), Listeria monocytogenes (L. monocytohenes), and Salmonella, and the selective assays showed specific detection of S. aureus using the sensor. In addition, the immunosensor showed a good linear relationship between the peak current increase and logarithmic S. aureus concentration (R2 = 0.9759) with a fast detection time (20 min) and detection limit of 11 CFU mL−1. When the electrochemical impedance spectroscopy (EIS) was performed under the same conditions, the results showed a good linear relationship between the impedance change value and the bacterial concentration (R2 = 0.9720), the limit of detection (LOD) was 12 CFU mL−1. The performance of the sensor was compared with that of the colony counting method in the spiked milk sample test. The results showed no significant difference in the test results. Hence, this electrochemical immunosensor can be used to quickly detect S. aureus in actual food samples with a high sensitivity, specificity and stability.
1. Introduction
S. aureus is an important zoonotic pathogen, belonging to the genus Staphylococcus, a conditional pathogen that is parasitic on the surface of the host. It can cause food contamination and bacteria as an important microbiological indicator in food. S. aureus is often detected in foods, such as frozen foods, animal foods, and vegetable products. According to reports, 20 ng of enterotoxin secreted by S. aureus in food can cause mild poisoning. The detection of S. aureus is achieved by detecting Staphylococcus aureus enterotoxin (SE). Only a few studies have been applied to detect the amount of S. aureus without pretreatment.1 Therefore, a new method for detecting low concentrations of S. aureus is required.For many years, conventional detection methods have included plate counting, fluorescence quantitative polymerase chain reactions,2 enzyme-linked immunosorbent assays3 and mediated isothermal amplification techniques.4 These methods have been applied and approved; however, most methods are expensive and cannot meet the fast, accurate, and high-sensitivity requirements owing to the time and labor requirements.5 Therefore, a rapid, convenient, and sensitive detection method for the quantitative detection of S. aureus concentration is required to prevent infection.6
Electrochemical biosensors have been increasingly used in detection methods owing to their specificity, sensitivity, rapidity, and reproducibility.7–9 They are also regarded as important tools for monitoring and preventing pollution in food processing.10 Because of the specificity of the antibody and the faster reaction time of the antigen and antibody, the antibody can be used as a detection substance to specifically detect S. aureus. To improve the sensor performance, mesoporous nanomaterials can be used.11,12 Because of the high specific surface area and large pore volume,13 mesoporous nanomaterials are widely used in the fields of catalysis, medicine, and immobilization.14 The bio-template strategy has provided a new method for the synthesis of mesoporous silica.15 In recent years, functional nanomaterials have been prepared using bio-specific structures as templates.16 It effectively utilizes a wide variety of biological materials found in nature and transforms them into mesoporous nanomaterials with functions and properties suitable for a wide range of applications in tissue engineering, drug delivery systems, photocatalysis, optics, and especially gas sensing.17 Multi-stage pore nanomaterials can be widely produced by the biotemplate method,18 such as cotton,19,20 wood,21,22 sponges23,24 and butterfly wings.25 In this experiment, HMS was synthesized using sol–gel methods to replicate the microstructure of butterfly wings.
There are already many detection techniques applied to the quantitative detection S. aureus. S. aureus was detected using a surface plasmon resonance biosensor with lysed phage as a specific and selective probe. Abbaspour et al.26 developed an electrochemical immunosensor based on bis-aptamer to detect S. aureus with a detection limit of 1 CFU mL−1. Gómez et al.27 produced an enzyme biosensor for the detection of S. aureus with a detection limit of 100 CFU mL−1. However, the prepared sensors are complicated in the production steps, are prone to waste materials that pollute the environment, and are rarely able to be quickly detected.
S. aureus is pathogenic, so the detection of S. aureus is imminent. HMS has suitable pore sizes and functional groups that can be covalently bound to antibodies to enhance shelf stability. Rapid and efficient detection of S. aureus can be achieved by using HMS to prepare biosensors. In this experiment, the microscopic porous structure of butterfly (Papilio maackii) wings was replicated using the sol–gel method. The structure, morphology, and chemical composition of the prepared nanomaterials were characterized by various analytical techniques. Then, a chemical modification was used to bind the antibodies to the HMS. Specifically, the amino group was functionalized, and then, the antibody was cross-linked with glutaraldehyde to immobilize the antibody. The immobilized material was fixed on the surface of the GCE, and different concentrations of S. aureus were detected by DPV and EIS.28–30 The sensor is not only simple to manufacture, but also has a fast detection time and can detect S. aureus with low sensitivity, and the sensor has a long shelf life. The sensor concept is shown in Scheme 1.
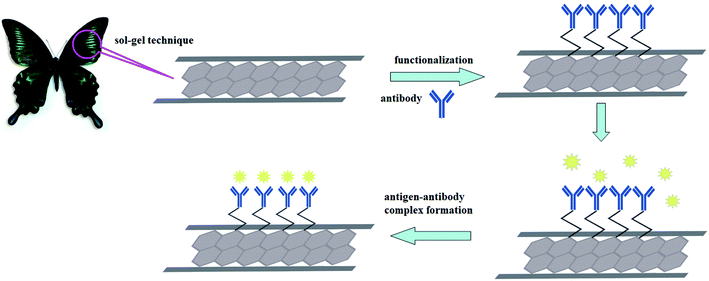 | ||
| Scheme 1 Schematic illustration of the preparation of electrochemical immunosensor based on an Ab-HMS materials. | ||
2. Experimental section
2.1. Materials
The butterfly species was Papilio maackii and was purchased from Beijing Jiaying Art Insect Museum. Hydrochloric acid (HCl), sodium hydroxide (NaOH), potassium hexacyano ferrate (K3[Fe(CN)6]), potassium chloride (KCl), toluene solution, titanium n-butoxide (TBT), cetyltrimethylammonium bromide (CTAB), absolute ethanol, tetraethyl orthosilicate (TEOS), glutaraldehyde (50%), dimethylformamide (DMF), tween solution, and PBS buffer solution (1×, pH 7.4) were purchased from Beijing Chemical Factory Reagents Company. 3-Aminopropyltriethoxysilane (98%) (APTES) was purchased from Alfa Aesar. For analytical purity, distilled water was used. S. aureus, E. coli, and L. monocytohenes were provided by the College of Animal Medicine, Jilin University. Rabbit anti-Staphylococcus aureus antibody (polyclonal antibody; ab20920) was purchased from Abcam (UK).2.2. Apparatus
The morphology and structure of the HMS were determined by scanning electron microscopy (SEM; JEOL Hitachi S-4800, Japan) and transmission electron microscopy (TEM; FEI Tecnai G2F30). The surface functional groups of the HMS were measured by Fourier-transform infrared (FTIR) spectroscopy (Shimadzu IR Prestige-21) using the conventional KBr pellet technique and X-ray photoelectron spectroscopy (XPS; SSI S-Probex). N2 adsorption–desorption isotherms were measured using a Micromeritics ASAP 2020 analyzer. Electrochemical experiments were carried out using a Chenhua CHI660E electrochemical workstation (CH Instruments, Shanghai, China). All electrochemical tests were recorded using a conventional three-electrode system, where a GCE, Ag/AgCl (3 M KCl) electrode, and Pt wire electrode were used as the working electrode, reference electrode, and counter electrode, respectively.2.3. Bacterial cultivation
S. aureus, E. coli, L. monocytohenes, and Salmonella were respectively cultured in an LB broth medium at 37 °C for 12 h in an incubator at 150 rpm. The optical density of the cultured bacteria was obtained at 600 nm using a UV-Vis spectrophotometer. Then, each enriched bacterial strain was centrifuged at 5000 rpm for 5 min at 25 °C. The supernatant was discarded, and a gradient was diluted with sterile PBS (0.1 M, pH = 7.4). Each step of this process was performed under aseptic conditions.2.4. Preparation of HMS and chemical modification
HMS was prepared by a surface sol–gel method using butterfly wings as a biological template and according to previous research methods. First, the butterfly wing specimens were dried, immersed in a 7.4% HCl solution for 4 h at room temperature, washed with distilled water, and dried at 80 °C. Then, the sample was immersed in a 6% NaOH solution at 60 °C for 3 h, washed with distilled water, and dried at 80 °C. The pretreated sample was immersed in an appropriate amount of TBT solution (100 mM titanium n-butoxide in 1![[thin space (1/6-em)]](https://www.rsc.org/images/entities/char_2009.gif) :
:![[thin space (1/6-em)]](https://www.rsc.org/images/entities/char_2009.gif) 1 toluene–ethanol (v/v)) to fix the butterfly shape, soaked for 20 min each time, rinsed with absolute ethanol and distilled water, and dried at 80 °C, repeating 3 times. At room temperature, 0.25 g CTAB was added into a mixture of 40 mL ethanol and 30 mL water, and the solution was stirred for approximately 30 min. Here, 150 mg of the treated samples were added to the mixture and stirred at room temperature for 1 h. After an ultrasonication treatment for 30 min, 120 μL of 1 M NaOH solution was injected into the mixture under stirring. Then, 0.5 mL TEOS was added dropwise to the mixture under vigorous stirring at room temperature. After stirring for 12 h, the sample was filtered, washed with water, and dried at 30 °C overnight. The prepared sample was calcined in air at 600 °C for 5 h to obtain a white powder, which was HMS.
1 toluene–ethanol (v/v)) to fix the butterfly shape, soaked for 20 min each time, rinsed with absolute ethanol and distilled water, and dried at 80 °C, repeating 3 times. At room temperature, 0.25 g CTAB was added into a mixture of 40 mL ethanol and 30 mL water, and the solution was stirred for approximately 30 min. Here, 150 mg of the treated samples were added to the mixture and stirred at room temperature for 1 h. After an ultrasonication treatment for 30 min, 120 μL of 1 M NaOH solution was injected into the mixture under stirring. Then, 0.5 mL TEOS was added dropwise to the mixture under vigorous stirring at room temperature. After stirring for 12 h, the sample was filtered, washed with water, and dried at 30 °C overnight. The prepared sample was calcined in air at 600 °C for 5 h to obtain a white powder, which was HMS.
Here, 0.5 g of HMS was weighed. Then, 50 mL of anhydrous toluene and excess APTES were added, and the mixture was refluxed at 120 °C for 16 h and cooled to room temperature. The powder was collected by filtration and then extracted with an ethanol extractor for 24 h to obtain HMS with amino groups (NH2-HMS).
Next, 0.2 g of NH2-HMS was dispersed in 30 mL of absolute ethanol, and 0.2 g of 50% glutaraldehyde was added and stirred at room temperature for 12 h. The solid samples were washed repeatedly, filtered with absolute ethanol, and dried in an oven to obtain NH2-HMS with aldehyde groups (A-NH2-HMS).
2.5. Combination of the antibody to HMS
2 mg of A-NH2-HMS were dispersed in 2 mL of DMF solution, sonicated for 2 h, and centrifuged at 5000 rpm for 30 min. The supernatant was removed, and 10 μL of the antibody were added. The reaction was carried out for 2 h at room temperature. After centrifugation at 15![[thin space (1/6-em)]](https://www.rsc.org/images/entities/char_2009.gif) 000 rpm for 10 min, the supernatant was discarded, and 1 mL of Tween-20 was added. The Ab-HMS bio-conjugate was vortexed and stored at 4 °C.
000 rpm for 10 min, the supernatant was discarded, and 1 mL of Tween-20 was added. The Ab-HMS bio-conjugate was vortexed and stored at 4 °C.
2.6. Preparation of electrochemical immunosensor
4 μL of the Ab-HMS bio-conjugate was dropped onto the surface of the GCE and incubated at room temperature for 20 min. The unbound antibody was washed off with PBS and dried at room temperature. Then, 4 μL of different concentrations of S. aureus PBS suspension were dropped onto the surface of the electrode at room temperature for 20 min. For the selectivity studies, the electrode was incubated with E. coli, L. monocytohenes, and Salmonella following the same protocol as that for S. aureus.2.7. Electrochemical characterization
DPV, electrochemical impedance spectroscopy (EIS) and cyclic voltammetry (CV) were performed using Autolab, potentiostat/galvanostat, and NOVA 1.10 software (Metrohms, Netherlands). All electrochemical measurements were performed at room temperature using 10 mM PBS containing 1 mM [Fe(CN)6]3−/4− and 0.1 M KCl. DPV, EIS and CV were performed for the electrochemical characterization of GCE, HMS-GCE, and Ab-HMS-GCE. All calculations and analyses were performed using Origin 8.51 software.3. Results and discussion
3.1. Physical characterization of HMS
As shown in Fig. 1A, at a lower magnification, the sample had a sheet-like morphology, and the organic ridges of the butterfly wings were visible on each sample of the sheet. The morphology distribution of each sheet sample was similar and uniform, which proved that the synthesis method used in this study improved the success rate. In the high magnification image (Fig. 1B), the structure of the scale surface of the butterfly wing was visible. The organic ridges were extended in parallel, and the structure between the ridges was porous. A circular hole having a diameter of approximately 1 μm was formed by the organic texture; therefore, the structure between the organic ridges looked like a network. The distance between the two parallel ridges was approximately 1 μm. The original shape of the butterfly wing was fixed during the synthesis process. Thus, the spine did not break, and it was a complete structure.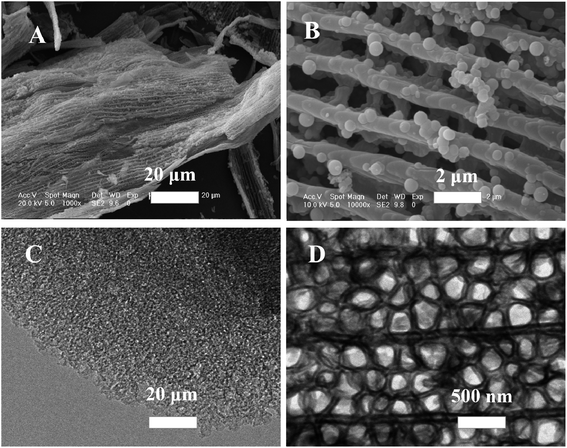 | ||
| Fig. 1 (A and B) Scanning electron micrographs and (C and D) transmission electron micrographs of synthesized HMS. | ||
TEM can effectively detect the type and structure of mesoporous material. From the TEM image (Fig. 1C and D), the morphological structure and scanning electron micrograph showed the same subtle structure.31 The complete structure of the silica replica is shown at a low magnification, and the dark and dense portion is the replica of the butterfly wing cylindrical structure. The thin area between the obsessive walls is a replica of the cellular tissue, and at a higher magnification, this replication structure is more visible.
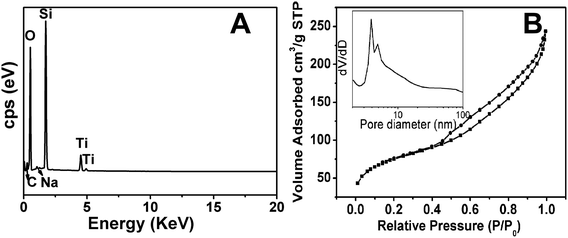
From the spectrum analysis (Fig. 2A), the material contained a large amount of O and Si elements, demonstrating that the material was a silica component. The titanium n-butoxide reagent was used to fix the butterfly wing morphology. Therefore, it contained a small amount of Ti elements. The trace amounts of C and Na elements could be owing to reagent washout and calcination; however, they had no effect on the experiment. The percentage of each element is known by EDS characterization and is listed in Table 1. It can be seen that the proportion of Si element and O element is the highest.
| Element | C | O | Na | Si | Ti |
|---|---|---|---|---|---|
| Atomic percentage (%) | 13.59 | 64.57 | 0.46 | 17.76 | 17.76 |
As shown in Fig. 2B, the nitrogen adsorption–desorption isotherm curve of HMS belonged to the type IV isotherm.32 The isotherms all corresponded to capillary condensation at a p/p0 value of approximately 0.43. A distinct H1 hysteresis loop appeared between 0.43–1.0, which indicated that the pore size of the HMS was uniform, and the permeability of the mesopores was good.33 When the p/p0 value was small, single/multilayer adsorption occurred inside the pores, and the gas adsorption amount increased slowly. As the p/p0 value increased, the gas adsorption amount rapidly increased, and gas multi-layer adsorption occurred in the material. The HMS had a specific surface area of 257.0213 m2 g−1, a pore diameter of 1.03 nm, and a pore volume of 0.33 cm3 g−1. The material had a mesoporous structure.34
Fig. 3 shows the change in the group during the binding of the carrier material to the antibody (recorded in the range of 4000 cm−1 to 500 cm−1). In spectrum (a), the strong and broad absorption band at 1083 cm−1 indicates the antisymmetric absorption vibration of Si–O–Si.35,36 The peaks at 475 cm−1 and 799 cm−1 are caused by the bending vibration and symmetric stretching vibration of Si–O–Si, respectively. The absorption band at 961 cm−1 is attributed to the bending vibration of Si–OH. These are characteristic absorption peaks of silica and proved that there were hydroxyl groups on the surface of the HMS, allowing the possibility of subsequent group modification.36 In spectrum (b), the absorption peaks at 1547 cm−1 and 1650 cm−1 are owing to the C![[double bond, length as m-dash]](https://www.rsc.org/images/entities/char_e001.gif) N stretching vibration, thereby demonstrating that amino groups were successfully grafted on the surface of the HMS. For spectrum (c), the absorption peak at 1650 cm−1 gradually narrowed and weakened, and the disappearance of the absorption band at 1547 cm−1 was owing to the grafting of the glutaraldehyde aldehyde group and amino bond reaction. In spectrum (d), the same phenomenon as that in spectrum (c) was shown, because the grafted aldehyde group was chemically bonded to the amino group on the antibody, indicating that the antibody was successfully immobilized on the HMS.37
N stretching vibration, thereby demonstrating that amino groups were successfully grafted on the surface of the HMS. For spectrum (c), the absorption peak at 1650 cm−1 gradually narrowed and weakened, and the disappearance of the absorption band at 1547 cm−1 was owing to the grafting of the glutaraldehyde aldehyde group and amino bond reaction. In spectrum (d), the same phenomenon as that in spectrum (c) was shown, because the grafted aldehyde group was chemically bonded to the amino group on the antibody, indicating that the antibody was successfully immobilized on the HMS.37
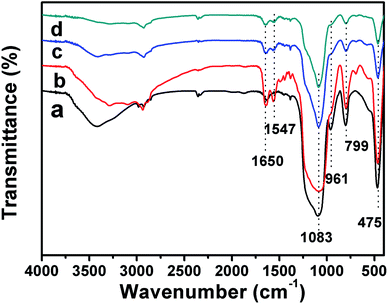 | ||
| Fig. 3 Fourier-transform infrared (FT-IR) spectra of (a) HMS, (b) NH2-HMS, (c) A-NH2-HMS and (d) Ab-HMS. | ||
Fig. 4 shows the elemental composition of HMS and Ab-HMS and the electronic states of the elements. HMS mainly contains Si, C, and O elements, which is the same as the EDX characterization. It can be seen from Fig. 4B that Ab-HMS contains not only three elements of Si, C, and O but also an element of N, since the bound antibody has an amino group, thereby introducing an N element. Fig. 4C shows the energy spectrum of C 1s in Ab-HMS. The high-resolution peaks are 288.4, 289.03, 290.31, and 292 eV, respectively, corresponding to the forms of –C![[double bond, length as m-dash]](https://www.rsc.org/images/entities/char_e001.gif) O, C–O, C–Si, and C–Na. In Fig. 4B, the peak at 398.85 eV originates from the nitrogen atom in the sp3 configuration, and the peak at 399.62 eV originates from sp2, which corresponds to the amide bond. And the peak at 401.28 eV is attributed to the presence of –NH2. It can be proved that the antibody and the mesoporous material are covalently bonded through the amide bond, thereby improving the stability of the immobilization.38,39
O, C–O, C–Si, and C–Na. In Fig. 4B, the peak at 398.85 eV originates from the nitrogen atom in the sp3 configuration, and the peak at 399.62 eV originates from sp2, which corresponds to the amide bond. And the peak at 401.28 eV is attributed to the presence of –NH2. It can be proved that the antibody and the mesoporous material are covalently bonded through the amide bond, thereby improving the stability of the immobilization.38,39
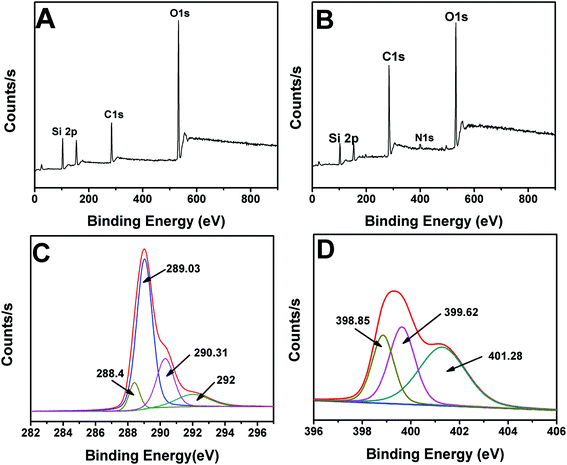 | ||
| Fig. 4 The X-ray photoelectron spectrum (XPS) of HMS (A), Ab-HMS (B), C 1s (C) and N 1s (D) spectra of Ab-HMS. | ||
3.2. Functionalized electrode characterization
An electrochemical characterization was performed using DPV and EIS with K3[Fe(CN)6] as the electron transfer medium. As shown in Fig. 5A, the polished GCE had a peak current value of 500 μA. When the HMS was added, the surface of the electrode was not smooth. Thus, the peak current value dropped significantly, and when the Ab-HMS bio-conjugate was added to the electrode surface, the peak current value decreased again. Because the electron transfer behavior was blocked after the antibody was immobilized, the current value decreased again. The impedance measurement results were in good agreement with the DPV measurement results. The impedance value is represented by the diameter of the measurement circle. From Fig. 5B, the impedance spectrum of the bare GCE is a straight line,40 and the impedance value of the HMS-GCE is less than that of Ab-HMS-GCE.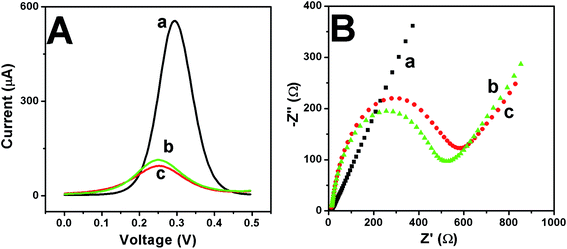 | ||
| Fig. 5 DPV (A) and EIS (B) in the presence of 1 mM [Fe(CN)6]3−/4− as the redox medium for characterization of GCE (a), HMS-GCE (b) and Ab-HMS-GCE (c). | ||
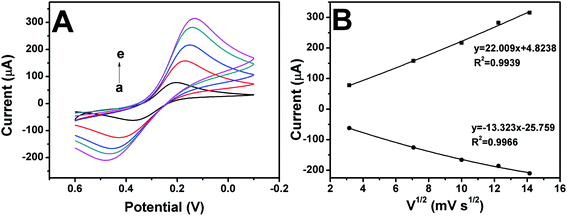
In order to more fully demonstrate that the conjugate was successfully immobilized on the GCE surface, GCE, HMS-GCE and Ab-HMS-GCE were subjected to cyclic voltammetry (CV) to detect electrical signals. As shown in Fig. 6, GCE had a pair of obvious in solution. The redox peak, while HMS-GCE due to the low conductivity of silica, the redox peak is not as clear as the bare electrode. After the immobilization of the antibody, the redox peak is most pronounced, which is consistent with the results of DPV and EIS. Fig. 7 shows CV of the biosensor at a scan speed of 10, 50, 100, 150, 200 mV s−1. It can be seen from Fig. 7A that the peak current of the sensor increases as the scanning speed increases. Fig. 7B shows that the peak current value is linear with the square root of the scan speed, and the correlation coefficients are all greater than 0.99. It is demonstrated that the working electrode has an electrocatalytic behavior and the electron transfer process of the surface is controlled to diffuse diffusion, thereby providing sufficient electron accessibility to shuttle between the antibody and the electrode.8,11
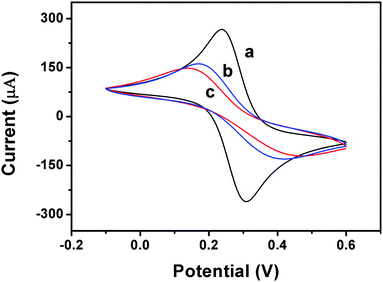 | ||
| Fig. 6 CV in the presence of 1 mM [Fe(CN)6]3−/4− as the redox medium for characterization of GCE (a), HMS-GCE (b) and Ab-HMS-GCE (c). | ||
3.3. Experimental conditions optimization
As shown in Fig. 8A, when the incubation time was 20 min, the response current of the sensor reached its maximum value, and as time increased, the current value decreased slightly. This could be because of the excessive exposure to air, which created other substances on the surface of the electrode, reducing the electrode sensitivity and response current. As shown in Fig. 8B, when the antibody concentration reached 4 mg mL−1, the response current of the sensor reached the maximum value. Therefore, when the S. aureus test was performed, the concentration of the loaded antibody was 4 mg mL−1.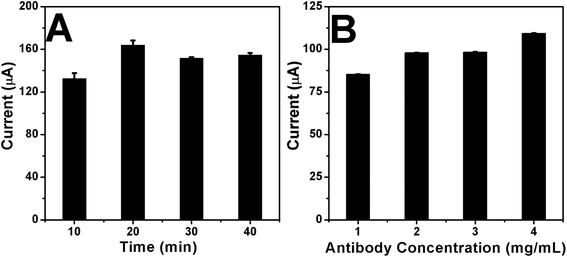 | ||
| Fig. 8 (A) Response time studies for interaction of S. aureus with Ab-HMS-GCE modified surface and (B) study on the interaction between S. aureus and different antibody concentrations. | ||
3.4. Differential pulse voltammogram of S. aureus detection
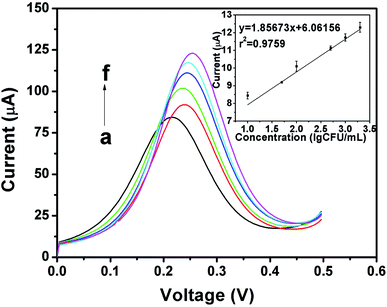
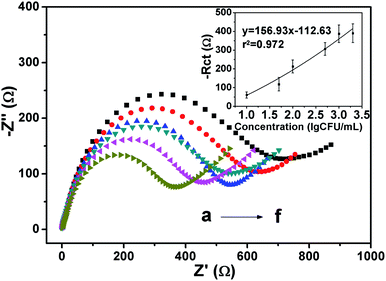
In Fig. 9, when the concentration of bacteria was in the range of 10 to 2 × 10³ CFU mL−1, a linear relationship between the peak current and logarithmic S. aureus concentration was observed, and the correlation coefficient R2 was 0.9759. The limits of detection (LOD) was calculated according to the signal-to-noise ratio method. The coefficient was 3, and the standard deviation was 0.005 in blank PBS. The LOD was 11 CFU mL−1, which is more sensitive than that of previous studies. Neha Bhardwaj et al. developed an MOF-based phage sensor for the detection of S. aureus with a detection limit of 31 CFU mL−1.41 Ward et al. used screen-printed carbon electrodes to detect S. aureus, and the lowest detection concentration was 1.8 × 10 6 CFU mL−1,42 which was higher than the minimum detection concentration of the sensor designed in this study.DPV was used to detect the concentration of S. aureus. As shown in Fig. 9, as the concentration increased, the peak current value also increased. According to previous reports,43 the reason for the increase of current with increase in the concentration of bacteria could be the conformational change of the cells and the antigen–antibody complex formed during the binding process could cause the current increase, which cause changes in the electrode's surface conductivity. Because bacterial electrochemical reactions are produced exclusively by extracellular electrons, when the droplets of the bacteria are on the surface of the electrode, the antigen specifically reacts with the antibody, and the contents of the cells flow out, including some electrolytes and conductive metal ions that are deposited on the surface of the electrode. This enhances the conductivity of the whole cell and causes an increase in the electrochemical peak current with an increasing S. aureus concentration.25 The larger specific surface area of the nano-mesoporous material loads more antibodies, which makes the reaction more thorough. When the potential is increased during the electrochemical detection process, the surrounding environment becomes unfavorable to the cells, and teichoic acid in the cell wall will start to accumulate cations in the PBS solution,44 including hydrogen ions. Therefore, the conductivity will increase, and the hydrogen ions will affect the pH of the solution. Because the pH also affects the peak position during the detection process, different concentrations of bacteria will have slightly different peak positions during DPV detection.45 In order to verify the accuracy of the reaction mechanism of this experiment, EIS detection method was used to quantitatively detect S. aureus under the same conditions. As shown in the Fig. 10, as the concentration of bacteria increased, the electron transport ability of the electrode surface increased. Therefore, the electrode resistance is reduced. There is a good linear relationship between the resistance difference and the bacterial concentration (R2 = 0.9720), the LOD is 12 CFU mL−1 (S/N = 3) which is consistent with the DPV detection trend, so the experimental principle of the experiment is proved to be accurate, and the sensor can be applied to the quantitative detection experiment of S. aureus.29,30 Table 2 lists the detection results of several S. aureus biosensors. The sensors designed in this study were superior to the other detection methods in terms of the detection range and detection limit.
| Purposed biosensor | Detection method | Linear range (CFU mL−1) | LOD (CFU mL−1) | Ref. |
|---|---|---|---|---|
| Potentiometric biosensor | Potentiometric titration | 2.3 × 10³ to 2 × 10⁴ | 800 | 46 |
| Colorimetric biosensor | Colorimetry | 75 to 7.5 × 10⁶ | 40 | 47 |
| Electrochemiluminescent biosensor | Electrochemiluminescent | 1.0 × 10³ to 1.0 × 10⁹ | 3.1 × 10² | 48 |
| MOF–bacteriophage biosensor | Immunofluorescence | 40 to 4 × 10⁸ | 31 | 41 |
| Impedimetric biosensor | EIS | 102 to 106 | 100 | 49 |
| Electrochemical immunosensor biosensor | DPV | 10 to 2 × 10³ | 11 | This work |
3.5. Direct measurement of S. aureus in whole milk
To evaluate the performance of the sensor in food, the bacterial concentration in the same milk sample was detected by the colony counting method and sensor, and the test results are listed in Table 3. The biosensor measurement results were not significantly different from those measured by the plate count method, indicating that the sensor could be applied to actual sample detection. The conventional flat panel counting method has a long operation time and cumbersome processing steps. In contrast, the sensors designed in this study do not require pre-processing and are quick and easy to operate. Therefore, the sensors can be applied to other actual sample inspections.| Whole milk sample | Spike (CFU mL−1) | Measured value (CFU mL−1) | Spiked recovery (%) |
|---|---|---|---|
| a Data expressed as mean ± standard deviation (average of three replications for S. aureus). | |||
| 1 | 42 | 38 ± 0.02 | 90% |
| 2 | 144 | 132 ± 0.08 | 92% |
| 3 | 240 | 234 ± 0.08 | 97% |
| 4 | 1102 | 1122 ± 0.21 | 102% |
3.6. Specificity determination
The PBS of different bacteria (E. coli, L. monocytohenes, and Salmonella) was added to the surface of the sensor to test the specificity at a concentration of 102 CFU mL−1. As shown in Fig. 11, the current change of S. aureus was larger than that of other bacteria of the same concentration, indicating that the sensor had a good specificity for S. aureus.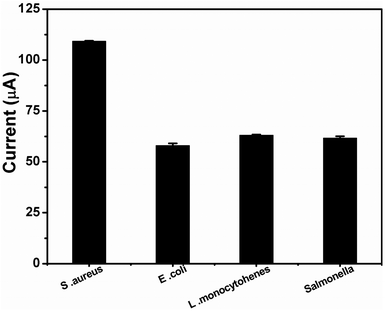 | ||
| Fig. 11 Histogram depicting the selectivity of immunosensors for S. aureus, E. coli, L. monocytohenes and Salmonella. | ||
3.7. Stability test
The prepared working electrode was stored at 4 °C when not use. S. aureus (2 × 10³ CFU mL−1) was used to study the stability of the sensor for 15 days. No significant change in current was observed after 5 days of storage. The relative standard deviation was 0.54%, retaining 90.09% of the initial current. After 10 days of storage, the relative standard deviation was 0.91%, retaining 84.47% of the initial current. After 15 days, the relative standard deviation was 2.19%, and 81.41% of the initial current was retained. Based on these stability data, we can conclude that the biosensor prepared in this experiment has good stability.4. Conclusions
In this study, a sensitive electrochemical immunosensor for label-free S. aureus detection was developed using antibodies covalently bound to HMS. The preparation of HMS by the biological template method could successfully replicate the multi-stage pore structure of butterfly wings and protect the environment without generating other waste materials. Using antibodies as the detection elements, the concentration range of detection was greatly reduced. The use of the Ab-HMS conjugates increased the sensitivity and specificity of the immunosensor. This electrochemical immunosensor had good selectivity and a fast detection time (20 min) with a sensitive detection limit of 11 CFU mL−1 and a concentration range of 10 to 2 × 10³ CFU mL−1 by using DPV detection. At the same time, when the EIS is tested under the same conditions, the same trend as the DPV is obtained, and there is a good linear relationship between the resistance difference and the bacterial concentration (R2 = 0.9720), which proves that the sensor has a reliable application prospect. The covalent bonding between the carrier material and the antibody utilizes both preparation time and improved sensor stability. The sensor device can be stabilized for 15 days. This study has the potential to quantify low concentrations of foodborne bacteria with a high sensitivity and selectivity in the food and environmental safety field.Conflicts of interest
The authors declare no conflict of interest.Acknowledgements
This work was supported by National Nature Science Foundation of China [Grant No. 31572566 and 31872525 to X. D. N], the Key Program of Jilin Province [Grant No. 20180201044NY], and Jilin Educational Committee [Grant No. 3D518L714071].References
- H. Wang, R. Luo, Y. Chen, Q. Si and X. Niu, J. Electron. Mater., 2018, 47, 4124–4135 CrossRef CAS.
- C. Letertre, S. Perelle, F. Dilasser and P. Fach, Mol. Cell. Probes, 2003, 17, 139–147 CrossRef CAS.
- X. Meng, G. Yang, F. Li, T. Liang, W. Lai and H. Xu, ACS Appl. Mater. Interfaces, 2017, 9, 21464–21472 CrossRef CAS PubMed.
- H. Yang, X. Ma, X. Zhang, Y. Wang and W. Zhang, Eur. Food Res. Technol., 2011, 232, 769–776 CrossRef CAS.
- S. Ranjbar and S. Shahrokhian, Bioelectrochemistry, 2018, 123, 70–76 CrossRef CAS PubMed.
- S. Wang, W. Deng, L. Yang, Y. Tan, Q. Xie and S. Yao, ACS Appl. Mater. Interfaces, 2017, 9, 24440–24445 CrossRef CAS PubMed.
- X. Xie, L. Rieth, S. Merugu, P. Tathireddy and F. Solzbacher, Appl. Phys. Lett., 2012, 101, 93702 CrossRef PubMed.
- R. Chauhan, J. Singh, P. R. Solanki, T. Manaka, M. Iwamoto, T. Basu and B. D. Malhotra, Sensor. Actuator. B Chem., 2016, 222, 804–814 CrossRef CAS.
- J. Singh, A. Roychoudhury, M. Srivastava, P. Solanki, D.-W. Lee, S. Hee Lee and B. Malhotra, J. Mater. Chem. B, 2013, 1, 4493–4503 RSC.
- M. Rubab, H. M. Shahbaz, A. N. Olaimat and D.-H. Oh, Biosens. Bioelectron., 2018, 105, 49–57 CrossRef CAS PubMed.
- P. R. Solanki, J. Singh, B. Rupavali, S. Tiwari and B. D. Malhotra, Mater. Sci. Eng. C, 2017, 70, 564–571 CrossRef CAS PubMed.
- R. Chauhan, J. Singh, P. R. Solanki, T. Basu, R. O'Kennedy and B. D. Malhotra, Biochem. Eng. J., 2015, 103, 103–113 CrossRef CAS.
- T. Kaneko, F. Nagata, S. Kugimiya and K. Kato, Ceram. Int., 2018, 44, 20581–20585 CrossRef CAS.
- B. Yang, Y. Chen and J. Shi, Adv. Healthc. Mater., 2018, 7, 1800268–1800278 CrossRef PubMed.
- Y. Zhang, X. Liu and J. Huang, ACS Appl. Mater. Interfaces, 2011, 3, 3272–3275 CrossRef CAS PubMed.
- T.-X. Fan, S.-K. Chow and D. Zhang, Prog. Mater. Sci., 2009, 54, 542–659 CrossRef CAS.
- I. Cho, K. Kang, D. Yang, J. Yun and I. Park, ACS Appl. Mater. Interfaces, 2017, 9, 27111–27119 CrossRef CAS PubMed.
- E. Dujardin and S. Mann, Adv. Eng. Mater., 2002, 4, 461–474 CrossRef CAS.
- J. Ma, H. Fan, X. Ren, C. Wang, H. Tian, G. Dong and W. Wang, ACS Sustainable Chem. Eng., 2019, 7, 147–155 CrossRef CAS.
- X. Lin, X. Wang, L. Li, M. Yan and Y. Tian, ACS Sustainable Chem. Eng., 2017, 5, 9709–9717 CrossRef CAS.
- Q. Fu, F. Ansari, Q. Zhou and L. A. Berglund, ACS Nano, 2018, 12, 2222–2230 CrossRef CAS PubMed.
- L. A. Berglund and I. Burgert, Adv. Mater., 2018, 30, 1–15 CrossRef PubMed.
- Y. Ding, J. Yang, C. R. Tolle and Z. Zhu, ACS Appl. Mater. Interfaces, 2018, 10, 16077–16086 CrossRef CAS PubMed.
- J. G. Kim, M. C. Cha, J. Lee, T. Choi and J. Y. Chang, ACS Appl. Mater. Interfaces, 2017, 9, 38081–38088 CrossRef CAS PubMed.
- J. Bhardwaj, S. Devarakonda, S. Kumar and J. Jang, Sensor. Actuator. B Chem., 2017, 253, 115–123 CrossRef CAS.
- A. Abbaspour, F. Norouz-Sarvestani, A. Noori and N. Soltani, Biosens. Bioelectron., 2015, 68, 149–155 CrossRef CAS PubMed.
- V. Escamilla-Gómez, S. Campuzano, M. Pedrero and J. M. Pingarrón, Anal. Bioanal. Chem., 2008, 391, 837–845 CrossRef PubMed.
- H. Cao, D.-P. Yang, D. Ye, X. Zhang, X. Fang, S. Zhang, B. Liu and J. Kong, Biosens. Bioelectron., 2015, 68, 329–335 CrossRef CAS PubMed.
- S.-L. Zhong, J. Zhuang, D.-P. Yang and D. Tang, Biosens. Bioelectron., 2017, 96, 26–32 CrossRef CAS PubMed.
- C. Hu, D.-P. Yang, K. Xu, H. Cao, B. Wu, D. Cui and N. Jia, Anal. Chem., 2012, 84, 10324–10331 CrossRef CAS PubMed.
- G. O. Park, J. Yoon, S. B. Park, Z. Li, Y. S. Choi, W.-S. Yoon, H. Kim and J. M. Kim, Small, 2018, 14, 1702985 CrossRef PubMed.
- J. Zong, Y. S. Zhang, Y. Zhu, Y. Zhao, W. Zhang and Y. Zhu, Sensor. Actuator. B Chem., 2018, 271, 311–320 CrossRef CAS.
- P. Verma, K. Yuan, Y. Kuwahara, K. Mori and H. Yamashita, Appl. Catal. B Environ., 2018, 223, 10–15 CrossRef CAS.
- D. Breznan, D. D. Das, C. MacKinnon-Roy, S. Bernatchez, A. Sayari, M. Hill, R. Vincent and P. Kumarathasan, ACS Nano, 2018, 12, 12062–12079 CrossRef CAS PubMed.
- W. Shan, D. Zhang, X. Wang, D. Wang, Z. Xing, Y. Xiong, Y. Fan and Y. Yang, Microporous Mesoporous Mater., 2019, 278, 44–53 CrossRef CAS.
- D. M. Eby, K. Artyushkova, A. K. Paravastu and G. R. Johnson, J. Mater. Chem., 2012, 22, 9875–9883 RSC.
- D. M. Eby, K. Artyushkova, A. K. Paravastu and G. R. Johnson, J. Mater. Chem., 2012, 22, 9875–9883 RSC.
- X. Meng, G. Yang, F. Li, T. Liang, W. Lai and H. Xu, ACS Appl. Mater. Interfaces, 2017, 9, 21464–21472 CrossRef CAS PubMed.
- S. Zhu, D. Zhang, Z. Li, H. Furukawa and Z. Chen, Langmuir, 2008, 24, 6292–6299 CrossRef CAS PubMed.
- R. Jain, N. Jadon and A. Pawaiya, Trac. Trends Anal. Chem., 2017, 97, 363–373 CrossRef CAS.
- N. Bhardwaj, S. K. Bhardwaj, J. Mehta, K.-H. Kim and A. Deep, ACS Appl. Mater. Interfaces, 2017, 9, 33589–33598 CrossRef CAS PubMed.
- A. C. Ward, A. J. Hannah, S. L. Kendrick, N. P. Tucker, G. MacGregor and P. Connolly, Biosens. Bioelectron., 2018, 110, 65–70 CrossRef CAS PubMed.
- W. Hertl, Bioelectrochem. Bioenerg., 1987, 17, 89–100 CrossRef CAS.
- J. G. Swoboda, J. Campbell, T. C. Meredith and S. Walker, ChemBioChem, 2010, 11, 35–45 CrossRef CAS PubMed.
- S. Kumar, J. G. Sharma, S. Maji and B. D. Malhotra, J. Phys.: Conf. Ser., 2016, 6, 10 Search PubMed.
- J. Okuno, K. Maehashi, K. Kerman, Y. Takamura, K. Matsumoto and E. Tamiya, Biosens. Bioelectron., 2007, 22, 2377–2381 CrossRef CAS PubMed.
- G. A. R. Y. Suaifan, S. Alhogail and M. Zourob, Biosens. Bioelectron., 2017, 90, 230–237 CrossRef CAS PubMed.
- H. Yue, Y. Zhou, P. Wang, X. Wang, Z. Wang, L. Wang and Z. Fu, Talanta, 2016, 153, 401–406 CrossRef CAS PubMed.
- X. Liu, M. Marrakchi, D. Xu, H. Dong and S. Andreescu, Biosens. Bioelectron., 2016, 80, 9–16 CrossRef CAS PubMed.
| This journal is © The Royal Society of Chemistry 2019 |

