 Open Access Article
Continuous microfluidic fabrication of polypyrrole nanoparticles†
Elham Effatia,
Behzad Pourabbas *a and
Mohammad Sadegh Zakerhamidi
 b
b
aDept. of Polymer Engineering, Nanostructured Materials Research Center, Sahand University of Technology, Tabriz, Iran. E-mail: pourabas@sut.ac.ir; Fax: +98 41 3344 4313; Tel: +98 41 3345 9083
bResearch Institute for Applied Physics and Astronomy, University of Tabriz, Tabriz, Iran
First published on 30th May 2019
Abstract
Polypyrrole (PPy) nanoparticles were synthesized successfully by oxidation polymerization in droplets by microfluidic system. The oxidizing agent ammonium persulfate was added at various molar ratios with respect to the monomer. The details of the procedure, droplet formation inside the channel and the effects of various factors are described. The method is a fast and continuous way for the synthesis of PPy. Products were characterized using Fourier-transform infrared spectroscopy, field emission scanning electron microscopy, transmission electron microscopy, X-ray diffraction, thermal gravimetric analysis, cyclic voltammetry, electrochemical impedance spectroscopy and photoluminescence spectroscopy.
1. Introduction
Since the development of polypyrrole (PPy) in 1979 (ref. 1) many researches have been conducted on synthesizing and optimizing the properties of the polymer. Among the various conducting polymers, PPy has gained a lot of interest due to its tunable electrical conductivity, environmental and thermal stability, biocompatibility and potential applications in a diversity of fields.2,3 The synthesis of PPy is possible by two major methods including chemical and electrochemical synthesis.4 Although, the properties of the final polymer depend on the synthesis method, the processability is still the general issue.5 In this regard, micro and nanostructured conducting polymers have been considered as a solution for this challenge.6 Although the properties and potentials of PPy are well known, to date, PPy nanoparticles have been synthesized using self-assembly or template methods, in which, obviously, no precise control over the size and morphology can be employed.7 Among several available methods for the synthesis of polymers, one of the most newly developed and interesting is the synthesis in microfluidic channels or microfluidic polymerization.8 Generally in microfluidics, the rapid mixing of the reagents that provides homogeneous reaction environment, the continuous variation of the reaction conditions, and the possibility of adding other necessary reagents at precise time have made it an attractive technology for a myriad of applications. Over the past decade, microfluidics allowed the screening of a variety of reaction conditions by the systematic tuning of the flow rates, temperature, and reactant concentrations in order to optimize the quality of the resulting products, while still using very small amounts of the reagents. Simultaneously, there has been an increasing interest in the development of novel nano- and micro-particle technologies for drug delivery, imaging, bioanalysis, photonics, and optoelectronic applications. The convergence of microfluidic and particle technologies has shown considerable promises allowing for the emergence of novel inorganic products with narrow size distribution or distinct shapes.7 However, relatively little has been done for the microfluidic synthesis of organic nanoparticles,9 such as polymer nanoparticles via polymerization reactions. Therefore, beyond the attempts towards microfluidic polymerization,8,10–12 a limited number of studies have been published on the synthesis of conducting polymers in microchannels.7 For microfluidic polymerization, many potential advantages have been reported, including monodisperse spherical particles within a range of sizes, higher purity, the continuity of the process, and the possibility of the layer by layer coating of the particles.7 However, there are some crucial issues with microfluidic polymerizations, where the solidification of the polymer inside the channels is the most important. One solution for the latter problem is by carrying out the polymerization in droplets moving alongside the microfluidic system. Therefore, microfluidics with T-junctions are necessary to create droplets in a moving main stream liquid. Two immiscible liquids are required, so that one is forced into the second liquid through the inlet at the T-junction. If the flow rates of the liquids are adjusted properly, the droplet formation will be rapid, reproducible, and with size and shape controlled.13 In this study, an in-droplet polymerization of pyrrole (Py), a conducting polymer with a fast redox polymerization kinetics producing solid insoluble polypyrrole (PPy), has been disclosed. The droplets are aqueous solution of the necessary chemicals including polymerization initiator being formed in the second flowing organic phase containing monomer.Different relative molar concentrations of monomer with respect to initiator were examined so that oxidant (ammonium persulfate) to monomer (Py) relative concentration could affect the morphology, chemical structure, and conductivity of the PPy products. The polymerization occurred via the diffusion of monomer from the outer organic phase into the aqueous droplets. The designed and constructed microchannel system consisted of a long tube with two T-shape entrances made of silicone rubber. The detailed specifications and channel formation procedure in addition to the flow rate optimization to achieve the desired droplets were investigated and described in another publication.14 The microfluidic procedure provided an inexpensive, fast, one-step synthesis route for the fabrication of PPy particles with the control over size and functionality, offering a simple platform to encapsulate biomolecules for sensing and controlled drug release applications.
In addition to the synthesis in microchannel, PPy samples were characterized and compared with PPy obtained by a regular oxidation polymerization.
2. Experimental
2.1. Materials
Sylgard 184 silicone elastomers kits (polydimethylsiloxane, PDMS, and curing agent) were purchased from Dow Corning Co (Midland, MI). Commercial Nylon (3m3 fishing line, China) with microwire diameters of 150 and 800 μm were used. Ammonium persulfate (APS), sodium sulfate, pyrrole, hexadecane, chloroform, diisopropylamine and ethanol were purchased from Merck (Germany). Span®80 was purchased from Sigma-Aldrich as a surfactant. Pyrrole monomer was distilled before use. All the other reagents were used as received. Digitally operated syringe pumps (Injectomat Agilia, Fresenius Kabi, France) were used for the injection of reactants in a constant flow rate.2.2. Fabrication of microfluidic device
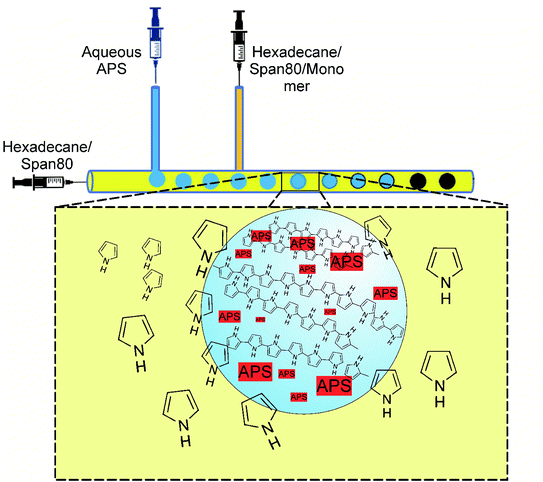
The double T-junction microfluidic reactor (Fig. 1) was fabricated with PDMS by wire molding method as described in more details in a previously published study.14 Briefly, a wire was fixed and stretched to its full length inside the semi-cylindrical mold cavity. Then, the degassed PDMS mixture was poured inside the cavity so that the wire behaved like the core axis of the cylinder. PDMS was cured at 100 °C for 35 min according to the product data sheet. Finally, the cured PDMS was immersed in 70/30 (v/v) mixture of chloroform/diisopropylamine to swell the polymer for the easier removal of the wire. The main channel diameter was 800 μm, while the side channels were 150 μm in diameter.2.3. Polymerization in microchannel reactor and in-bulk for comparison
The polymerization was carried out in droplets formed within the microchannel, as is shown in Fig. 1. The droplet formation and all the involved parameters were investigated and published elsewhere.15 Two immiscible liquids were used, where the first one consisted of hexadecane and a surfactant (continuous phase), while the second phase was an aqueous APS (oxidizing agent). From side channel 1, the aqueous APS was introduced with a controlled flow rate into hexadecane streaming through the main channel under controlled flow rate. Therefore, due to the insolubility of aqueous APS in hexadecane, droplets were formed and moved by moving hexadecane. The monomer was injected into hexadecane via side channel 2. The polymerization was performed by the diffusion of pyrrole from hexadecane into the APS droplets as they moved along the main channel, which was evidenced by the change in color from colorless to dark. The driving force for monomer diffusion was of course the concentration profile,16 which decreased from the main stream phase towards the droplet surface and the inside of the droplet, in which the polymerization occurred.The mechanism of PPy formation was the redox polymerization that started from APS and cation-radical formation, followed by the coupling of the radicals as is shown in Scheme 1.16–18 APS is one of the mostly used oxidizing agent, however, other chemicals, such as FeCl3, can also be used.
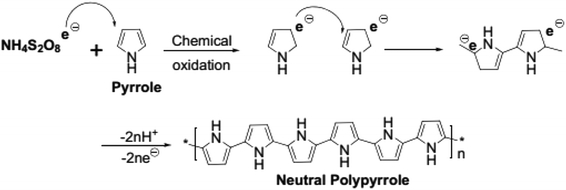 | ||
| Scheme 1 Chemical oxidative polymerization of pyrrole (adapted from ref. 18). | ||
In a typical synthesis, the continuous phase consisting of hexadecane and Span®80 (20 wt%) started to pass through the main channel with a controlled flow rate (Fig. 1). Aqueous solution of APS (0.4 M) was injected through the first side channel forming uniform micro droplets of APS solution within hexadecane. Through the second side channel, a solution of pyrrole in hexadecane and Span®80 (20 wt%) was introduced. By moving the droplets inside the channel, the polymerization was taking place inside the droplets by the diffusion of the monomers and changing the color of the droplets to dark greenish. At the end of the channel, the solidified droplets were collected in a beaker, which were washed successively by ethanol and distilled water after filtration. The product was dried for 24 h under reduced pressure at 60 °C. The flow rates play an important role in the droplet formation, size, moving speed and residence time inside the channel, which in turn depend on the polymerization kinetics. The implied flow rates were indeed the optimized flow rates found in several trials. In the ESI,† videos and snapshots are provided to visualize the polymerization process taking place inside the channels. In the supported multimedia files, the sizes of the droplets moving alongside the microchannel are clearly visible, while the color of the droplets changes as polymerization proceeds.
In order to compare the in-microchannel synthesized PPy with that obtained from the traditional bulk synthesis, a simulated bulk synthesis of PPy was carried out in a beaker using the same reagents. To a solution of Span®80 (20 wt%) in hexadecane, an aqueous solution of APS (0.4 M) was added under stirring. Then, a solution of pyrrole in hexadecane containing Span®80 (20 wt%) was added and the polymerization was continued for 2 h at room temperature. The precipitate was filtered, washed and dried according to the method described for in-microchannel synthesis. Table 1 summarizes the experimental conditions and the encoding system of the samples.
| Sample code | APS/pyrrole molar ratio | Droplet size (ave.) | Flow ratea | Temperature |
|---|---|---|---|---|
| a Phase 1 = hexadecan + Span®80, phase 2 = aqueous APS, and phase 3 = phase 1 + monomer. | ||||
| Pmic11 | 1![[thin space (1/6-em)]](https://www.rsc.org/images/entities/char_2009.gif) : :![[thin space (1/6-em)]](https://www.rsc.org/images/entities/char_2009.gif) 1 1 |
555 μm | Phase 1 = 3 mL h−1, phase 2 = 0.1 mL h−1, phase 3 = 3.1 mL h−1 | RT |
| Pmic21 | 2![[thin space (1/6-em)]](https://www.rsc.org/images/entities/char_2009.gif) : :![[thin space (1/6-em)]](https://www.rsc.org/images/entities/char_2009.gif) 1 1 |
560 μm | The same as Pmic11 | RT |
| Pmac21 | 2![[thin space (1/6-em)]](https://www.rsc.org/images/entities/char_2009.gif) : :![[thin space (1/6-em)]](https://www.rsc.org/images/entities/char_2009.gif) 1 1 |
— | Bulk and batch system | RT |
2.4. Characterization
Fourier-transform infrared (FTIR) spectroscopy was performed using KBr pellets on a Bruker Tensor 27 FT-IR spectrometer. The morphological investigation was performed using a Tescan Mira 3 field emission scanning electron microscope (FESEM). The samples were prepared by dispersing the nanoparticles in ethanol, and dropping and drying the solution over the SEM stabs. Transmission electron microscopy (TEM) was performed using a Philips EM 208 S transmission electron microscope operating at 100 keV. The samples were prepared by casting and drying a drop of the particles dispersed in ethanol over a carbon coated copper grids. Thermogravimetric analyses (TGA) were performed using TGA/SDTA851e Mettler Toledo instrument under N2 streaming atmosphere between room temperature and 700 °C at 10 °C min−1 heating rate. XRD patterns were obtained using a Bruker D8 Advance diffractometer using a monochromatic Cu–K(α) radiation source (λ = 0.154058 nm) between 10° to 90°, 2θ scale. Cyclic voltammetry (CV, Origaflex potentiostat) was measured using a three-electrode system with Cu/PPy as the working electrode (1 cm2 area), Pt wire and a SCE as the reference electrodes. The supporting electrolyte was Na2SO4 (0.5 M) in water and scans were performed from −800 to 800 mV at different voltage sweeping rates. Electro-chemical impedance (EIS) studies were performed by OCP at AC voltage and frequency range of 0.01 Hz to 100 kHz. A spectrofluorometer JASCO FP-6200 was used to record the absorption and photoluminescence (PL) spectra of the samples. The excitation was performed at the maximum absorption wavelength of the samples (270 nm) in the solid state at room temperature.3. Results and discussion
3.1. FTIR spectroscopy
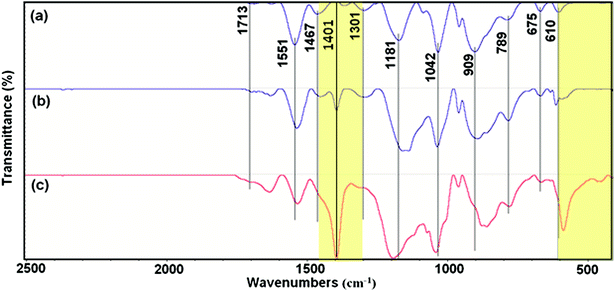
Fig. 2 shows the FTIR spectroscopy of the as-synthesized PPy. The spectra show characteristic peaks of PPy.19,20 The peaks at 610, 675 and 789 cm−1 originated from the C–H wagging vibrations. The peak near the 909 cm−1 can be attributed to the C–H out-of-plane deformation vibrations. The band of![[double bond, length as m-dash]](https://www.rsc.org/images/entities/char_e001.gif) C–H in-plane deformation is located at 1042 cm−1. The peak at 1181 cm−1 corresponds to the breathing vibration of pyrrole ring. The peak at 1301 cm−1 is due to the C–C in-ring stretching and C–N deformation mode. The peaks observed at 1467 and 1551 cm−1 are due to the stretching vibrations of C–N and C
C–H in-plane deformation is located at 1042 cm−1. The peak at 1181 cm−1 corresponds to the breathing vibration of pyrrole ring. The peak at 1301 cm−1 is due to the C–C in-ring stretching and C–N deformation mode. The peaks observed at 1467 and 1551 cm−1 are due to the stretching vibrations of C–N and C![[double bond, length as m-dash]](https://www.rsc.org/images/entities/char_e001.gif) C of PPy ring, respectively.13,14
C of PPy ring, respectively.13,14
However, there are some differences when the spectra of different samples are compared, including slightly shifted wavenumbers and intensity changes in common peaks. As can be seen, the peak located at 1401 cm−1 is quiet sharp in Pmic11 while it presents lower intensity in Pmic21 and is completely missing in Pmac21. Moreover, the peak appearing at 610 cm−1 in Pmic21 and Pmac21 shifted to lower frequency in Pmic11 with higher intensity.
The absence of the peak at ca. 735 cm−1, attributed to the –N–H out-of-plane vibrations of pure pyrrole, indicates the inter-chain hydrogen bond formation and 2-D structure of PPy in the samples. From the other hand, the lack of the peak at 1900 cm−1 that is related to the intra-chain charge carrier excitations indicates the absence of the doped chains in the samples, which is quiet usual when APS is used as the oxidizing agent. Small peak at 1713 cm−1 in Pmic21 and Pmic11, can be attributed to the overoxidation and –N–C![[double bond, length as m-dash]](https://www.rsc.org/images/entities/char_e001.gif) O carbonyl group formation mainly at the terminal pyrrole rings. The peak at 1401 cm−1, which is attributed to the C–C (monomer) and C–N ring stretching, explains a lower monomer conversion in Pmic11 as compared to Pmic21.21 Accordingly, the peak at 610 cm−1, which is attributed to the in-plane C–H vibrations of the terminal pyrrole units is shifted to lower frequencies and it presents higher intensity in Pmic11, confirming the lower conversation in this sample with respect to Pmic21.
O carbonyl group formation mainly at the terminal pyrrole rings. The peak at 1401 cm−1, which is attributed to the C–C (monomer) and C–N ring stretching, explains a lower monomer conversion in Pmic11 as compared to Pmic21.21 Accordingly, the peak at 610 cm−1, which is attributed to the in-plane C–H vibrations of the terminal pyrrole units is shifted to lower frequencies and it presents higher intensity in Pmic11, confirming the lower conversation in this sample with respect to Pmic21.
3.2. X-ray diffraction analysis
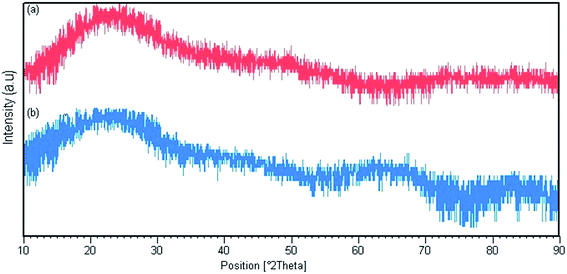
Fig. 3 shows the X-ray diffraction patterns for Pmic21 and Pmic11. There are broad peaks between 2θ = 15° and 30°, revealing the short range arrangement of PPy chains, which is equal to the amorphous structure of PPy samples synthesized in microchannel.3.3. Morphology of the PPy nanoparticles
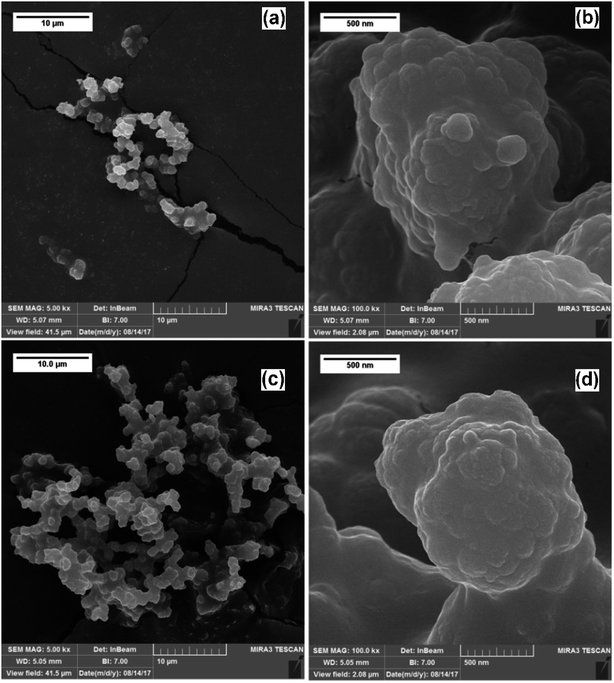
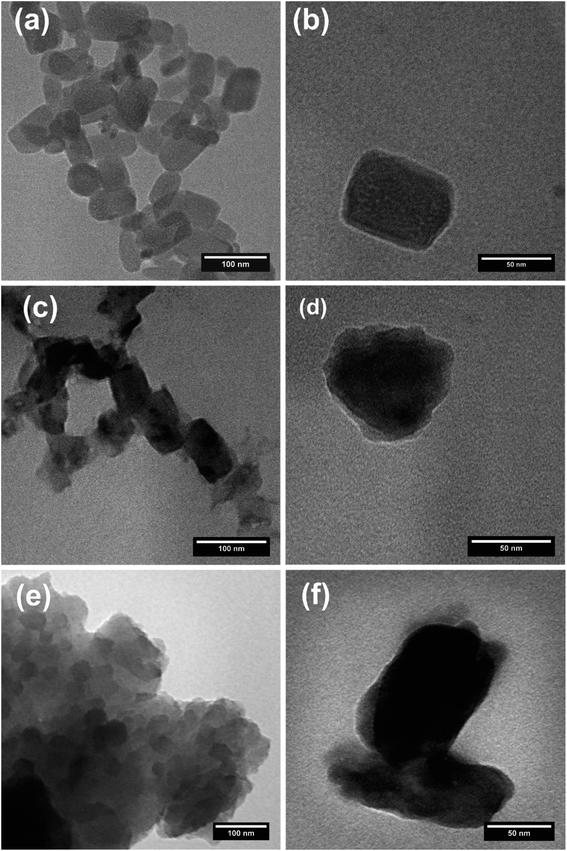
The morphological characteristics of the in-microchannel synthesized PPys studied by FESEM are shown in Fig. 4. It revealed that the particles consisted of linked globular sub-particles. The individual globule is irregular in shape with a rough surface, which is mostly called as cauliflower morphology. No major difference in the FESEM images of Pmic11 and Pmic21 samples is detectable; however, in TEM images shown in Fig. 5, single particles of about 60–80 nm in diameter are visible. Moreover, the microstructure of the particles of Pmic11 is more regular in shape with sharp edges. However, when compared with Pmic21 (Fig. 5c and d), Pmic11 particles are in less contrast with the surrounding background, which is an indication for lower density particles. On the other hand, in Fig. 5e, Pmac21 particles appear with completely different morphology. The particles are much bigger in size and are mostly aggregated into the clusters of many particles. Individual Pmac21 particles (Fig. 5f) show higher contrast images with particle sizes around 70–180 nm.Therefore, the droplets are micron-sized however, smaller nano-sized particles are formed inside them in effect of the used surfactant. In other words, this was not the suspension polymerization, in which the product particles are of the same size of the monomer droplets.
3.4. Thermal analysis
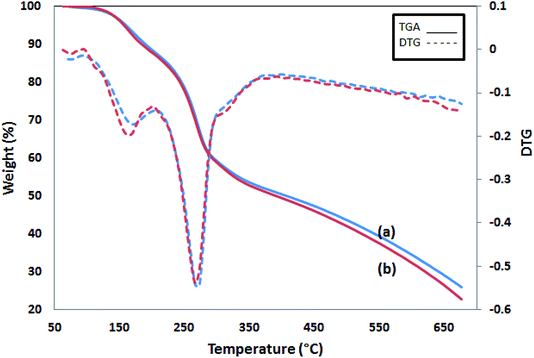
The TGA thermograms of two PPy samples are shown in Fig. 6. The first 15% weight loss starts at 100 °C and continues up to 230 °C. The second and the main weight loss occurs at 250 °C and goes with a sharp weight loss of up to 35% at 350 °C. Then, the process slows down later and reaches 25 and 22% of char yield at 700 °C for Pmic11 and Pmic21, respectively. In conclusion, Pmic11 and Pmic21 presented a thermal behavior.3.5. Photoluminescence spectroscopy (PL)
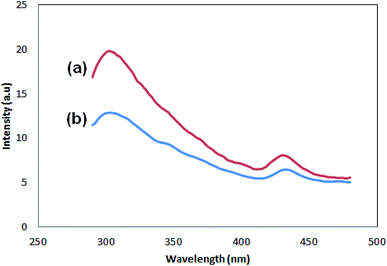
Fig. 7 shows the photoluminescence spectra of the samples. There are two peaks for both samples, one with lower intensity, which appears at 430 (Pmic21) and 432 (Pmic11), and the stronger one at lower wavelengths: 302 (Pmic21) and 304 (Pmic11). The peak at higher wavelength can be regarded as the surface charge redistribution from the surface defects of the PPy particles or vibronic coupling22,23 while the stronger one at shorter wavelengths can be considered as the main charge recombination process or the florescence quenching of the photo induced charge carriers. Obviously, there is no significant shift in the peaks of the samples shown in Fig. 7. The peak shifts can have their origin in the effective conjugated length in the polymer.24–26 Therefore; the same wavelength observed for the peaks shows equal effective conjugated length for both of the samples, being independent of APS to monomer molar ratio. The difference in PL spectra of the samples lays in the intensities of the peaks, which are higher for Pmic21. The aggregation of the particles,27 band gap structure (direct or indirect) and anti-polaron free chain structure,28 rigidity and planner conformation of the chains, charge transfer to counter ions,29 particle size and density of the particles,27 non-radiative quenching phenomena or self-absorption30 and excitation wavelength31 are among the investigated reasons that can affect the PL intensities in conjugated homopolymers. Having other experimental evidences from FTIR, SEM and TEM in addition to CV, lower conversion or lower molecular weight, less particle density, lower conjugation length (band gap structure) and loosely bonded particles in Pmic11 compared to Pmic21 can be regarded as the main reasons for different PL responses between Pmic21 and Pmic11 samples.3.6. Cyclic voltammetry
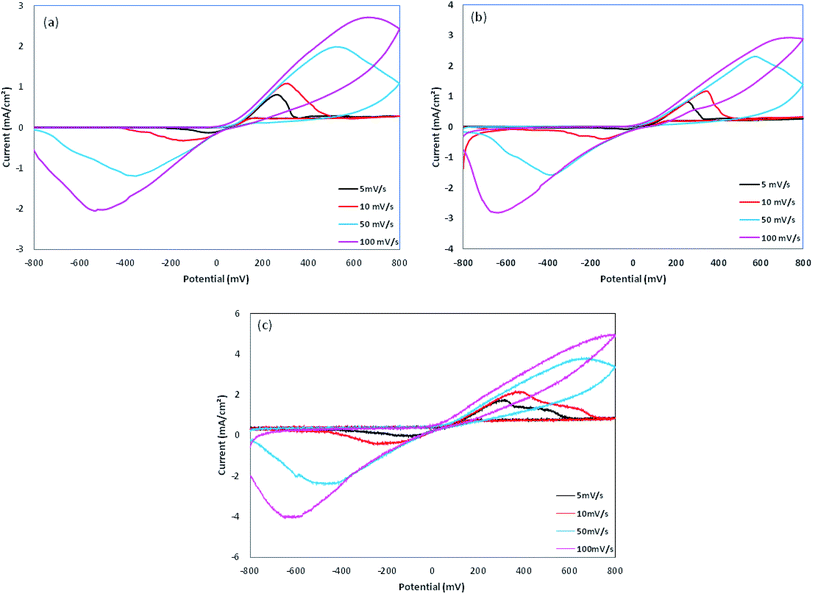
The cyclic voltammetry was performed using Cu electrodes covered with PPy nanoparticles as working electrodes. The redox behavior of PPy samples was investigated using cyclic voltammetry (CV) measured between −800 and 800 mV at various scan rates, as shown in Fig. 8 and are summarized in Table 2. On the positive voltage side, an anodic peak appears, which is related to the doping processes in PPy. On the negative voltage side, a cathodic peak appears showing the reduction of the oxidized polymer, i.e. the de-doping of PPy. In all of the samples, cathodic currents are lower than those of anodic currents, which is due to the lower rate of the counter ion removal from the oxidized (doped) polymer. From Table 2, a large positive shift is observed for the cathodic peaks and also a negative shift for the anodic peaks, resulting in ΔVp (ΔVp = Va − Vc) increasing with the scan rate. This indicates the quasi-reversible reactions at the surface of the electrode.17 The dependence of anodic peak current on the scan rate is expressed by eqn (1):
log![[thin space (1/6-em)]](https://www.rsc.org/images/entities/char_2009.gif) Ia = log Ia = log![[thin space (1/6-em)]](https://www.rsc.org/images/entities/char_2009.gif) A + x A + x![[thin space (1/6-em)]](https://www.rsc.org/images/entities/char_2009.gif) log log![[thin space (1/6-em)]](https://www.rsc.org/images/entities/char_2009.gif) v v
| (1) |
| Sample | υ (mV s−1) | Va (mV) | Ia (mA cm−2) | Qa | Vc (mV) | Ic (mA cm−2) | Qc | ΔVp (V) | (Qa + Qc) |
|---|---|---|---|---|---|---|---|---|---|
| a υ: potential scanning rate, Va: anodic peak potential, Vc: cathodic peak potential, Ia: anodic peak current, Ic: cathodic peak current, Qa: area under CV anodic peak, Qc: area under CV cathodic peak, ΔVp: peak potential distance (ΔVp = Va − Vc). | |||||||||
| Pmic21 | 5 | 289.9 | 1.779 | 1138 | −7.7 | 0.306 | 749 | 0.297 | 1887 |
| 10 | 362.8 | 2.209 | 1353 | −196.7 | 0.475 | 748 | 0.559 | 2101 | |
| 50 | 651.7 | 3.865 | 2236 | −412.7 | 2.454 | 2109 | 1.064 | 4345 | |
| 100 | 768.2 | 5.001 | 2613 | −610.7 | 4.08 | 3325 | 1.378 | 5938 | |
| Pmic11 | 5 | 259.7 | 0.811 | 243 | −33.4 | 0.08 | 173 | 0.293 | 416 |
| 10 | 344.8 | 1.165 | 407 | −142.7 | 0.398 | 288 | 0.487 | 695 | |
| 50 | 572.5 | 2.305 | 1040 | −388.4 | 1.585 | 885 | 0.96 | 1925 | |
| 100 | 732.2 | 2.922 | 1376 | −638.2 | 2.824 | 2006 | 1.37 | 3382 | |
| Pmac21 | 5 | 266.4 | 0.809 | 250 | −35.2 | 0.130 | 187 | 0.301 | 437 |
| 10 | 309.6 | 1.085 | 331 | −146.3 | 0.325 | 254 | 0.455 | 585 | |
| 50 | 523.3 | 1.986 | 943 | −357.8 | 1.196 | 777 | 0.881 | 1720 | |
| 100 | 661.5 | 2.713 | 1306 | −533.8 | 2.055 | 1617 | 1.195 | 2923 | |
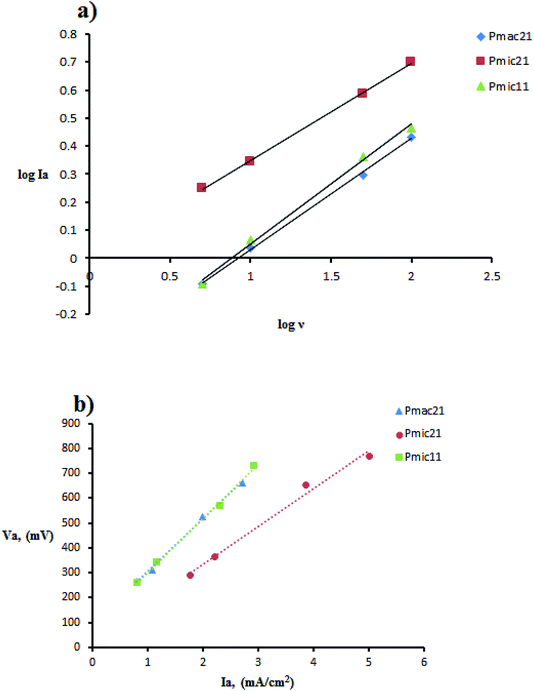 | ||
Fig. 9 Cyclic voltammetry data manipulation: (a) plot of log![[thin space (1/6-em)]](https://www.rsc.org/images/entities/char_2009.gif) Ia vs. log Ia vs. log![[thin space (1/6-em)]](https://www.rsc.org/images/entities/char_2009.gif) ν and (b) linear plot of anodic peak potential Va, vs. anodic peak current Ia. ν and (b) linear plot of anodic peak potential Va, vs. anodic peak current Ia. | ||
The capacitance from CV experiments can be calculated using eqn (2):
 | (2) |
3.7. Electrochemical impedance spectroscopy
The Nyquist plots obtained for PPy-coated electrodes are shown in Fig. 10. The coated electrodes were held in the electrolyte solution for 50 min, and then at the open circuit voltage for 10 min to reach equilibrium. A dual time constant equivalent circuit was obtained from the Nyquist plots, as shown in Fig. 11.33 The equivalent circuit specifies two simultaneous processes occurring in either the bulk of the electroactive polymer or at the electrolyte/polymer interface. In the equivalent circuit, Rs is the resistance of the electrolyte, CPEf and Rf are the constant phase element of the geometrical pseudocapacitance and the bulk resistance of the PPy film, respectively. CPEdl is the electrical double layer at the polymer/solution interface, while Rct is the charge transfer resistance at this interface. The fitting parametric data are given in Table 3 by limiting the relative error at the value to less than 5% for each element.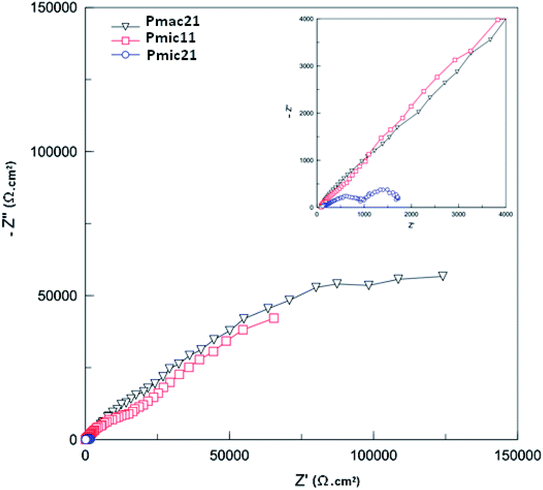 | ||
| Fig. 10 Nyquist plots for the PPys: Pmac21 (∇), Pmic11 (□) and Pmic21 (○). Inset is the impedance spectrum at high frequencies. Frequency range: 0.01 to 105 Hz. | ||
| Sample | Rs (Ω cm2) | Rf (kΩ cm2) | CPEf-T (F cm−2) | CPEf-P | Rct (kΩ cm2) | CPEdl-T (F cm−2) | CPEdl-P |
|---|---|---|---|---|---|---|---|
| Pmac21 | 89.50 | 754.61 | 1.452 × 10⁻⁵ | 0.591 | 129.810 | 2.815 × 10⁻⁵ | 0.855 |
| Pmic11 | 91.75 | 350.65 | 1.932 × 10⁻⁵ | 0.580 | 114.680 | 8.747 × 10⁻⁵ | 0.824 |
| Pmic21 | 120.80 | 108.00 | 6.312 × 10⁻⁵ | 0.471 | 0.673 | 91.000 × 10⁻⁵ | 0.964 |
The geometrical pseudocapacitance parameter Rf, decreases strongly from Pmac21 (754.61 kΩ) to Pmic11 (350.65 kΩ) to Pmic21 (108.00 kΩ), which corresponds to a decrease in the real-part impedance extension of the high-frequency semicircle.34 Such decrease could be related to the different structures and electroactivities of the samples synthesized at different APS/monomer molar ratios and in microchannel rather than in macro-state. It is also seen that CPEf and CPEdl values are higher for Pmic21 (evident from CPEf-T and CPEdl-T values in Table 3). For Pmic21, CPEf-T and CPEdl-T values are 6.312 × 10⁻⁵ and 91 × 10−5, respectively, while these are only 1.932 × 10⁻⁵ and 8.747 × 10⁻⁵ respectively for Pmic11, and 1.425 × 10⁻⁵ and 2.81 × 10⁻⁵ respectively for Pmac21. The increase in the CPEf value could be explained by an increase in the charge storage capacity in the sample, while the increase in the CPEdl value could be related to the increased exposed surface area in Pmic21 (smaller particles). This confirms the discussion provided previously in Section 3.6 using the CV data. Moreover, faster charge transfer at the polymer/electrolyte interface is observed, since Rct is much lower for Pmic21 (0.673 kΩ cm2) as compared to Pmic11 (114.680 kΩ cm2) and Pmac21 (129.810 kΩ cm2).
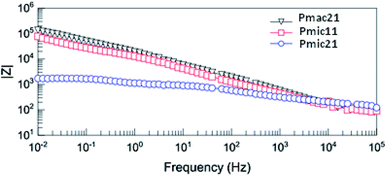
Fig. 12 shows the Bode diagram for the samples. As can be seen, there is a two order of magnitude decrease in observed impedance for Pmic21 as compared to Pmic11 and Pmac21 over the whole range of the frequencies. This is attributed to a high ion conductivity and high surface area of Pmic21 particles as compared to other samples.35
4. Conclusions
It is possible to design and construct specific microchannel reactors in order to synthesize conducting polymers inside the microchannels. The major problem with this goal is the solidification of the polymer, which results in the channel blocking and precipitation of the products inside of the channel. The other difficulty is the time needed for reaction proceeding. The first problem was solved by the droplet formation so that the oxidizing agent was in the aqueous droplet, and the monomer was dissolved in the surrounding phase (the moving phase). The polymerization occurred by the diffusion of monomer from surrounding phase into the droplets. The flow rates, in addition to fluid properties, had to be controlled and adjusted for the droplet formation. The required reaction time could be satisfied by providing a long microchannel so that the droplets remained for longer times inside the microchannel to complete the polymerization. Therefore, by using the microchannel reactor and process details described in the study, polypyrrole nanoparticles were successfully synthesized, for the first time, in microchannel. Oxidant/monomer molar ratio of 2![[thin space (1/6-em)]](https://www.rsc.org/images/entities/char_2009.gif) :
:![[thin space (1/6-em)]](https://www.rsc.org/images/entities/char_2009.gif) 1, when used for in-microchannel synthesis, resulted in polypyrrole with higher conductivity and higher relative electrical capacitance than the PPy comparatively synthesized by regular bulk method. The results showed that the in-microchannel synthesis could afford high quality conducting polymer nanoparticles. The in-microchannel polymers with tunable spherical sizes, can be used as coating dispersions, additive particles or in combination with other materials and polymers. There are other possibilities for the preparation of nanosized conducting polymers inside the microchannel, for example coating by other materials or the synthesis of layer-by-layer nano and micronsized spheres.
1, when used for in-microchannel synthesis, resulted in polypyrrole with higher conductivity and higher relative electrical capacitance than the PPy comparatively synthesized by regular bulk method. The results showed that the in-microchannel synthesis could afford high quality conducting polymer nanoparticles. The in-microchannel polymers with tunable spherical sizes, can be used as coating dispersions, additive particles or in combination with other materials and polymers. There are other possibilities for the preparation of nanosized conducting polymers inside the microchannel, for example coating by other materials or the synthesis of layer-by-layer nano and micronsized spheres.
Conflicts of interest
There are no conflicts to declare.Acknowledgements
The authors wish to express their gratitude from the Iran National Science Foundation for their financial support of the work under the contract number of 93044212. In addition, Iran Nanotechnology Initiative Council is esteemed for its partial financial support of the work under contract number of 100773.References
- K. K. Kanazawa, A. F. Diaz, R. H. Geiss, W. D. Gill, J. F. Kwak, J. A. Logan, J. F. Rabolt and G. B. Street, ‘Organic metals’: polypyrrole, a stable synthetic ‘metallic’ polymer, J. Chem. Soc., Chem. Commun., 1979,(19), 854–855 RSC.
- T. V. Vernitskaya and O. N. Efimov, Polypyrrole: a conducting polymer; its synthesis, properties and applications, Russ. Chem. Rev., 1997, 66(5), 443–457 CrossRef.
- Q. Lu, Unstirred preparation of soluble electroconductive polypyrrole nanoparticles, Microchim. Acta, 2010, 168(3), 205–213 CrossRef.
- G. Inzelt, Chemical and Electrochemical Syntheses of Conducting Polymers, in Conducting Polymers: A New Era in Electrochemistry, Springer Berlin Heidelberg, Berlin, Heidelberg, 2012, pp. 149–171 Search PubMed.
- M. Aldissi, Processability and Order in Conducting Polymers, Mol. Cryst. Liq. Cryst. Incorporating Nonlinear Opt., 1988, 160(1), 121–131 CrossRef.
- C. Shen, Y. Sun, W. Yao and Y. Lu, Facile synthesis of polypyrrole nanospheres and their carbonized products for potential application in high-performance supercapacitors, Polymer, 2014, 55(12), 2817–2824 CrossRef CAS.
- S. N. Beesabathuni, J. G. Stockham, J. H. Kim, H. B. Lee, J. H. Chung and A. Q. Shen, Fabrication of conducting polyaniline microspheres using droplet microfluidics, RSC Adv., 2013, 3(46), 24423–24429 RSC.
- E. Kumacheva and P. Garstecki, Synthesis of Polymer Particles in Microfluidic Reactors, in Microfluidic Reactors for Polymer Particles, John Wiley & Sons, Ltd., 2011, pp. 109–145 Search PubMed.
- R. Karnik, F. Gu, P. Basto, C. Cannizzaro, L. Dean, W. Kyei-Manu, R. Langer and O. C. Farokhzad, Microfluidic Platform for Controlled Synthesis of Polymeric Nanoparticles, Nano Lett., 2008, 8(9), 2906–2912 CrossRef CAS PubMed.
- E. Kumacheva and P. Garstecki, Microfluidic Production of Hydrogel Particles, in Microfluidic Reactors for Polymer Particles, John Wiley & Sons, Ltd., 2011, p. 146–169 Search PubMed.
- E. Kumacheva and P. Garstecki, Polymer Capsules, in Microfluidic Reactors for Polymer Particles, John Wiley & Sons, Ltd., 2011, pp. 170–191 Search PubMed.
- E. Kumacheva and P. Garstecki, Microfluidic Synthesis of Polymer Particles with Non-Conventional Shapes, in Microfluidic Reactors for Polymer Particles, John Wiley & Sons, Ltd., 2011, pp. 192–214 Search PubMed.
- T. Nisisako, T. Torii and T. Higuchi, Novel microreactors for functional polymer beads, Chem. Eng. J., 2004, 101, 23–29 CrossRef CAS.
- E. Effati and B. Pourabbas, New portable microchannel molding system based on micro-wire molding, droplet formation studies in circular cross-section microchannel, Mater. Today Commun., 2018, 16, 119–123 CrossRef CAS.
- X.-B. Li, F.-C. Li, J.-C. Yang, H. Kinoshita, M. Oishi and M. Oshima, Study on the mechanism of droplet formation in T-junction microchannel, Chem. Eng. Sci., 2012, 69(1), 340–351 CrossRef CAS.
- D. Kobayashi, Y. Endo, T. Takahashi, K. Otake and A. Shono, New Method for the Synthesis of Polypyrrole Particle Using Water/Oil Emulsion, J. Chem. Eng. Jpn., 2013, 46(8), 550–555 CrossRef CAS.
- Y. Tan and K. Ghandi, Kinetics and mechanism of pyrrole chemical polymerization, Synth. Met., 2013, 175, 183–191 CrossRef CAS.
- A. Wang, W. Zhao and W. Yu, Effect of acid/base on the third-order optical nonlinearity of polypyrrole, J. Mol. Struct., 2015, 1099, 291–296 CrossRef CAS.
- A. T. Mane, S. T. Navale, R. S. Mane, M. Naushad and V. B. Patil, Synthesis and structural, morphological, compositional, optical and electrical properties of DBSA-doped PPy–WO3 nanocomposites, Prog. Org. Coat., 2015, 87, 88–94 CrossRef CAS.
- J. Tabaciarova, M. Micusik, P. Fedorko and M. Omastova, Study of polypyrrole aging by XPS, FTIR and conductivity measurements, Polym. Degrad. Stab., 2015, 120, 392–401 CrossRef CAS.
- J. Hazarika and A. Kumar, Controllable synthesis and characterization of polypyrrole nanoparticles in sodium dodecylsulphate (SDS) micellar solutions, Synth. Met., 2013, 175, 155–162 CrossRef CAS.
- A. De Sio and C. Lienau, Vibronic coupling in organic semiconductors for photovoltaics, Phys. Chem. Chem. Phys., 2017, 19(29), 18813–18830 RSC.
- C. Weder and M. S. Wrighton, Efficient Solid-State Photoluminescence in New Poly(2,5-dialkoxy-p-phenyleneethynylene)s, Macromolecules, 1996, 29(15), 5157–5165 CrossRef CAS.
- S. M. Cassemiro, F. Thomazi, L. S. Roman, A. Marletta and L. Akcelrud, Effect of conjugation length on photophysical properties of a conjugated–non-conjugated multiblock copolymer, Synth. Met., 2009, 159(19), 1975–1982 CrossRef CAS.
- R. V. Fernandes, M. A. T. da Silva, I. F. L. Dias, J. L. Duarte, H. de Santana and E. Laureto, Correlation between emission and structural properties of poly(p-phenylene vinylene) thin films, Synth. Met., 2013, 170, 25–30 CrossRef CAS.
- F. Montilla and F. Huerta, Electrochemically Monitored Photoluminescence of Conjugated Polymers, in Luminescence in Electrochemistry: Applications in Analytical Chemistry, Physics and Biology, Springer International Publishing, Cham, 2017, pp. 105–137 Search PubMed.
- A. J. R. Son, H. Lee and B. Moon, Morphology and photoluminescence of colloidal polypyrrole nanoparticles, Synth. Met., 2007, 157(16), 597–602 CrossRef CAS.
- Y. Huang, B. Gai Zhai and Q. Lan Ma, Efficient Photoluminescence from Thin Films of Polypyrrole, Mater. Sci. Forum, 2011, 300–303 CAS.
- W. Wang, D. Yu and F. Tian, Photoluminescence of a soluble polypyrrole based on N-vinylpyrrole, J. Lumin., 2010, 130(3), 494–497 CrossRef CAS.
- K. S. Jang, H. C. Ko, B. Moon and H. Lee, Observation of photoluminescence in polypyrrole micelles, Synth. Met., 2005, 150(2), 127–131 CrossRef CAS.
- B. Dong, M. Yang, S. Ge, Y. Cao, B. Li and Y. Lu, Synthesis and photoluminescence modulating of polypyrrole fluorescent nano-spheres/dots, RSC Adv., 2016, 6(28), 23737–23745 RSC.
- N. Elgrishi, K. J. Rountree, B. D. McCarthy, E. S. Rountree, T. T. Eisenhart and J. L. Dempsey, A Practical Beginner's Guide to Cyclic Voltammetry, J. Chem. Educ., 2018, 95(2), 197–206 CrossRef CAS.
- M. Grzeszczuk and G. Zabinska-Olszak, Effects of the secondary counterions in the electrochemistry of polypyrrole, J. Electroanal. Chem., 1997, 427(1), 169–177 CrossRef CAS.
- K. Qi, Y. Qiu, Z. Chen and X. Guo, Corrosion of conductive polypyrrole: Effects of continuous cathodic and anodic polarisation, Corros. Sci., 2013, 69, 376–388 CrossRef CAS.
- S. S. Jeon, C. Kim, J. Ko and S. S. Im, Spherical polypyrrole nanoparticles as a highly efficient counter electrode for dye-sensitized solar cells, J. Mater. Chem., 2011, 21, 8146–8151 RSC.
Footnote |
| † Electronic supplementary information (ESI) available. See DOI: 10.1039/c9ra00946a |
| This journal is © The Royal Society of Chemistry 2019 |

