 Open Access Article
In situ Raman monitoring of dielectric-heating-enhanced freeze-drying under different electromagnetic wave frequencies
S. Tsubaki *a,
T. Matsuzawaa,
S. Fujii
 ab,
E. Suzukia,
H. Kanamoric,
T. Hoshinoc,
S. Hosodac and
Y. Wadaa
aSchool of Materials and Chemical Technology, Tokyo Institute of Technology, Ookayama 2-12-1 E4-3, Meguro, Tokyo, 152-8550, Japan. E-mail: shuntaro.tsubaki@gmail.com; tsubaki.s.aa@m.titech.ac.jp
bDepartment of Information and Communication Systems Engineering, Okinawa National College of Technology, 905 Henoko, Nago-shi, Okinawa 905-2192, Japan
cJapan Aerospace Exploration Agency, 3-1-1 Yoshinodai, Chuo-ku, Sagamihara, Kanagawa 252-5210, Japan
First published on 19th March 2019
Abstract
We studied the effect of dielectric heating on the enhancement of freeze-drying by electromagnetic waves (EMWs) under different frequencies: 2.45 GHz microwaves (MWs), and 27 and 200 MHz radio frequencies (RFs). The irradiation with RFs, particularly at 27 MHz, reduced the duration of freeze-drying by 67%. We further analysed the water structure by in situ Raman spectroscopy during freeze-drying under EMWs. The phase transition from ice to water occurred soon after starting irradiation by MWs at 2.45 GHz, while the ice phase was almost maintained at an RF of 27 MHz.
Introduction
Dielectric heating by microwaves (MWs) and radio frequencies (RFs) enables rapid and direct heating of materials. Dielectric heating has been widely used for food processing,1 materials drying,2 processing,3 and various chemical reactions.4 Dielectric heating is capable of heating materials in a non-contact way. Thus, it can be used to heat materials with low heat conductivity (ca. vulcanisation of rubbers)5 or under vacuum conditions (ca. MW-assisted vacuum drying,6 and MW-assisted extraction of essential oils7). Freeze-drying is an important process in the food industry as well as pharmaceutical production. The enhancement of freeze-drying is strongly desired because freeze-drying is generally a time-consuming and costly process. Dielectric heating can enhance the rate of freeze-drying by directly distributing energy to frozen samples under vacuum, so MWs have previously been used to enhance the freeze-drying of foods.8–10Dielectric heating occurs via the interaction of applied electromagnetic waves (EMWs) and irradiated materials by two mechanisms: dielectric and conduction losses.11 Dielectric loss originates from the orientation and relaxation of dipoles, while conduction loss is attributed to the displacement of charges. Therefore, the complex dielectric constants of materials, which indicate the degree of EMWs absorbed by materials, are important parameters for the effective heating of materials by EMWs. The dielectric parameters vary depending on the materials, temperature, and applied frequency of the EMWs. For example, the complex dielectric constant of water significantly changes depending on its phase. Liquid water at 273 K undergoes maximum absorption of EMWs at 10 GHz, while ice water at the same temperature reaches the maximum absorption at 3 kHz.12–15 The appropriate frequency of the EMWs is important for obtaining efficient energy transfer.
In this study, we tested different frequencies of EMWs in a frequency range between RFs and MWs to enhance the freeze-drying of model aqueous solutions of pure water and NaCl. First, we determined the complex dielectric constants of the samples in a wide frequency range using the coaxial probe method to evaluate their frequency- and temperature-dependent dielectric properties. We then built a MW (2.45 GHz) and RF (27 and 200 MHz) irradiation systems to apply different frequencies of EMWs to the freeze-drying of the model aqueous solutions. We also analysed the water structure during freeze-drying under EMWs by in situ Raman spectroscopy to understand the mechanism of freeze-drying enhancement.
Experimental
Measurement of the temperature-dependent dielectric properties of water and the aqueous NaCl solution
The complex dielectric constants of water, aqueous NaCl solutions (0.05 and 0.1 M) were measured by a coaxial probe method using a KEYCOM Co. probe-type kit (open mode) and Rhode & Schwartz ZND network analyser in the 200 MHz–8.5 GHz frequency range. The temperature of the samples was controlled between −20 and 30 °C in an aluminium bead bath connected to a chiller. Dielectric spectra were obtained when the temperature became constant at the desired temperature.MW and RF heating systems for freeze-drying of water and aqueous NaCl solution
The MW and RF heating systems are illustrated in Fig. 1. The MW heating was conducted using a single mode (TM110) cavity resonator equipped with a semiconductor MW generator (2.45 GHz, Chronix Co.). The RF heating at 200 MHz was conducted using a parallel plate applicator (200 MHz, Fuji Electronic Ind.) equipped with a signal generator (8648C Keysight Technologies) and a GaN RF amplifier (ZHL-100W-GAN+, Mini-Circuits, frequency range 20–500 MHz, max. output 100 W) as indicated in our previous report.16 The RF heating at 27 MHz was conducted with a parallel plate applicator (27 MHz, Fuji Electronic Ind.) equipped with a 27 MHz RF generator (Fuji Electronic Ind.). The applied power was monitored using power monitors connected to each system.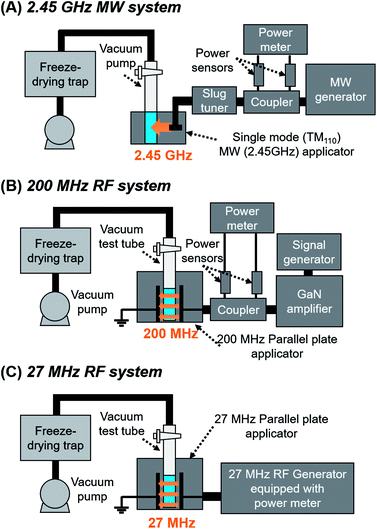 | ||
| Fig. 1 Freeze-drying systems under MW and RF irradiation: (A) 2.45 GHz MW, (B) 200 MHz RF, and (C) 27 MHz RF. | ||
The freeze-drying samples (water and aqueous NaCl solutions; 3 mL) were added to a flat-bottom glass test tube (ϕ 18 mm) equipped with a two-way valve and pre-frozen in a freezer. The temperature of the trap in the freeze-dryer (FDU-1200, EYELA) and suction rate of the pump (GOD-051XF, EYELA) were set to −46 °C and 50 L min−1, respectively. The test tubes were connected to the freeze-dryer by a vacuum hose and placed inside the MW and RF applicators as described in Fig. 1. MWs or RFs were continuously applied to the test tube at 10 W. The control experiment was conducted using the same freeze-dryer without MW or RF irradiation. The weight of the whole test tube was measured every 5–20 min. The irradiation of the MWs or RFs were stopped after the weight of the test tube became constant.
In situ Raman monitoring of water structure during freeze-drying of water under RF (27 MHz) and MW (2.45 GHz) irradiation
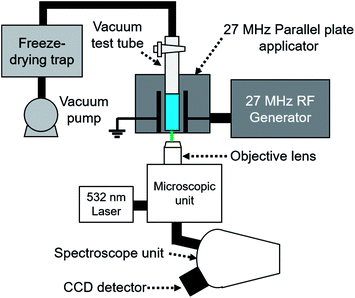
The structure of water during freeze-drying under MW and RF irradiation was monitored using Raman spectroscopy. A typical in situ Raman monitoring system under RF (27 MHz) irradiation is illustrated in Fig. 2. A Raman head (MobileRAM/H/TKT, Lambda Vision) equipped with an objective lens (Mitutoyo M Plan Apo 10×) was placed below the MW and RF applicators. The 532 nm laser (MSL-FN-532-100 m, Changchun New Industries Optoelectronics Technology) was used as a light source. The Raman spectra were obtained using a Horiba iHR320 spectrometer and Horiba Syncerity CCD detector. The high-resolution Raman spectra were obtained every 10 min with 5 s of laser irradiation time and five scans. In the case of transient Raman monitoring of the ice and water structure, the Raman spectra were continuously obtained with 1 s of laser irradiation time with 1 scan for each spectrum.Results and discussion
Temperature-dependent dielectric properties of water and the aqueous NaCl solution
The dielectric properties of water and an aqueous salt solution were first measured for the purpose of analysing their dependencies on phase, temperature, and frequency of EMW. Fig. 3 illustrates the temperature-dependent dielectric properties of water and the aqueous NaCl solution. The real part of the complex dielectric constant (relative permeability, ε′) indicates the degree of EMW energy stored in a material, while the imaginary part (the sum of dielectric and conduction loss, ε′′) indicates the degree of loss of the EMW energy dissipated in the materials.11 The degree of EMWs absorbed in the materials are described by the dielectric loss tangent (tan![[thin space (1/6-em)]](https://www.rsc.org/images/entities/char_2009.gif) δ), which is the ratio of ε′′/ε′. The dielectric property of water changes with phase transitions.13 The tan
δ), which is the ratio of ε′′/ε′. The dielectric property of water changes with phase transitions.13 The tan![[thin space (1/6-em)]](https://www.rsc.org/images/entities/char_2009.gif) δ values of ice were very small. However, these drastically increased after the phase transition to liquid water above 0 °C, especially for higher frequencies (>1 GHz) due to the dipole rotation of water molecules (Fig. 3A). The further increase in temperature led to a gradual decrease in the tan
δ values of ice were very small. However, these drastically increased after the phase transition to liquid water above 0 °C, especially for higher frequencies (>1 GHz) due to the dipole rotation of water molecules (Fig. 3A). The further increase in temperature led to a gradual decrease in the tan![[thin space (1/6-em)]](https://www.rsc.org/images/entities/char_2009.gif) δ values which attributes to the increased mobility of water molecules.17
δ values which attributes to the increased mobility of water molecules.17
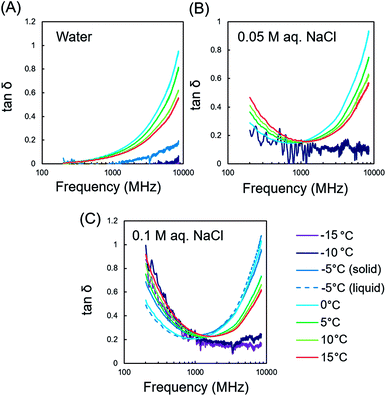 | ||
| Fig. 3 Temperature-dependent dielectric properties of the (A) water, (B) 0.05 M aqueous NaCl solutions, and (C) 0.1 M aqueous NaCl solution, from −15 to 15 °C. | ||
The aqueous NaCl solution exhibited an elevated tan![[thin space (1/6-em)]](https://www.rsc.org/images/entities/char_2009.gif) δ at lower frequencies (<1 GHz, Fig. 1B), which was attributed to conduction loss by ions.11 The increased concentration of NaCl provided a more prominent increase in the tan
δ at lower frequencies (<1 GHz, Fig. 1B), which was attributed to conduction loss by ions.11 The increased concentration of NaCl provided a more prominent increase in the tan![[thin space (1/6-em)]](https://www.rsc.org/images/entities/char_2009.gif) δ values (Fig. 1C). In contrast, the tan
δ values (Fig. 1C). In contrast, the tan![[thin space (1/6-em)]](https://www.rsc.org/images/entities/char_2009.gif) δ values of the aqueous NaCl solution increased with increasing temperature since the ionic conduction became more prominent at elevated temperatures, similar to that previously observed for electrolyte polymers in water.18 The high tan
δ values of the aqueous NaCl solution increased with increasing temperature since the ionic conduction became more prominent at elevated temperatures, similar to that previously observed for electrolyte polymers in water.18 The high tan![[thin space (1/6-em)]](https://www.rsc.org/images/entities/char_2009.gif) δ value was even observed in the solid phase of 0.1 M NaCl, which is likely due to the non-freezing bound water generated by the addition of electrolytes in water. This is originated from hydrated ions that change the water structure depending on the ion species.19
δ value was even observed in the solid phase of 0.1 M NaCl, which is likely due to the non-freezing bound water generated by the addition of electrolytes in water. This is originated from hydrated ions that change the water structure depending on the ion species.19
According to the temperature dependencies of the tan![[thin space (1/6-em)]](https://www.rsc.org/images/entities/char_2009.gif) δ values of ice and water, the appropriate EMW frequency should be used for freeze-drying to prevent overheating of the irradiated materials. The use of RFs is preferred, thus avoiding overheating of liquid water because its dielectric loss is very small in the RF range. MWs at 2.45 GHz can cause unexpected heating when liquid water is generated during freeze-drying because liquid water exhibits a higher dielectric loss than ice at 2.45 GHz. However, when concentrated electrolytes are in water, RF irradiation can also cause heating because the conduction loss becomes prominent in the RF range even in a solid phase.
δ values of ice and water, the appropriate EMW frequency should be used for freeze-drying to prevent overheating of the irradiated materials. The use of RFs is preferred, thus avoiding overheating of liquid water because its dielectric loss is very small in the RF range. MWs at 2.45 GHz can cause unexpected heating when liquid water is generated during freeze-drying because liquid water exhibits a higher dielectric loss than ice at 2.45 GHz. However, when concentrated electrolytes are in water, RF irradiation can also cause heating because the conduction loss becomes prominent in the RF range even in a solid phase.
MW and RF-assisted freeze-drying of water and the aqueous NaCl solution
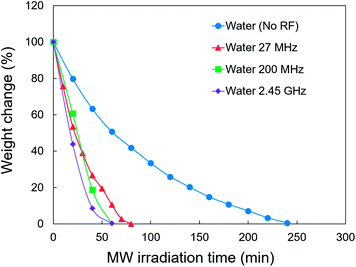
A freeze-drying system equipped with MW and RF heating devices was built to test the effect of different EMW frequencies on freeze-drying in every octave from 27 MHz to 2.45 GHz (Fig. 1). Fig. 4 shows a comparison of the effect of different EMW frequencies on the freeze-drying of water. The application of EMWs greatly reduced the duration of freeze-drying by 67% (27 MHz) to 75% (2.45 GHz). Therefore, the EMWs directly provided energy for the sublimation of ice, which is much faster than heat convection through the wall of the glass tube. The MWs provided a slightly higher freeze-drying rate compared with the RFs at the same applied power. However, water generation was promptly observed after starting MW irradiation. At the same time, the pressure in the freeze-dryer increased to ∼80–90 Pa, which further induced ice melting. Ice melting should be avoided, especially when freeze-drying pharmaceuticals that are very sensitive to heat. In contrast, ice phase was maintained during freeze-drying under RF irradiation at 27 MHz.The contribution of adding NaCl was further studied as some foods contain salts. Fig. 5 shows the weight change of the 0.05 and 0.1 M aqueous NaCl solutions, with and without 27 MHz RF irradiation. The RF case resulted in a reduced duration of freeze-drying by 71%. However, ice melting could not be prevented. This is attributed to the elevated tan![[thin space (1/6-em)]](https://www.rsc.org/images/entities/char_2009.gif) δ of the aqueous NaCl solution in the RF range (Fig. 3B and C). Tanaka et al. previously reported the heating of ice water by microwaves due to the interaction of ions in ice with EMWs, using a molecular dynamics simulation.20 The frozen-state of irradiated material should be carefully controlled when freeze-drying samples containing large amounts of electrolytes.
δ of the aqueous NaCl solution in the RF range (Fig. 3B and C). Tanaka et al. previously reported the heating of ice water by microwaves due to the interaction of ions in ice with EMWs, using a molecular dynamics simulation.20 The frozen-state of irradiated material should be carefully controlled when freeze-drying samples containing large amounts of electrolytes.
 | ||
| Fig. 5 Weight changes of the freeze dried aqueous NaCl solution with and without RF irradiation (27 MHz). | ||
In situ Raman monitoring of the water structure during freeze-drying under RF and MW irradiation at 27 MHz and 2.45 GHz, respectively
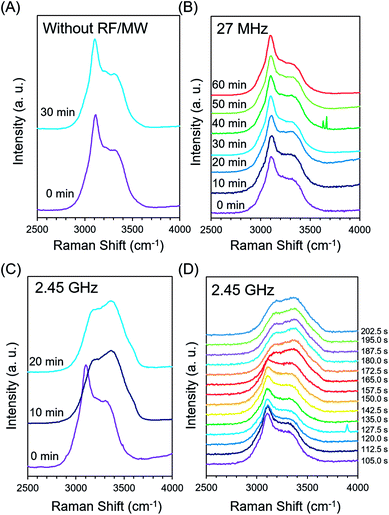
In situ Raman monitoring of the water structure during freeze-drying was conducted to verify the water phase under EMW irradiation. Raman spectroscopy has been used to characterise water structure in a non-contact way. Thus, it is a powerful tool for determining the water phase during food processing.21–25 The OH-stretching band in the range 2900–3700 cm−1 is a good indicator of the water structure because it is sensitive to the hydrogen bond networks in water.Fig. 6 shows the Raman spectra during freeze-drying of pure water for wavenumbers between 2500 and 4000 cm−1. The sharp peak at 3114 cm−1 corresponds to the symmetric O–H stretching band, which is indicative of a fully hydrogen bonded water molecule. The shoulder peak near 3410 cm−1 indicates an asymmetric O–H stretching band, attributed to water molecules with hydrogen bonds that are partly or totally broken.15,16 Therefore, the liquid water exhibited a broad peak for 2900–3700 cm−1, while the ice water exhibited a sharp peak at 3114 cm−1.
The ice phase was kept constant during freeze-drying for the case without EMW irradiation (Fig. 6A). The Raman spectra under 27 MHz RF irradiation remained almost the same as that of ice (Fig. 6B), while that under 2.45 GHz irradiation exhibited a significant phase transition from ice to water within 10 min (Fig. 6C). The Raman spectra for the 2.45 GHz case was further obtained in a shorter period as indicated in Fig. 6D. A phase transition drastically occurred between 135 and 172 s after starting MW irradiation, indicating that the phase transition of ice occurred at the beginning of freeze-drying.
Although the O–H stretching band is broad and convoluted in several components, the ratio of the symmetric and asymmetric stretching O–H bands provides information on the phase transitions of water.23 Fig. 7 shows the time-dependent ratios of the intensities of the peaks at 3114 and 3410 cm−1 [I(3410)/I(3114)] indicating the degree of water freezing, both with and without EMW irradiation. A constant value was obtained during freeze-drying without EMW irradiation. The 27 MHz RF irradiation produced a slight increase in the value of I(3410)/I(3114), indicating that a slight structural change occurs in ice during RF irradiation, even when the sample looks like the remaining ice phase. In contrast, the 2.45 GHz MW irradiation produced an instantaneous increase within a short period, which was attributed to the significant phase transition from ice to water. The generated water absorbed MWs to produce more heat, which further induced the melting of the ice because the dielectric loss of water was much higher than ice for the 2.45 GHz irradiation. Therefore, RF irradiation is preferred for the enhancement of freeze-drying of heat-sensitive materials such as biological samples because heat generation should be avoided.
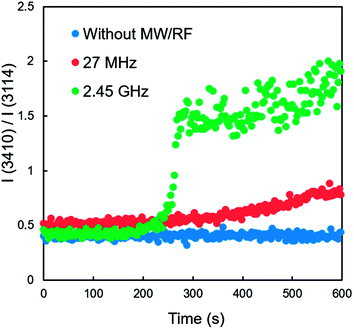 | ||
| Fig. 7 Changes in the ratios of the Raman peak intensity I(3410)/I(3114) during the freeze-drying of water, with and without RF and MW irradiation. | ||
Conclusions
We studied the effect of EMW irradiation using different frequencies (2.45 GHz MWs, and 27 and 200 MHz RFs) for the purpose of enhancing the freeze-drying rate. Measurements of the complex dielectric constant indicated a prominent increase in the dielectric loss during the phase transition from ice to water, particularly in the MW range above 1 GHz. The direct heating by EMW irradiation enhanced the sublimation of water and reduced the duration of ice freeze-drying by 67–75%. The freeze-drying rate using 27 MHz RF irradiation was slightly slower than those of other frequencies. However, water generation was avoided. The water structure during freeze-drying with and without EMW irradiation was further analysed using in situ Raman spectroscopy. The RF irradiation modified the water structure slightly. However, a frozen appearance remained. In contrast, the phase transition from ice to water occurred soon after exposure to MW irradiation. The MWs induced water generation, which facilitated further increases in the dielectric loss, increasing the MW susceptibility. RF irradiation, especially at 27 MHz, is therefore preferred for enhancing the freeze-drying rate, while maintaining the frozen phase of the material.Conflicts of interest
There are no conflicts to declare.Acknowledgements
This work was supported in part by the grant “Open Innovation Hub for Expanding Humanosphere and Domain of Human Activity through Solar System Frontier Development” from the Japan Aerospace Exploration Agency (JAXA) Space Exploration Innovation Hub Center, and Japan Science and Technology Agency (JST); Grant-in-Aid for Scientific Research (A) 25249113; Grant-in-Aid for Scientific Research (S) 17H06156; and JSPS Grant-in-Aid for Young Scientists (A) 17H05049.Notes and references
- S. Chandrasekaran, S. Ramanatha and T. Basak, Food Res. Int., 2013, 52, 243–261 CrossRef CAS.
- M. Zhang, J. Tang, A. S. Mujumdar and S. Wang, Trends Food Sci. Technol., 2006, 17, 524–534 CrossRef CAS.
- H. J. Kitchen, S. R. Vallance, J. L. Kennedy, N. Tapia-Ruiz, L. Carassiti, A. Harrison, A. G. Whittaker, T. D. Drysdale, S. W. Kingman and D. H. Gregory, Chem. Rev., 2014, 114, 1170–1206 CrossRef CAS PubMed.
- S. Horikoshi and N. Serpone, Microwaves in Catalysis: Methodology and Applications, Wiley-VCH, 2015 Search PubMed.
- M. Akiba and A. S. Hashim, Prog. Polym. Sci., 1997, 22, 475–521 CrossRef CAS.
- R. H. Walters, B. Bhatnagar, S. Tchessalov, K.-I. Izutsu, K. Tsumoto and S. Ohtake, J. Pharm. Sci., 2014, 103, 2673–2695 CrossRef CAS PubMed.
- N. Flórez, E. Conde and H. Domínguez, J. Chem. Technol. Biotechnol., 2015, 90, 590–607 CrossRef.
- X. Duan, M. Zhang, A. S. Mujumdar and S. Wang, J. Food Eng., 2010, 96, 491–497 CrossRef.
- X. Duan, M. Zhang, S. Mujumdar and R. Wang, Drying Technol., 2010, 28, 444–453 CrossRef CAS.
- X. Duan, M. Zhang and A. S. Mujumdar, Drying Technol., 2007, 25, 1725–1731 CrossRef.
- C. Gabriel, S. Gabriel, E. Grant, H. Grant, B. S. J. Halstead, D. Michael and P. Mingos, Chem. Soc. Rev., 1998, 27, 213–223 RSC.
- A. von Hippel, IEEE Trans. Electr. Insul., 1988, 23, 801–816 CrossRef CAS.
- J. L. Aragones, L. G. MacDowell and C. Vega, J. Phys. Chem. A, 2011, 15, 5745–5758 CrossRef PubMed.
- V. G. Artemov and A. A. Volkov, Ferroelectrics, 2014, 466(1), 158–165 CrossRef CAS.
- A. A. Volkov, V. G. Artemov and A. V. Pronin, Dokl. Phys., 2014, 59, 111–114 CrossRef CAS.
- S. Tsubaki, S. Hayakawa, T. Ueda, S. Fujii, E. Suzuki, J. Zhang, A. Bond and Y. Wada, Chem. Commun., 2019, 55, 1032–1035 RSC ..
- K. Okada, M. Yao, Y. Hiejima, H. Kohno and Y. Kajihara, J. Chem. Phys., 1999, 110, 3026 CrossRef CAS.
- S. Tsubaki, M. Hiraoka, S. Hadano, K. Okamura, T. Ueda, H. Nishimura, K. Kashimura and T. Mitani, Carbohydr. Polym., 2015, 115, 78–87 CrossRef CAS PubMed.
- H. J. Bakker, Chem. Rev., 2008, 108, 1456–1473 CrossRef CAS PubMed.
- M. Tanaka and M. Sato, J. Chem. Phys., 2008, 126, 034509 CrossRef PubMed.
- G. E. Walrafen, J. Chem. Phys., 1964, 40, 3249–3256 CrossRef CAS.
- B. Minceva-Sukarova, W. F. Sherman and G. R. Wilkinson, J. Phys. C: Solid State Phys., 1984, 17, 5833–5850 CrossRef CAS.
- I. Đuričković, R. Claverie, P. Bourson, M. Marchetti, J.-M. Chassot and M. D. Fontana, J. Raman Spectrosc., 2011, 42, 1408–1412 CrossRef.
- X. Xu, Z.-Z. He and J. Jiu, J. Raman Spectrosc., 2013, 44, 1045–1048 CrossRef.
- Q. Hu, S. Ouyang, J. Li and Z. Cao, J. Raman Spectrosc., 2017, 48, 610–617 CrossRef CAS.
| This journal is © The Royal Society of Chemistry 2019 |

