 Open Access Article
Selected pharmaceuticals removal using algae derived porous carbon: experimental, modeling and DFT theoretical insights†
N. Ouasfiad,
M. Zbair *b,
S. Bouzikria,
Z. Anfar
 c,
M. Bensitelb,
H. Ait Ahsaine‡
 c,
E. Sabbard and
L. Khamliche*a
aLaboratory of Organic Chemistry, Bioorganic and Environment, Chemistry Department, Faculty of Science, University Chouaib Doukkali, El Jadida, Morocco. E-mail: khamliche@yahoo.fr
bLaboratory of Catalysis and Corrosion of Materials (LCCM), Department of Chemistry, Faculty of Sciences of El Jadida, University of Chouaïb Doukkali, BP 20, 24000 El Jadida, Morocco. E-mail: zbair.mohamed@gmail.com
cLaboratoire Matériaux et Environnement LME, Faculté des Sciences, Université Ibn Zohr, BP 8106, Cité Dakhla, Agadir, Morocco
dLaboratory of Physico-Chemistry of Materials (LPCM), ChemistryDepartment, Faculty of Sciences, University of Chouaïb Doukkali, El Jadida, Morocco
First published on 28th March 2019
Abstract
Porous carbon from Laminaria digitata algae activated using NaOH (PCLD@NaOH) was prepared by a chemical activation approach and has been tested for the adsorption of ketoprofen and aspirin molecules. The prepared PCLD@NaOH was characterized using XPS, FTIR, Raman, N2-physisorption, SEM, acidic/basic character (Boehm), and pHPZC. The batch adsorption of ketoprofen and aspirin was investigated under different parameters. The adsorption kinetics on PCLD@NaOH were well described by the Avrami-fractional kinetic model and the equilibrium data by Liu isotherm model. The adsorption capacity of aspirin (970.88 mg g−1 at 25 °C) was higher than ketoprofen (443.45 mg g−1 at 25 °C). The thermodynamic values indicate that the adsorption of ketoprofen and aspirin is exothermic and spontaneous. These results were in good agreement with DFT calculation that shows that the aspirin molecule presents high reactivity, electrophilicity, and softness compared to the ketoprofen molecule. Finally, the response surface methodology was used to optimize the removal efficiency of ketoprofen and aspirin.
Introduction
Drugs play a key role in improving the quality and life expectancy of populations. Each year, thousands of tons of pharmaceuticals are used in human and veterinary medicine to treat symptoms, illnesses, bacterial infections, stress and to prevent pregnancy and stimulate the growth of farm and aquaculture.1,2 Pharmaceutical substances are produced and consumed in very large quantities around the world. Their use is an origin of generalized contamination of the different areas of our environment by a broad spectrum of molecules. Some of them are persistent and their accumulation can be toxic for humans as well as for all living beings.3–7Among these drugs, aspirin and ketoprofen molecules which are considered as non-steroidal anti-inflammatory drugs (NSAIDs) are most frequently found due to their widespread use.8,9 While there is no sign to suggest that NSAIDs are risky to adults, they may be toxic to aquatic organisms and harmful to embryos, infants, children, and adults with feeble constitutions and sensitivity to pharmaceuticals and these drugs have been found in surface water and also in some samples of drinking water.10–14 In Africa, ketoprofen was detected in all wastewater samples at a range of 1.2 to 9.0 μg L−1 and in some river water samples (Mbokodweni River south of Durban, South Africa).15 Furthermore, aspirin and ketoprofen were the most abundant pharmaceutical observed, 118 μg L−1 of aspirin and 3.15 μg L−1 of ketoprofen in wastewater influent (Msunduzi River in the province of KwaZulu-Natal, South Africa).16 In addition, Silindile et al., reported that the concentrations of ketoprofen in the influent and effluent samples (Durban in KwaZulu-Natal Province of South Africa) were in the ranges of 22.5–34.0 and 1.14–5.33 μg L−1, respectively.17
To date, several approaches, such as degradation,18 ozonation,19 electrocoagulation,10,20 electrochemical,21 adsorption22,23 and so on, have been studied for the removal of NSAIDs drugs from aqueous solution. In contrast to other approaches, adsorption is considered as effective and economical ways for the elimination of NSAIDs from waters.14,22,24,25 Porous and functional carbon materials have drawn huge attention for environmental remediation determinations owing to their high porosity and tenability.26–30 Several crud materials have been used to prepare porous materials such as Cassia fistula (commonly known as golden shower; GS),31 corncob wastes,32 jujube seed,33 almond shell,34 with high adsorption capacity and fast adsorption kinetics.
Recently, algae plant has received great attention as a wastewater treatment material. This may be due to its effectiveness towards removing toxic substances in wastewater and probably that it is environmentally friendly.22,35–37
Laminaria digitata (LD) is a brown algae belong to Laminariaceae family. The LD algae are one of the largest algae encountered on the European and North African coast. The size of LD algae is ranged between 1 to 2 mm and it lives fixed to the rocks to a depth of 10 meters and thrives in moderately beaten areas or strong currents. Few studies have shown the use of this algae as an adsorbent for the adsorption of toxic metals.38,39 To our knowledge, no work has been stated before on the removal of medicinal drugs from water by carbon materials derived from Laminaria digitata (LD).
In the present study, the adsorption ketoprofen and aspirin molecules on the surfaces of porous carbon derived Laminaria digitata prepared by NaOH (PCLD@NaOH) were conducted; the PCLD@NaOH was synthesized by chemical activation approach and characterized by XPS, FTIR, Raman, N2-physisorption, SEM, acidic/basic character (Boehm), and pHPZC. Adsorption studies were carried out in a batch system to investigate the removal of ketoprofen and aspirin and optimized using response surface methodology coupled with central composite design. Theoretical studies of chemical reactivity of ketoprofen and aspirin molecules tested were computed using DFT-based descriptors. The effects and influences credited to the characteristics of the PCLD@NaOH and experimental adsorption systems, in addition to the results of the theoretical study of ketoprofen and aspirin molecules were discussed according to the adsorption efficiency.
2 Materials and methods
2.1. Sampling and sample preparation
The algae Laminaria digitata (LD) is collected from El Jadida, on the West Atlantic coast of Morocco. Once washed, it is dried in the oven at 60° for 24 hours, and then crushed.2.2. Preparation of porous carbon
The algae Laminaria digitata (LD) were impregnated with sodium hydroxide (NaOH), the weight ratio used was 1![[thin space (1/6-em)]](https://www.rsc.org/images/entities/char_2009.gif) :
:![[thin space (1/6-em)]](https://www.rsc.org/images/entities/char_2009.gif) 1 and the mixture kept in an ultrasonic bath for 6 hours. After, the solid sample was isolated by filtration, and then dried at 80 °C for 12 h. The obtained product was then pyrolyzed at 600 °C for 2 hours under a nitrogen atmosphere (60 mL min−1). The obtained sample was washed several times by distilled water. The obtained porous carbon material was labeled: PCLD@NaOH. The size of PCLD@NaOH particles used in the adsorption was around 100 μm.
1 and the mixture kept in an ultrasonic bath for 6 hours. After, the solid sample was isolated by filtration, and then dried at 80 °C for 12 h. The obtained product was then pyrolyzed at 600 °C for 2 hours under a nitrogen atmosphere (60 mL min−1). The obtained sample was washed several times by distilled water. The obtained porous carbon material was labeled: PCLD@NaOH. The size of PCLD@NaOH particles used in the adsorption was around 100 μm.
2.3. Characterization methods
XPS analysis was carried out using Thermo Fisher Scientific ESCALAB 250Xi X-ray photoelectron spectroscopy system equipped with Al Kα X-ray source (hν = 1486.7 eV) to study the chemical states synthesized PCLD@NaOH. Scanning electron microscopy (SEM) of PCLD@NaOH using FEI, Quanta 200-ESEM operated at 20 kV. The Brunauer–Emmett–Teller (BET) surface area (SBET) of PCLD@NaOH was determined by the nitrogen adsorption and desorption isotherm, pore size distribution and specific surface area were measured using a 3Flex physisorption at 77 K. The Fourier Transform Infrared spectra of algae LD and PCLD@NaOH was obtained in the mid-infrared region (500–4000 cm−1) using a Shimadzu 4800S. The spectra were scanned at a resolution of 2.0 cm−1 and with 30 scanning. The ZPC (point of zero charges) of PCLD@NaOH was determined using the pH drift method. The surface functions of PCLD@NaOH have been determined by the Boehm method. Thus, 0.2 g of PCLD@NaOH was mixed with 25 mL of one of the three bases solutions NaHCO3 (0.05 M), Na2CO3 (0.05 M) and NaOH (0.05 M) to identify the organic acid surface groups (–COOH), (–COO–) and (–OH), respectively. For basic surface functions, 0.2 g of PCLD@NaOH was brought into contact with 25 mL of 0.05 M HCl. After 48 hours of stirring, the solutions were decanted for 4 hours and then filtered, and 10 mL (Va) aliquots were then taken by pipette from the filtrates. The aliquots of the reaction base NaHCO3, Na2CO3, and NaOH were acidified by adding of 20, 30, and 20 mL (VHCl) of HCl (0.05 M), respectively, and then back-titrated with NaOH (0.05 M). In the meantime, the aliquots of the reaction acid HCl were titrated directly with NaOH (0.05 M). Particularly, the titration was done directly after CO2 expulsion for 2 h under inert N2atmosphere, and the degasification was continued during the titration to avoid the CO2 dissolution from the atmosphere.The endpoint was determined using a methyl red (0.1%) color as an indicator. The numbers of moles of PCLD@NaOH surface functionalities were calculated using the equations reported by Tran.40
where V0 (mL) is the initial added volume of NaOH/Na2CO3/NaHCO3/HCl solution; C0 (M) is the concentration of NaOH/Na2CO3/NaHCO3/HCl when V0 is extracted; VHCl (mL) and CHCl (M) are the volume and concentration of HCl solution added to aliquots taken from V0, respectively; Va (mL) is the volume of aliquot taken from V0; m (g) is the mass of PCLD@NaOH; and Vt(NaOH) (mL) and Ct(NaOH) (M) are the concentration and volume of the titrant in the back titration, respectively.
2.4. Adsorption study
The adsorption process of ketoprofen and aspirin on PCLD@NaOH was run in batch experiments. The effect of PCLD@NaOH mass on ketoprofen and aspirin adsorption was studied (concentration 150 mg L−1, 60 min contact time, pH 3.4, 25 °C). Notably, the solution pH was controlled during the experiment using 1 M NaOH or 1 M HCl, to study the effect of pH solution on ketoprofen and aspirin adsorption by PCLD@NaOH (150 mg L−1 initial concentration, 0.02 g adsorbent, 60 min contact time, 25 °C). Approximately 0.02 g of PCLD@NaOH was added to 100 mL of aqueous ketoprofen and aspirin solution (150 mg L−1) and shacked at 200 rpm to study the effect of contact time. After predetermined time intervals, the mixture of PCLD@NaOH and pollutants was directly separated and filtered. The concentration of tested Ketoprofen and aspirin was determined using UV-Vis spectrophotometer spectrometry (Shimadzu-2600) at λmax = 277 nm and λmax = 281.3 nm, respectively. The adsorption equilibrium experiments of ketoprofen and aspirin onto PCLD@NaOH were carried out at 25, 40, and 50 °C using 0.02 g of PCLD@NaOH and 100 mL of different concentrations of ketoprofen (20–500 mg L−1) for 1 h.2.5. Regeneration
The regeneration of PCLD@NaOH loaded by aspirin or ketoprofen was regenerated using ethanol. A mass of spent PCLD@NaOH (0.02 g) was mixed with 50 mL of ethanol. The mixture was kept under stirring (150 rpm) at room temperature for 3 hours in an orbital shaker. Then, the mixture was filtered and dried at 80 °C for 6 hours. The regeneration was repeated after each cycle of adsorption experiment.2.6. Equations applied in adsorption experiments
All equations used in this study related to kinetics, equilibrium, and thermodynamics of ketoprofen and aspirin adsorption onto PCLD@NaOH are presented in Table 1| Equations | Name | Parameters | References |
|---|---|---|---|
 |
Adsorption capacity | C0 (mg L−1) and Ce,t (mg L−1) are the initial and equilibrium concentrations, respectively. m (g) is the weight of adsorbent and V (L) is the volume of ketoprofen and aspirin | 41 |
 |
Removal efficiency | 42 | |
| Qt = Qcal(1 − expK1t) | Pseudo-first-order | Qe and Qt are the adsorbed ketoprofen and aspirin amounts at equilibrium and at times t, respectively. K1: the rate constant; K2: rate constant | 43 |
 |
Pseudo-second-order | 44 | |
| Qt = Qe(1 − exp(−KAVt)nAV) | Avrami fractional-order | KAV is the Avrami fractional-order constant rate (min−1), nAV is a fractional kinetic order (Avrami), which is related to the adsorption mechanism | 45 |
 |
Intraparticle diffusion | Kip (mg g−1 min−1/2): rate coefficient; C: thickness of the boundary layer | 46 |
 |
Langmuir isotherm | KL: direct measure of the intensity of the adsorption process; Qm: maximum adsorption capacity | 47 |
 |
Liu isotherm | Qmax is the maximum sorption capacity of the adsorbent (mg g−1), Kg is the Liu equilibrium constant (L mg−1) nL are the exponents of Liu model | 48 |
 |
Freundlich isotherm | KF: adsorption capacity; n: intensity of adsorption; n (constant): the Freundlich exponent representing the reaction order to determine whether the adsorption is favorable (n > 1) or not (n < 1) | 49 |
ΔG° = −RT![[thin space (1/6-em)]](https://www.rsc.org/images/entities/char_2009.gif) ln ln![[thin space (1/6-em)]](https://www.rsc.org/images/entities/char_2009.gif) Kc Kc |
Gibbs free energy | ΔG°: Gibbs free energy change; Kc: an equilibrium constant (dimensionless); R: gas constant; T: temperature | 50–52 |
 |
Van't Hoff | ΔS°: entropy change; ΔH°: enthalpy change |
2.7. DFT-based descriptors calculations
The reactivity of ketoprofen and aspirin molecule was computed by DFT calculations using Gaussian 5.0.8 program. The optimization of the full geometry of ketoprofen and aspirin was done using B3LYP/6-31G(d) basis set to perform electronic structure calculations.53 The geometry of ketoprofen and aspirin was optimized without any symmetry constraint.54 The quantum chemical descriptors were obtained from energies linked with the highest occupied molecular orbital (HOMO; EHOMO) and lowest unoccupied molecular orbital (LUMO; ELUMO), an energy gap (ΔE = ELUMO − EHOMO), the chemical potential (μ). The general behavior of ketoprofen and aspirin molecules may be analyzed using the global reactivity parameters resulting from DFT like hardness (η, chemical softness (S), and electrophilicity (ω), which can be associated with the Frontier orbital energies, hence:55,563 Results and discussion
3.1. Characterization of adsorbent
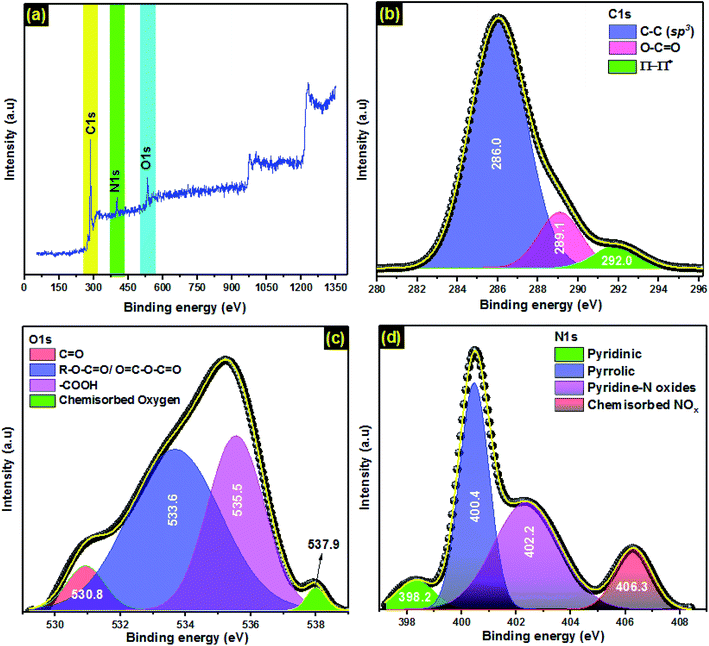
![[double bond, length as m-dash]](https://www.rsc.org/images/entities/char_e001.gif) O (289.1 eV), and satellite peaks due to π–π* transitions in aromatic rings exist in PCLD@NaOH (292.0 eV).57,58 The deconvolution of XPS O 1s peak of PCLD@NaOH revealed 4 components (Fig. 1c), C
O (289.1 eV), and satellite peaks due to π–π* transitions in aromatic rings exist in PCLD@NaOH (292.0 eV).57,58 The deconvolution of XPS O 1s peak of PCLD@NaOH revealed 4 components (Fig. 1c), C![[double bond, length as m-dash]](https://www.rsc.org/images/entities/char_e001.gif) O bond (530.8 eV), the peak at 533.6 eV related to ether oxygen atoms in ester and anhydrides, at 535.5 eV is ascribed to the oxygen atoms in the carboxyl groups, and at 537.9 eV is linked to chemisorbed oxygen.59 The XPS N 1s spectra of PCLD@NaOH (Fig. 1d) was decomposed into 4 components. The peak shown at 398.2 eV is attributed to pyridinic nitrogen; At 400.4 eV showed the pyrrolic; the pyridinic-N oxides were revealed at 402.2 eV, and the contribution of chemisorbed NOx was observed at 406.3 eV.58–60
O bond (530.8 eV), the peak at 533.6 eV related to ether oxygen atoms in ester and anhydrides, at 535.5 eV is ascribed to the oxygen atoms in the carboxyl groups, and at 537.9 eV is linked to chemisorbed oxygen.59 The XPS N 1s spectra of PCLD@NaOH (Fig. 1d) was decomposed into 4 components. The peak shown at 398.2 eV is attributed to pyridinic nitrogen; At 400.4 eV showed the pyrrolic; the pyridinic-N oxides were revealed at 402.2 eV, and the contribution of chemisorbed NOx was observed at 406.3 eV.58–60
![[double bond, length as m-dash]](https://www.rsc.org/images/entities/char_e001.gif) C bonds.31 Furthermore, the band at 1082 cm−1 confirmed the presence of sulfoxides in the structure of PCLD@NaOH.61 Finally, the peak located at 592 cm−1, which belongs to the aromatic C–H out-of-plane bending mode, point out the existence of aromatic benzene rings. Furthermore, Table 2 presents quantitative information on the acidic and basic groups on the PCLD@NaOH surfaces; the information was obtained through Boehm titration. Commonly, any adsorbent naturally coexists with both acidic and basic properties in solutions (amphoteric nature). The results show that the prepared adsorbent is rich in acidic groups (3.59 mmol g−1) and also basic groups (2.15 mmol g−1).
C bonds.31 Furthermore, the band at 1082 cm−1 confirmed the presence of sulfoxides in the structure of PCLD@NaOH.61 Finally, the peak located at 592 cm−1, which belongs to the aromatic C–H out-of-plane bending mode, point out the existence of aromatic benzene rings. Furthermore, Table 2 presents quantitative information on the acidic and basic groups on the PCLD@NaOH surfaces; the information was obtained through Boehm titration. Commonly, any adsorbent naturally coexists with both acidic and basic properties in solutions (amphoteric nature). The results show that the prepared adsorbent is rich in acidic groups (3.59 mmol g−1) and also basic groups (2.15 mmol g−1).
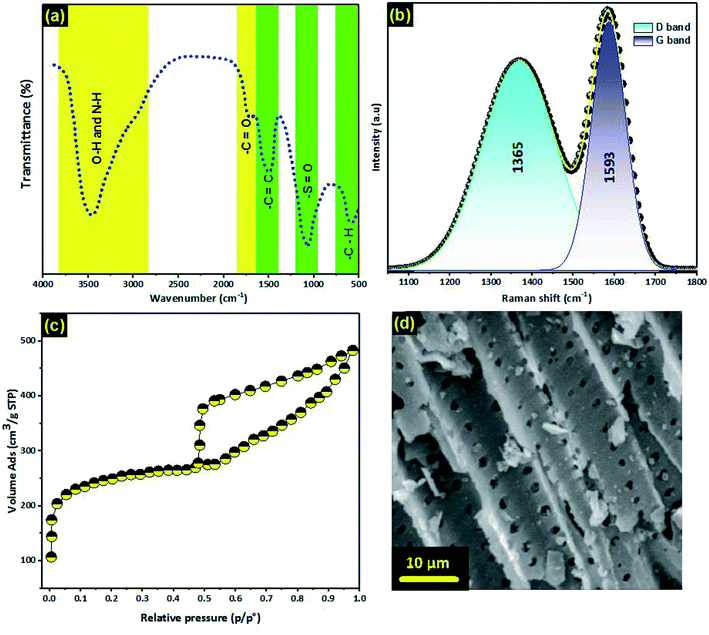 | ||
| Fig. 2 (a) FTIR spectra; (b) Raman spectra; (c) adsorption–desorption isotherm; (d) SEM image of PCLD@NaOH. | ||
| Carboxylic (mmol g−1) | Lactone (mmol g−1) | Phenolic (mmol g−1) | Total acidity (mmol g−1) | Total basicity (mmol g−1) | |
|---|---|---|---|---|---|
| PCLD@NaOH | 2.06 | 0.67 | 0.86 | 3.59 | 2.15 |
| BET surface area (m2 g−1) | Micropore area (m2 g−1) | Total pore volume (cm3 g−1) | External surface area (m2 g−1) | Average pore diameter (nm) | |
|---|---|---|---|---|---|
| PCLD@NaOH | 799 | 543 | 1.12 | 256 | 1.98 |
The SEM image of PCLD@NaOH (Fig. 2d) looked like the sieve with a well-developed and homogenous micro-pores structure. These micro-pores structures occurred from NaOH burn out by pyrolysis of LD algae at 600 °C. The well-developed structure of PCLD@NaOH might be advantageous for the adsorption of ketoprofen and aspirin molecules.
3.2. Effect of adsorbent mass and initial pH effect
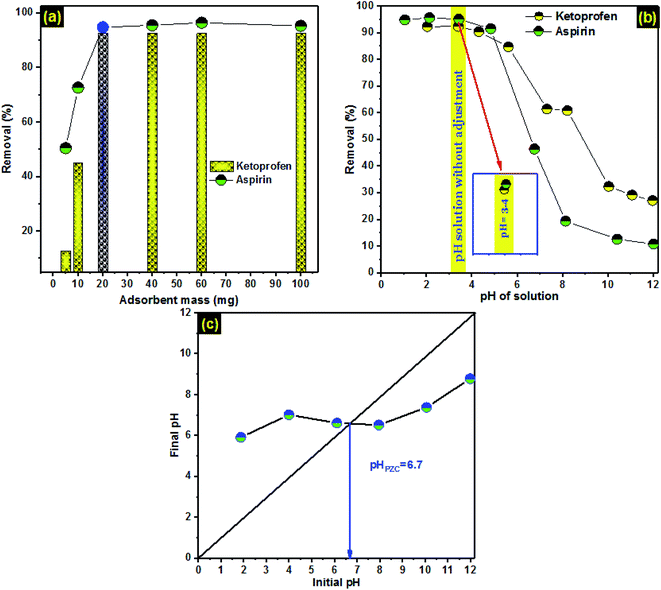
The effect of PCLD@NaOH mass on ketoprofen and aspirin adsorption (Fig. 3a) shows that the removal efficiency of ketoprofen and aspirin by PCLD@NaOH increased by increased the mass of PCLD@NaOH from 5 mg to 20 mg. Increasing the quantity of PCLD@NaOH offers more open binding sites. The highest removal efficiency was obtained with 20 mg of PCLD@NaOH which is corresponding to 92% and 95% removal of ketoprofen and aspirin, respectively. Henceforth, the mass of PCLD@NaOH used for next experiments is 20 mg.In order to explain the influence of pH solution on adsorption efficiency, the value of pHZPC is an important parameter that decides the nature of charges on the surface of an adsorbent.63 PCLD@NaOH has a pHZPC of 6.7, as revealed in Fig. 3c. Consequently, the surface of PCLD@NaOH has positive charges at pH < 6.7 and negative charges at pH > 6.7. Fig. 3b displays the relation between PCLD@NaOH performance and solution pH (2.0–12.0) for the aspirin and ketoprofen molecules with an initial concentration of 150 mg L−1. The original pH of both molecules solution was around 3.20. The removal of aspirin and ketoprofen was mostly higher in acidic solutions than in the basic region. The high aspirin uptake of 95% was reported at pH 3.4 relative to 10.84 at pH 12.0. Similarly, the high ketoprofen removal (92%) was observed at pH 3.4 and 27.16% at pH 12.0. During the adsorption on PCLD@NaOH at pH 3, the aspirin and ketoprofen molecules are in their neutral forms.14,23,64 They can form strong H-bonds with oxygen-containing surface functional groups present in PCLD@NaOH and be not repelled by the surface positive charge.65 Accordingly, they presented their highest aspirin adsorption at pH 3.4, which was close to the original pH of the aspirin solution. As the solution pH increased from 3.4 to 12.0, aspirin and ketoprofen were progressively transformed to its carboxylate conjugate bases, which were repelled from the increasingly negatively charged PCLD@NaOH surfaces. For that reason, the removal of aspirin and ketoprofen in molecular form was favorable to the PCLD@NaOH, while the removal of the anionic state of aspirin and ketoprofen were unfavorable. Duplicate remarks were stated in the literature for the adsorption of aspirin and ketoprofen.14,23,24
3.3. Adsorption kinetic
Kinetic studies give interesting information about the entire adsorption process counting operation control and evaluation of the adsorbent efficiencies.45,66,67 Herein, the effect of contact time on adsorption of ketoprofen and aspirin by PCLD@NaOH was studied using nonlinear pseudo-first order, pseudo-second order, and Avrami fractional-order kinetic models. The kinetic curves and fitting parameters of the models are presented in Fig. 4 and Table 3, respectively. The accuracy of each model is clarified using the values of the standard deviation of residues (SD). Lower SD value designates smaller disparity between theoretical and experimental Q values. To compare the appropriateness of each model, the SD of each model was divided by the SD of the minimum value to obtain the SD ratio. Avrami fractional-order model has the lowest SD ratio values compared to pseudo-first order and pseudo-second-order models. Consequently, the Avrami fractional-order model describes well the adsorption kinetics of ketoprofen and aspirin onto PCLD@NaOH. The kinetic rate constant of the kinetic models has dissimilar units; it is hard to compare the rates of the kinetics of adsorption of ketoprofen and aspirin.68 The half-life (t1/2), which is the time to reach 50% of adsorption capacity at the equilibrium (Qe), was calculated by interpolation in the fitting kinetic curve. It is observed that t1/2 of aspirin (6.486 min) was lower than t1/2 of ketoprofen (8.424 min). Therefore, the time for attaining the equilibrium was so fast in the case of aspirin compared to ketoprofen.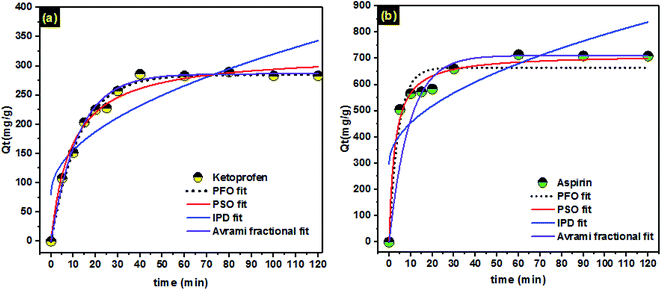 | ||
| Fig. 4 Nonlinear kinetic model: pseudo-first-order (PFO), pseudo-second-order (PSO), intraparticle diffusion (IPD), and Avrami fractional model of (a) aspirin (b) ketoprofen. | ||
| Ketoprofen | Aspirin | |
|---|---|---|
| Qe,exp (mg g−1) | 286 | 714 |
![[thin space (1/6-em)]](https://www.rsc.org/images/entities/char_2009.gif) |
||
| Pseudo-first-order | ||
| Qe,cal (mg g−1) | 286.62 | 711.19 |
| K1 (min−1) | 0.082 | 0.106 |
| t1/2 (min) | 8.453 | 6.539 |
| R2 | 0.999 | 0.999 |
| SD (mg g−1) | 2.926 | 2.990 |
![[thin space (1/6-em)]](https://www.rsc.org/images/entities/char_2009.gif) |
||
| Pseudo-second-order | ||
| Qe,cal (mg g−1) | 305.14 | 736.16 |
| K2 (g mg−1 min−1) | 0.0005 | 0.0004 |
| t1/2 (min) | 6.554 | 3.396 |
| R2 | 0.998 | 0.998 |
| SD (mg g−1) | 6.997 | 8.645 |
![[thin space (1/6-em)]](https://www.rsc.org/images/entities/char_2009.gif) |
||
| Avrami-fractional-order | ||
| KAV (min−1) | 0.177 | 1.023 |
| Qe,cal (mg g−1) | 286.62 | 711.19 |
| nAV | 0.463 | 0.104 |
| t1/2 (min) | 8.424 | 6.486 |
| t0.95 (min) | 36.756 | 28.228 |
| R2 | 0.999 | 0.999 |
| SD (mg g−1) | 2.056 | 2.708 |
![[thin space (1/6-em)]](https://www.rsc.org/images/entities/char_2009.gif) |
||
| Intraparticle diffusion model | ||
| Kip (mg g−1 min−1/2) | 24.02 | 49.34 |
| C (mg g−1) | 80.01 | 298.09 |
| R2 | 0.744 | 0.616 |
In order to define the time needed to accomplish the equilibrium, an interpolation was made on the Avrami fractional-order kinetic model plot for ketoprofen and aspirin adsorption. In this calculation, the value of Qt that was 95% of the maximum value of experimental Qe was used.69 This time is defined as t0.95. The t0.95 was calculated just for the Avrami fractional-order kinetic model because it was the best kinetic model for fitting the ketoprofen and aspirin experimental data in this work. Examining the values stated in Table 3, the maximum t0.95 is 36.756 min and 28.228 min for ketoprofen and aspirin, respectively. Rapid adsorption of aspirin onto PCLD@NaOH designated high affinity between the aspirin molecules and the surfaces of the PCLD@NaOH compared to ketoprofen. For subsequent experiments, the contact time was fixed at 60 min for both pollutants molecules.
Moreover, Fig. 4 displays the curve-fitting plots of IPD model for ketoprofen and aspirin adsorption. The values of the intercept C (ketoprofen: 80.01 mg g−1; aspirin: 298.09 mg g−1), give an idea about the boundary layer thickness: the larger intercept, the greater is the boundary layer effect in adsorption by PCLD@NaOH. Meanwhile, the plots do not pass over the origin, this indicates that there lies some degree of boundary layer control and the IPD is not the solitary rate-controlling step, but also additional processes may control the rate of adsorption.70 Henceforth, the IPD model is not appropriate for describing the ketoprofen and aspirin removal from water onto PCLD@NaOH. It can be concluding that the PSO model described well the kinetics data of ketoprofen and aspirin instead of PFO and IPD models. The best fitting of analysis kinetics data by PSO model for ketoprofen and aspirin were also observed for ketoprofen onto MIL-101(Cr)/natural polymer composite beads23 and aspirin on biochar.14
3.4. Adsorption isotherms
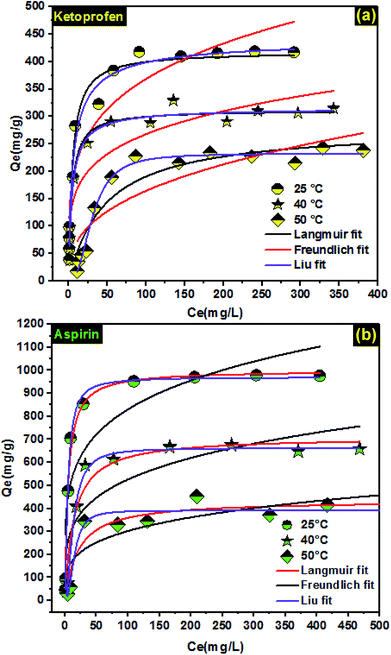
Fitting adsorption isotherms data using the non-linear equation of Langmuir, Freundlich, and Liu models (Table 1) is a useful approach to describe the relationship between the ketoprofen and aspirin concentration in the solution (liquid phase) and the PCLD@NaOH (solid phase) at a constant temperature and design adsorption systems. The adsorption isotherm of ketoprofen and aspirin onto PCLD@NaOH at different temperature are illustrated in Fig. 5, and the corresponding parameters of aspirin and ketoprofen adsorption are presented in Table 4. The SD values of the Langmuir model range from 16 to 21 (ketoprofen) and 21 to 33 (aspirin). The SD ratios of Freundlich model range from 29 to 36 (ketoprofen) and 40 to 83 (aspirin). Liu isotherm was the most appropriate model for the adsorption of ketoprofen and aspirin. The Liu model showed the lowest SD and highest R2 values. This result means that the Q values obtained experimentally are very close to those Q values calculated by the isotherm model.45,71,72 Furthermore, the ketoprofen and aspirin adsorption was significantly influenced by the operating temperatures. The amount of aspirin and ketoprofen adsorbed decreased with increasing temperature, indicating that the adsorption of ketoprofen and aspirin is of exothermic nature. These results show that the decrease of adsorption at a high temperature can be attributed to the greater tendency of ketoprofen and aspirin molecules to form hydrophobic bonds in an aqueous medium, thus hindering their hydrophobic interactions with the adsorbent surface.73 On the other hand, the decreased adsorption at equilibrium is owing to decreased surface activity at higher temperatures.74| Temperature | Ketoprofen | Aspirin | ||||
|---|---|---|---|---|---|---|
| 25 °C | 40 °C | 50 °C | 25 °C | 40 °C | 50 °C | |
| Langmuir | ||||||
| Qmax (mg g−1) | 418.46 | 311.67 | 280.87 | 1000.29 | 711.36 | 435.52 |
| KL (L mg−1) | 0.212 | 0.246 | 0.021 | 0.199 | 0.069 | 0.047 |
| R2 | 0.975 | 0.979 | 0.910 | 0.989 | 0.955 | 0.919 |
| SD (mg g−1) | 21.249 | 16.352 | 21.257 | 21.440 | 33.537 | 30.859 |
![[thin space (1/6-em)]](https://www.rsc.org/images/entities/char_2009.gif) |
||||||
| Freundlich | ||||||
| KF (mg g−1) (L mg−1)1/n | 125.97 | 101.95 | 29.88 | 326.13 | 177.38 | 91.70 |
| n | 4.29 | 4.76 | 2.70 | 4.92 | 4.23 | 3.86 |
| R2 | 0.903 | 0.871 | 0.787 | 0.804 | 0.745 | 0.737 |
| SD (mg g−1) | 29.414 | 36.736 | 32.009 | 83.505 | 65.547 | 40.333 |
![[thin space (1/6-em)]](https://www.rsc.org/images/entities/char_2009.gif) |
||||||
| Liu | ||||||
| Qmax (mg g−1) | 443.45 | 315.81 | 232.51 | 970.88 | 662.90 | 391.59 |
| Kg (L mg−1) | 0.167 | 0.228 | 0.032 | 0.211 | 0.075 | 0.066 |
| nL | 0.774 | 0.922 | 2.482 | 1.347 | 1.858 | 2.362 |
| R2 | 0.988 | 0.983 | 0.984 | 0.997 | 0.994 | 0.945 |
| SD (mg g−1) | 11.464 | 6.613 | 5.229 | 11.135 | 10.547 | 12.045 |
The Qmax values obtained by Liu model at 25 °C, 40 °C, and 50 °C were as follows: 443.45 mg g−1 > 315.81 mg g−1 > 232.51 mg g−1 for ketoprofen and 970.88 mg g−1 > 662.90 mg g−1 > 391.59 mg g−1 for aspirin.
By comparing our results with other previously reported adsorbents (Table 5), it could be seen that the adsorption capacity of PCLD@NaOH was higher for both ketoprofen and aspirin molecules, suggesting that the prepared PCLD@NaOH might be a potential candidate for removal of pharmaceutical molecules from aqueous solution.
| Adsorbent | Qmax (mg g−1) | Reference | |
|---|---|---|---|
| Ketoprofen | PCLD@NaOH | 443.45 | This work |
| Molecularly imprinted polymer (MIP) | 8.7 | 75 | |
| Activated carbon | 25 | 76 | |
| MIL-101-(OH)3 | 80 | 77 | |
| Graphene oxide | 63 | 78 | |
| MIL-101(Cr)/CS | 156 | 23 | |
| Aspirin | PCLD@NaOH | 970.88 | This work |
| Activated carbon | 178.57 | 79 | |
| AC derived from rice hull (H3PO4/500 °C) | 178.89 | 80 | |
| Fe/N-CNT/β-cyclodextrin nanocomposites | 71.9 | 81 | |
| Graphene nanoplatelets | 12.98 | 82 |
3.5. Thermodynamic behavior
The behavior of adsorption (i.e., physical or chemical) can be sensibly understood over the study of adsorption thermodynamics. The thermodynamic parameters (ΔG°, ΔH°, and ΔS°) can be computed by the Van't Hoff approach.51,83 In this section, we applied Van't Hoff equation and Gibbs energy equations (Table 1) to calculate the thermodynamic parameters of the ketoprofen and aspirin adsorption onto PCLD@NaOH (Fig. 6a). From Table 6, the negative ΔG° values at all examined temperatures for ketoprofen and aspirin specify that the adsorption phenomenon happened spontaneously. Moreover, the negative (−ΔS°) values reveal that the organization of ketoprofen and aspirin molecules at the solid/solution interface through the adsorption process onto PCLD@NaOH becomes less random when the temperature increases. A negative value of ΔH° advises that the adsorption process happened exothermically. An exothermic process is clearly recognized to physical adsorption (physisorption) with the presence of relatively weak interactions (i.e., van der Waals force); consequently, the amount of ketoprofen and aspirin adsorbed tends to desorb easily when temperature increases (exothermic).84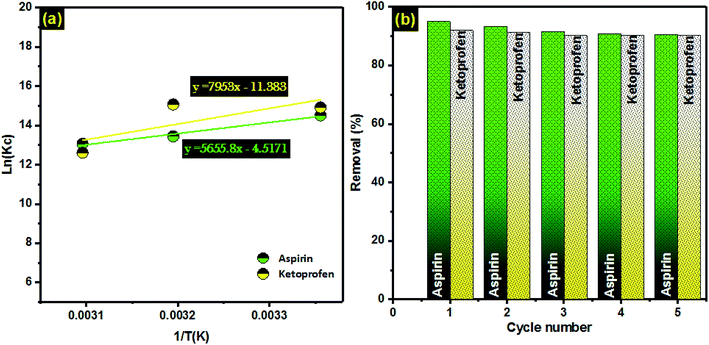 | ||
Fig. 6 (a) Linear dependence of ln![[thin space (1/6-em)]](https://www.rsc.org/images/entities/char_2009.gif) Kc on 1/T based on the adsorption thermodynamics; (b) regeneration and recyclability of PCLD@NaOH over five cycles of use. Kc on 1/T based on the adsorption thermodynamics; (b) regeneration and recyclability of PCLD@NaOH over five cycles of use. | ||
| ΔH (kJ mol−1) | ΔS (J mol−1 K−1) | ΔG (kJ mol−1) | ||||
|---|---|---|---|---|---|---|
| 298 K | 313 K | 323 K | ||||
| Ketoprofen | −66.121 | −94.638 | KC | 2![[thin space (1/6-em)]](https://www.rsc.org/images/entities/char_2009.gif) 991 991![[thin space (1/6-em)]](https://www.rsc.org/images/entities/char_2009.gif) 858 858 |
3![[thin space (1/6-em)]](https://www.rsc.org/images/entities/char_2009.gif) 471 471![[thin space (1/6-em)]](https://www.rsc.org/images/entities/char_2009.gif) 685 685 |
296![[thin space (1/6-em)]](https://www.rsc.org/images/entities/char_2009.gif) 363 363 |
| −36.944 | −33.190 | −33.834 | ||||
| Aspirin | −47.022 | −37.555 | KC | 1![[thin space (1/6-em)]](https://www.rsc.org/images/entities/char_2009.gif) 989 989![[thin space (1/6-em)]](https://www.rsc.org/images/entities/char_2009.gif) 755 755 |
689![[thin space (1/6-em)]](https://www.rsc.org/images/entities/char_2009.gif) 915 915 |
469![[thin space (1/6-em)]](https://www.rsc.org/images/entities/char_2009.gif) 942 942 |
| −35.933 | −34.985 | −35.072 | ||||
3.5. Regeneration of adsorbent
To envisage the regeneration of PCLD@NaOH, ethanol was used to desorb aspirin and ketoprofen from PCLD@NaOH.85,86 The reusability of the PCLD@NaOH was determined using 5 cycles of adsorption-regeneration. A sample of 20 mg of PCLD@NaOH was shaken with 100 mL solution of aspirin and ketoprofen (150 mg L−1) for 2 h at room temperature. Then, the PCLD@NaOH was filtered, washed and then dried at 100 °C. After each adsorption, the regeneration process was repeated. Fig. 6b demonstrates that the adsorption efficacy of PCLD@NaOH after 5 adsorption–regeneration cycles is ∼90.6% for aspirin and 90.2% for ketoprofen. Correspondingly, the removal rate of aspirin and ketoprofen was diminished by 4.6% and 1.95% after 5 cycles, respectively. These results validate that PCLD@NaOH reveals outstanding stability and can be used many times without a significant loss in the adsorption proficiency of aspirin and ketoprofen.3.6. Proposed mechanism
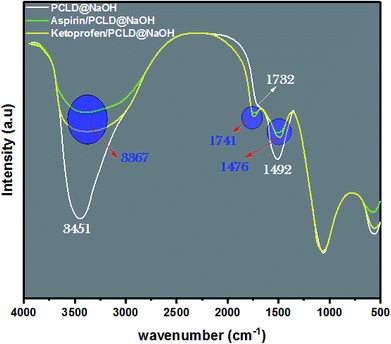
To elucidate the adsorption mechanism of ketoprofen and aspirin on PCLD@NaOH, FTIR spectroscopy was used to study the behavior of PCLD@NaOH before and after adsorption (Fig. 7). Mostly, the possible mechanisms for the adsorption of organic pollutants on carbon materials are an electrostatic attraction, hydrogen bond formation, n–π interaction, π–π interaction, and pores filling.85,87,88 The FTIR pattern of ketoprofen loaded PCLD@NaOH and aspirin loaded PCLD@NaOH shows that the peaks around 3451, 1732, and 1492 cm−1 are slightly shifted from their initial location to 3367, 1741, and 1476 cm−1, respectively (Fig. 7). Whereas the peak situated at 3354 cm−1 is linked to –OH groups and the peak detected at 1732 cm−1 is analogous to C![[double bond, length as m-dash]](https://www.rsc.org/images/entities/char_e001.gif) O and at 1492 cm−1 is ascribed to C
O and at 1492 cm−1 is ascribed to C![[double bond, length as m-dash]](https://www.rsc.org/images/entities/char_e001.gif) C of the aromatic rings. The move of these peaks can be understood by the formation of hydrogen bonds between hydroxyl groups present in ketoprofen and aspirin molecules and PCLD@NaOH, and hydrogen bonds between –OH present in PCLD@NaOH with –C
C of the aromatic rings. The move of these peaks can be understood by the formation of hydrogen bonds between hydroxyl groups present in ketoprofen and aspirin molecules and PCLD@NaOH, and hydrogen bonds between –OH present in PCLD@NaOH with –C![[double bond, length as m-dash]](https://www.rsc.org/images/entities/char_e001.gif) O present in the ketoprofen and aspirin molecules.87–89 Finally, the shift of C
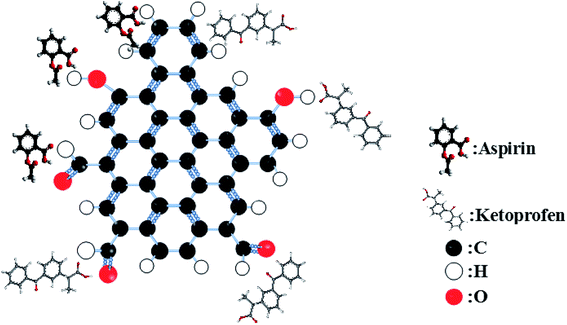
O present in the ketoprofen and aspirin molecules.87–89 Finally, the shift of C![[double bond, length as m-dash]](https://www.rsc.org/images/entities/char_e001.gif) C is explained by the π–π interaction between ketoprofen and aspirin on PCLD@NaOH. In Fig. 8, the schematic representation of the π–π interaction and hydrogen bonding between ketoprofen and aspirin with PCLD@NaOH is presented.
C is explained by the π–π interaction between ketoprofen and aspirin on PCLD@NaOH. In Fig. 8, the schematic representation of the π–π interaction and hydrogen bonding between ketoprofen and aspirin with PCLD@NaOH is presented.
3.7. Theoretical investigation of ketoprofen and aspirin reactivity using DFT approach
The electronic molecular descriptors of ketoprofen and aspirin molecules and their values calculated are exposed in Table 7. Fig. 9 and 10 shows the optimized geometries, the electrostatic surface potential (ESP), HOMO, and LUMO orbitals of ketoprofen and aspirin molecules. Molecular orbitals play an essential role in the understanding of the chemical reactivity at the atomic level. Furthermore, they are important descriptors for the explanation of various chemical reactions. The EHOMO and ELUMO energies values calculated for the studied pharmaceutical pollutants are aspirin (EHOMO = −7.103 eV; EL = −1.568 eV) and ketoprofen (EH = −6.913 eV; EL = −0.594 eV). The values of the HOMO–LUMO energy gap (ΔE) calculated for tested molecules are aspirin (ΔE = 5.5351 eV), and ketoprofen (ΔE = 6.3191 eV). The results indicate that aspirin is more reactive because of the low value of the energy gap (ΔE).90 The values of electrophilicity index (ω) for aspirin (ω = 9.400 eV) is higher than ketoprofen (ω = 7.045 eV) which suggest that aspirin is more electrophile than ketoprofen.91 A strong and more reactive electrophile species is characterized by a high value of chemical potential (μ) and electrophilicity index (ω); the chemical potential (μ) displays the escaping tendency of electrons in a molecule.92 The values of chemical potential (μ) calculated for the studied pollutants are aspirin (μ = 4.335 eV) and ketoprofen (μ = 3.753 eV). Hence, the aspirin molecule has a high value of μ and ω compared to ketoprofen, accordingly, the aspirin molecule is more reactive electrophile than ketoprofen.| EHOMO (eV) | ELUMO (eV) | μ (eV) | ΔE (eV) | η (eV) | S (ev) | ω (ev) | |
|---|---|---|---|---|---|---|---|
| Aspirin | −7.103 | −1.568 | 4.335 | 5.535 | 2.767 | 0.361 | 9.400 |
| Ketoprofen | −6.913 | −0.594 | 3.753 | 6.319 | 3.159 | 0.316 | 7.045 |
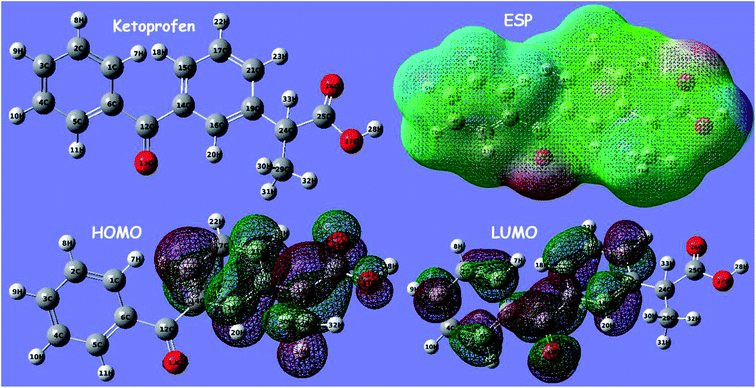 | ||
| Fig. 9 Optimized geometry of ketoprofen, the electrostatic surface potential (ESP), highest occupied orbital (HOMO), and lowest molecular orbital (LUMO) structure computed using DFT method. | ||
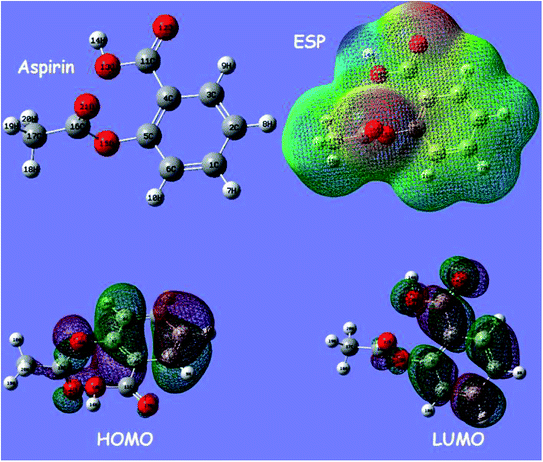 | ||
| Fig. 10 Optimized geometry of aspirin, the electrostatic surface potential (ESP), highest occupied orbital (HOMO), and lowest molecular orbital (LUMO) structure computed using DFT method. | ||
The stability of aspirin and ketoprofen molecules and its reactivity can be related to chemical hardness (η). The molecule of aspirin (η = 2.767 eV) has a low hardness value compared to ketoprofen (η = 3.159 eV). Generally, a hard molecule has a large energy gap (ΔE), while soft molecule has a small energy gap (Table 7) and is more reactive.56,92
According to obtained results from calculated quantum descriptors, aspirin molecule present high reactivity, electrophilicity, and softness compared to ketoprofen molecules. These outcomes are in good agreement with adsorption experiments and confirm the experimental results related to the high adsorption capacity of aspirin on PCLD@NaOH compared to ketoprofen.
3.8. Optimization using response surface approach
To obtain optimum operational parameters that affect ketoprofen and aspirin adsorption onto PCLD@NaOH, response surface methodology (RSM) was used to this purpose.26,93–96 In Table 8, we present the experimental levels of ketoprofen and aspirin adsorption on PCLD@NaOH, respectively. In addition, the experimental results were obtained by using the CCD matrix (Table 1S†). In this work, a quadratic polynomial equation was nominated to study the influence of parameters and links the response (removal efficiency) with factors (equation below).| Y = b0 + b1 × X1 + b2 × X2 + b3 × X3 + b1–1 × (X1 × X1) + b2–2 × (X2 × X2) + b3–3 × (X3 × X3) + b1–2 × (X1 × X2) + b1–3 × (X1 × X3) + b2–3 × (X2 × X3) |
| Variable | Factor | Unit | −2 (α) | −1 | 0 | 1 | +2 (α) |
|---|---|---|---|---|---|---|---|
| X1 | Adsorbent mass | mg | 10.00 | 15.00 | 20.00 | 25.00 | 30.00 |
| X2 | pH | 1.40 | 2.40 | 3.40 | 4.40 | 5.40 | |
| X3 | Concentration | mg L−1 | 50.00 | 100.00 | 150.00 | 200.00 | 250.00 |
| X4 | Temperature | °C | 5.00 | 15.00 | 25.00 | 35.00 | 45.00 |
The established models for ketoprofen and aspirin adsorption by PCLD@NaOH were giving below using the quadratic polynomial equation.
| R% (ketoprofen) = 92.567 + 8.662X1 − 3.835X2 − 3.184X3 − 8.250X4 − 12.258X1–1 − 3.071X2–2 − 4.844X4–4 − 1.898X1–3 − 1.512X1–4 − 4.386X3–4 |
| R% (aspirin) = 95.347–0.016X2 – 2.555X3 − 1.787X4 − 0.093 X3–3 − 0.614X1–2 − 0.293X1–4 − 0.021X2–4 – 2.947X3–4 |
ANOVA analysis (Table 2S†) was utilized in this work to determine the adequacy of the predicted model.97,98 Therefore, ‘P-value’ less than 0.05 infer that designed models were significant for both ketoprofen and aspirin. The correlation coefficient (R2) and the adjusted correlation coefficient (RAdj2) were close to 0.99 for both ketoprofen and aspirin systems, showing the existence of a good correlation between data.26 Besides, the coefficients significations of ketoprofen and aspirin models were studied and their P-values were evaluated to confirm the significance of each one of them. From Table 2S,† the coefficients with P-values less than 0.05 are significant while the others that are below 0.05 are insignificant. In addition, Fig. 1S† shows the homogenous distribution of the residues on the “0” axis, and the experimental removal (%) values are very well aligned on the Henry line, which confirmed the normality of the residues and the absence of the outliers for both molecules.99
Fig. 2S† illustrates the Pareto chart which gives an idea about the most influenced factors and its interactions.100,101 Therefore, the results presented in Fig. 2Sa† shows that the interaction temperature × temperature present more than 87% of aspirin removal responses. In the case of ketoprofen adsorption, the factors adsorbent mass/temperature and their interaction influence the removal efficacy by 80%. As a result, Pareto analysis demonstrated that the effect of temperature on removal responses of aspirin and ketoprofen was higher compared to other factors. This finding approved the results obtained in Section 3.4 adsorption isotherm. By increasing temperature, the adsorption capacity of both molecules decreased dramatically.
Fig. 3S and 4S† displayed the 2D presentations for ketoprofen and aspirin adsorption in different plans. In this presentation, a response surface is a parabolic form, which shows that the significant responses are concentrated in the center of experimental domains. Indeed, the variation of pH from 1.4 to 5.4 with the adsorbent dose favors a considerable increase of ketoprofen and aspirin adsorption (Fig. 3S and 4S†). 2D presentations allow examining the variation and influence of factors and shows that the plan temperature adsorbent dose was the perfect plan for possible optimization. In addition, the RSM approach was utilized as a numerical optimization for ketoprofen and aspirin adsorption optimization (Fig. 11 and 12) based on the elaborated equations. Rendering to RSM, the optimum parameters for ketoprofen and aspirin maximum removal are cited in Table 3S.† These parameters were investigated in experimental tests, and 86.12% ± 4.80 and 95.33% ± 2.09 were achieved for ketoprofen and aspirin adsorption onto PCLD@NaOH, respectively. These outcomes proving the importance of modeling and optimization section to valorize this present work.
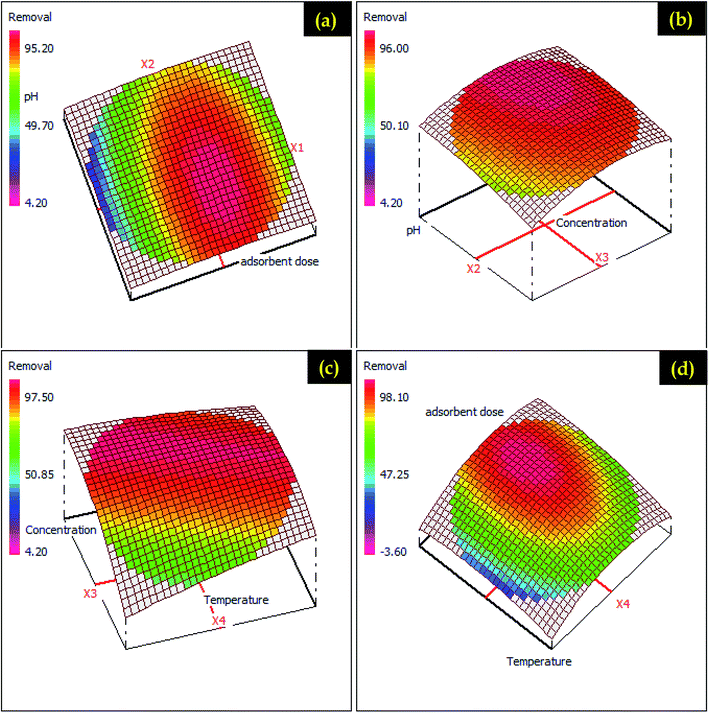 | ||
| Fig. 11 RSM presentations for ketoprofen adsorption on different possible plans (a) adsorbent dose – pH (b) pH – concentration (c) concentration – temperature and (d) adsorbent dose – temperature. | ||
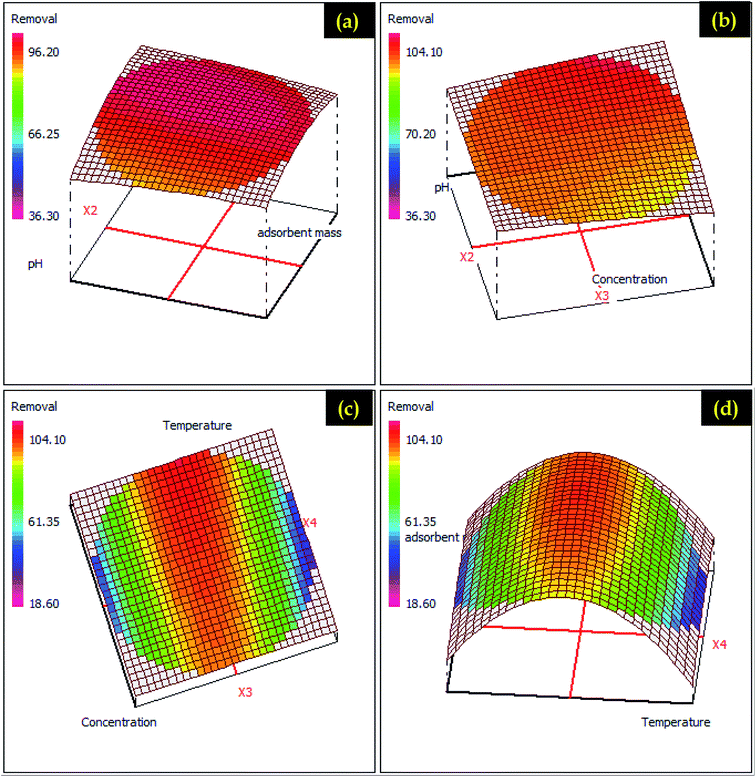 | ||
| Fig. 12 RSM presentations for aspirin adsorption on different possible plans (a) adsorbent dose – pH (b) pH – concentration (c) concentration – temperature and (d) adsorbent dose – temperature. | ||
Conclusion
This study examined the adsorption of ketoprofen and aspirin from aqueous solution using NaOH modified Laminaria digitata algae (PCLD@NaOH) as an adsorbent. The PCLD@NaOH was well produced using the chemical method, and full characterized. Several factors such as ketoprofen and aspirin concentration, pH solution, PCLD@NaOH mass, and temperature were investigated. The adsorption of ketoprofen and aspirin on PCLD@NaOH follows the Avrami-fractional kinetic model, and the Liu isotherm model describes well the adsorption process. The maximum adsorption capacity of 970.88 mg g−1 and 443.45 mg g−1 was obtained at 25 °C for aspirin and ketoprofen, respectively. The thermodynamic studies showed that the adsorption process of ketoprofen and aspirin is exothermic and spontaneous. The theoretical study by DFT calculation confirmed the experimental results through the study of ketoprofen and aspirin reactivity. Finally, based on response surface method optimization, the models predicted a maximum ketoprofen removal (85.56% ± 3.02) and aspirin removal (94.97% ± 1.57) under optimum conditions are very close to the experimental (ketoprofen: 86.12% ± 4.80; aspirin: 95.33% ± 2.09)Conflicts of interest
Authors declare no conflict of interest.References
- A. Sofowora, E. Ogunbodede and A. Onayade, Afr. J. Tradit., Complementary Altern. Med., 2013, 10, 210–229 Search PubMed
.
- A. B. A. Boxall, EMBO Rep., 2004, 5, 1110–1116 CrossRef CAS PubMed
.
- D. Fatta-Kassinos, S. Meric and A. Nikolaou, Anal. Bioanal. Chem., 2011, 399, 251–275 CrossRef CAS PubMed
.
- S. Caroli and A. B. Caracciolo, Toxicol. Environ. Chem., 2010, 92, 549–565 CrossRef
.
- S. Kar, K. Roy and J. Leszczynski, in Impact of Pharmaceuticals on the Environment: Risk Assessment Using QSAR Modeling Approach, ed. O. Nicolotti, Springer New York, New York, NY, 2018, pp. 395–443 Search PubMed
.
- K. Fent, A. A. Weston and D. Caminada, Aquat. Toxicol., 2006, 76, 122–159 CrossRef CAS PubMed
.
- M. Liebig, J. F. Moltmann and T. Knacker, Environ. Sci. Pollut. Res. Int., 2006, 13, 110–119 CrossRef CAS PubMed
.
- N. Nakada, T. Tanishima, H. Shinohara, K. Kiri and H. Takada, Water Res., 2006, 40, 3297–3303 CrossRef CAS PubMed
.
- A. Tauxe-Wuersch, L. F. De Alencastro, D. Grandjean and J. Tarradellas, Water Res., 2005, 39, 1761–1772 CrossRef CAS PubMed
.
- Y.-J. Liu, S.-L. Lo, Y.-H. Liou and C.-Y. Hu, Sep. Purif. Technol., 2015, 152, 148–154 CrossRef CAS
.
- T. Kosjek, E. Heath and A. Krbavčič, Environ. Int., 2005, 31, 679–685 CrossRef CAS PubMed
.
- A. Togola and H. Budzinski, J. Chromatogr. A, 2008, 1177, 150–158 CrossRef CAS PubMed
.
- M. D. Hernando, E. Heath, M. Petrovic and D. Barceló, Anal. Bioanal. Chem., 2006, 385, 985–991 CrossRef CAS PubMed
.
- M. J. Ahmed and B. H. Hameed, J. Cleaner Prod., 2018, 195, 1162–1169 CrossRef CAS
.
- L. M. Madikizela, S. F. Muthwa and L. Chimuka, S. Afr. J. Chem., 2014, 67, 143–150 Search PubMed
.
- F. O. Agunbiade and B. Moodley, Environ. Toxicol. Chem., 2016, 35, 36–46 CrossRef CAS PubMed
.
- S. S. Zunngu, L. M. Madikizela, L. Chimuka and P. S. Mdluli, C. R. Chim., 2017, 20, 585–591 CrossRef CAS
.
- W.-K. Jo and T. Sivakumar Natarajan, ACS Appl. Mater. Interfaces, 2015, 7, 17138–17154 CrossRef CAS PubMed
.
- Y. Zeng, X. Lin, F. Li, P. Chen, Q. Kong, G. Liu and W. Lv, RSC Adv., 2018, 8, 10541–10548 RSC
.
- A. F. Martins, C. A. Mallmann, D. R. Arsand, F. M. Mayer and C. G. B. Brenner, Clean: Soil, Air, Water, 2011, 39, 21–27 CAS
.
- W.-L. Chou, C.-T. Wang, K.-Y. Huang and T.-C. Liu, Desalination, 2011, 271, 55–61 CrossRef CAS
.
- N. Ouasfi, S. Bouzekri, M. Zbair, H. Ait Ahsaine, S. Bakkas, M. Bensitel and L. Khamliche, Surf. Interfaces, 2019, 14, 61–71 CrossRef CAS
.
- N. Zhuo, Y. Lan, W. Yang, Z. Yang, X. Li, X. Zhou, Y. Liu, J. Shen and X. Zhang, Sep. Purif. Technol., 2017, 177, 272–280 CrossRef CAS
.
- Z. Hasan, E. J. Choi and S. H. Jhung, Chem. Eng. J., 2013, 219, 537–544 CrossRef CAS
.
- J. Y. Song, B. N. Bhadra and S. H. Jhung, Microporous Mesoporous Mater., 2017, 243, 221–228 CrossRef CAS
.
- M. Zbair, K. Ainassaari, Z. El Assal, S. Ojala, N. El Ouahedy, R. L. Keiski, M. Bensitel and R. Brahmi, Environ. Sci. Pollut. Res., 2018, 25, 35657–35671 CrossRef CAS PubMed
.
- M. Zbair, K. Ainassaari, A. Drif, S. Ojala, M. Bottlinger, M. Pirilä, R. L. Keiski, M. Bensitel and R. Brahmi, Environ. Sci. Pollut. Res., 2018, 25, 1869–1882 CrossRef CAS PubMed
.
- X. Zhang, C. Qin, Y. Gong, Y. Song, G. Zhang, R. Chen, Y. Gao, L. Xiao and S. Jia, RSC Adv., 2019, 9, 5313–5324 RSC
.
- Z. Li, L. Chen, Q. Su, L. Wu, X. Wei, L. Zeng and M. Li, RSC Adv., 2019, 9, 5110–5120 RSC
.
- W. Kong and J. Liu, RSC Adv., 2019, 9, 4925–4931 RSC
.
- H. N. Tran, S.-J. You and H.-P. Chao, J. Environ. Manage., 2017, 188, 322–336 CrossRef CAS PubMed
.
- M. T. Vu, H.-P. Chao, T. Van Trinh, T. T. Le, C.-C. Lin and H. N. Tran, J. Cleaner Prod., 2018, 180, 560–570 CrossRef CAS
.
- M. Zbair, Z. Anfar and H. A. Ahsaine, RSC Adv., 2019, 9, 1084–1094 RSC
.
- H. Ait Ahsaine, M. Zbair, Z. Anfar, Y. Naciri, R. El haouti, N. El Alem and M. Ezahri, Materials Today Chemistry, 2018, 8, 121–132, DOI:10.1016/j.mtchem.2018.03.004
.
- I. Anastopoulos and G. Z. Kyzas, J. Mol. Liq., 2015, 209, 77–86 CrossRef CAS
.
- P. Boakye, H. N. Tran, D. S. Lee and S. H. Woo, J. Environ. Manage., 2019, 233, 165–174 CrossRef CAS PubMed
.
- M. Bilal, T. Rasheed, J. E. Sosa-Hernández, A. Raza, F. Nabeel and H. M. N. Iqbal, Mar. Drugs, 2018, 16, 65 CrossRef PubMed
.
- S. Wang, M. F. Hamza, T. Vincent, C. Faur and E. Guibal, J. Colloid Interface Sci., 2017, 504, 780–789 CrossRef CAS PubMed
.
- S. K. Papageorgiou, E. P. Kouvelos and F. K. Katsaros, Desalination, 2008, 224, 293–306 CrossRef CAS
.
- H. N. Tran, H.-P. Chao and S.-J. You, Adsorpt. Sci. Technol., 2017, 36, 95–113 CrossRef
.
- J. Wang, C. P. Huang, H. E. Allen, D. K. Cha and D. W. Kim, J. Colloid Interface Sci., 1998, 208, 518–528 CrossRef CAS PubMed
.
- V. K. Garg, R. Gupta, A. B. Yadav and R. Kumar, Bioresour. Technol., 2003, 89, 121–124 CrossRef CAS PubMed
.
- S. Lagergren, K. Sven. Vetenskapsakad. Handl., 1898, 24, 1 Search PubMed
.
- G. McKay, Process Biochem., 1999, 34, 451 CrossRef
.
- É. C. Lima, M. A. Adebayo and F. M. Machado, in Carbon Nanomaterials as Adsorbents for Environmental and Biological Applications, ed. C. P. Bergmann and F. M. Machado, Springer International Publishing, Cham, 2015, pp. 33–69 Search PubMed
.
- J. C. Weber and W.
J. Morris, J. Sanit. Eng. Div., Am. Soc. Civ. Eng., 1963, 89, 31–60 Search PubMed
.
- I. Langmuir, J. Am. Chem. Soc., 1916, 38, 2221–2295 CrossRef CAS
.
- C. Saucier, M. A. Adebayo, E. C. Lima, L. D. T. Prola, P. S. Thue, C. S. Umpierres, M. J. Puchana-Rosero and F. M. Machado, Clean: Soil, Air, Water, 2015, 43, 1389–1400 CAS
.
- H. Freundlich, Z. Phys. Chem., 1906, 57A, 385 Search PubMed
.
- E. C. Lima, A. Hosseini-Bandegharaei, J. C. Moreno-Piraján and I. Anastopoulos, J. Mol. Liq., 2019, 273, 425–434 CrossRef CAS
.
- I. Anastopoulos and G. Z. Kyzas, J. Mol. Liq., 2016, 218, 174–185 CrossRef CAS
.
- P. S. Ghosal and A. K. Gupta, J. Mol. Liq., 2017, 225, 137–146 CrossRef CAS
.
- A. D. Becke, J. Chem. Phys., 1993, 98, 5648–5652 CrossRef CAS
.
- H. Ullah, A.-H. A. Shah, K. Ayub and S. Bilal, J. Phys. Chem. C, 2013, 117, 4069–4078 CrossRef CAS
.
- U. Eduok, O. Faye and J. Szpunar, RSC Adv., 2016, 6, 108777–108790 RSC
.
- T. N. V. de Souza, S. M. L. de Carvalho, M. G. A. Vieira, M. G. C. da Silva and D. do S. B. Brasil, Appl. Surf. Sci., 2018, 448, 662–670 CrossRef
.
- Y.-C. Chiang, W.-H. Lin and Y.-C. Chang, Appl. Surf. Sci., 2011, 257, 2401–2410 CrossRef CAS
.
- R. Chulliyote, H. Hareendrakrishnakumar, M. Raja, J. M. Gladis and A. M. Stephan, ChemistrySelect, 2017, 2, 10484–10495 CrossRef CAS
.
- Y.-C. Chiang, Y.-J. Chen and C.-Y. Wu, Materials, 2017, 10, 1296 CrossRef PubMed
.
- J. Baltrusaitis, P. M. Jayaweera and V. H. Grassian, Phys. Chem. Chem. Phys., 2009, 11, 8295–8305 RSC
.
- R. Shokri Khoubestani, N. Mirghaffari and O. Farhadian, Environ. Prog. Sustainable Energy, 2015, 34, 949–956 CrossRef CAS
.
- A. Bello, N. Manyala, F. Barzegar, A. A. Khaleed, D. Y. Momodu and J. K. Dangbegnon, RSC Adv., 2016, 6, 1800–1809 RSC
.
- M. Zbair, H. A. Ahsaine and Z. Anfar, J. Cleaner Prod., 2018, 202, 571–581 CrossRef CAS
.
- V. Bernal, L. Giraldo and J. C. Moreno-Piraján, Adsorpt. Sci. Technol., 2017, 36, 833–850 CrossRef
.
- X. Ling, H. Li, H. Zha, C. He and J. Huang, Chem. Eng. J., 2016, 286, 400–407 CrossRef CAS
.
- A. J. B. Leite, A. C. Sophia, P. S. Thue, G. S. dos Reis, S. L. Dias, E. C. Lima, C. P. J. Vaghetti, F. A. Pavan and W. S. de Alencar, Desalin. Water Treat., 2017, 71, 168–181 CrossRef CAS
.
- F. M. Kasperiski, E. C. Lima, C. S. Umpierres, G. S. dos Reis, P. S. Thue, D. R. Lima, S. L. P. Dias, C. Saucier and J. B. da Costa, J. Cleaner Prod., 2018, 197, 919–929 CrossRef CAS
.
- P. S. Thue, M. A. Adebayo, E. C. Lima, J. M. Sieliechi, F. M. Machado, G. L. Dotto, J. C. P. Vaghetti and S. L. P. Dias, J. Mol. Liq., 2016, 223, 1067–1080 CrossRef CAS
.
- C. Saucier, P. Karthickeyan, V. Ranjithkumar, E. C. Lima, G. S. dos Reis and I. A. S. de Brum, Environ. Sci. Pollut. Res., 2017, 24, 5918–5932 CrossRef CAS PubMed
.
- A. Sharma, Z. Syed, U. Brighu, A. B. Gupta and C. Ram, J. Cleaner Prod., 2019, 220, 23–32 CrossRef CAS
.
- A. G. N. Wamba, E. C. Lima, S. K. Ndi, P. S. Thue, J. G. Kayem, F. S. Rodembusch, G. S. dos Reis and W. S. de Alencar, Environ. Sci. Pollut. Res., 2017, 24, 21807–21820 CrossRef CAS PubMed
.
- L. D. T. Prola, F. M. Machado, C. P. Bergmann, F. E. de Souza, C. R. Gally, E. C. Lima, M. A. Adebayo, S. L. P. Dias and T. Calvete, J. Environ. Manage., 2013, 130, 166–175 CrossRef CAS PubMed
.
- G. M. S. El Shafei and N. A. Moussa, J. Colloid Interface Sci., 2001, 238, 160–166 CrossRef CAS PubMed
.
- B. Belhamdi, Z. Merzougui, M. Trari and A. Addoun, J. Appl. Res. Technol., 2016, 14, 354–366 CrossRef
.
- N. Y. Mlunguza, P. S. Mdluli, S. S. Zunngu, L. M. Madikizela, N. T. Tavengwa and L. Chimuka, Water SA, 2018, 44, 406 CrossRef
.
- R. Baccar, M. Sarrà, J. Bouzid, M. Feki and P. Blánquez, Chem. Eng. J., 2012, 211–212, 310–317 CrossRef CAS
.
- J. Y. Song and S. H. Jhung, Chem. Eng. J., 2017, 322, 366–374 CrossRef CAS
.
- F. Liu, J. Zhao, S. Wang, P. Du and B. Xing, Environ. Sci. Technol., 2014, 48, 13197–13206 CrossRef CAS PubMed
.
- S. Wong, Y. Lee, N. Ngadi, I. M. Inuwa and N. B. Mohamed, Chin. J. Chem. Eng., 2018, 26, 1003–1011 CrossRef
.
- M. T. Mupa M, J. Environ. Anal. Toxicol., 2015, s7, 1–9 Search PubMed
.
- K. Mphahlele, M. S. Onyango and S. D. Mhlanga, J. Environ. Chem. Eng., 2015, 3, 2619–2630 CrossRef CAS
.
- L. A. Al-Khateeb, S. Almotiry and M. A. Salam, Chem. Eng. J., 2014, 248, 191–199 CrossRef CAS
.
- H. N. Tran, S. J. You, A. Hosseini-Bandegharaei and H. P. Chao, Water Res., 2017, 120, 88–116 CrossRef CAS PubMed
.
- H. N. Tran, S.-J. You and H.-P. Chao, J. Environ. Chem. Eng., 2016, 4, 2671–2682 CrossRef CAS
.
- M. Zbair, M. Bottlinger, K. Ainassaari, S. Ojala, O. Stein, R. L. Keiski, M. Bensitel and R. Brahmi, Waste Biomass Valorization, 2018, 1–20 Search PubMed
.
- M. Zbair, Z. Anfar and H. A. Ahsaine, RSC Adv., 2019, 9, 5756–5769 RSC
.
- H. N. Tran, S.-J. You and H.-P. Chao, J. Environ. Manage., 2017, 188, 322–336 CrossRef CAS PubMed
.
- R. W. Coughlin and F. S. Ezra, Environ. Sci. Technol., 1968, 2, 291–297 CrossRef CAS
.
- H. N. Tran, S.-J. You and H.-P. Chao, Korean J. Chem. Eng., 2017, 34, 1708–1720 CrossRef CAS
.
- K. Fukui, Angew. Chem., Int. Ed. Engl., 1982, 21, 801–809 CrossRef
.
- L. R. Domingo, M. J. Aurell, P. Pérez and R. Contreras, Tetrahedron, 2002, 58, 4417–4423 CrossRef CAS
.
- R. G. Parr, L. v. Szentpály and S. Liu, J. Am. Chem. Soc., 1999, 121, 1922–1924 CrossRef CAS
.
- Z. Anfar, M. Zbair, H. A. Ahsaine, M. Ezahri and N. E. Alem, Fullerenes, Nanotubes, Carbon Nanostruct., 2018, 26, 389–397 CrossRef CAS
.
- M. Zbair, Z. Anfar, H. Ait Ahsaine, N. El Alem and M. Ezahri, J. Environ. Manage., 2018, 206, 383–397, DOI:10.1016/j.jenvman.2017.10.058
.
- M. Zbair, Z. Anfar, H. Khallok, H. A. Ahsaine, M. Ezahri and N. Elalem, Fullerenes, Nanotubes, Carbon Nanostruct., 2018, 26, 433–442 CrossRef CAS
.
- A. Dargahi, A. Ansari, D. Nematollahi, G. Asgari, R. Shokoohia and M. R. Samarghandi, RSC Adv., 2019, 9, 5064–5075 RSC
.
- E. Sharifpour, E. Alipanahpour Dil, A. Asfaram, M. Ghaedi and A. Goudarzi, Appl. Organomet. Chem., 2019, e4768 CrossRef
.
- H. Ait Ahsaine, Z. Anfar, M. Zbair, M. Ezahri and N. El Alem, Journal of Chemistry, 2018, 2018, 14, DOI:10.1155/2018/6982014
.
- M. Ş. Tanyildizi, Chem. Eng. J., 2011, 168, 1234–1240 CrossRef CAS
.
- G. S. dos Reis, T. C. de A. Silva, E. C. Lima, M. Wilhelm, S. M. A. G. U. de Souza, K. Rezwan and C. H. Sampaio, Appl. Therm. Eng., 2015, 93, 590–597 CrossRef
.
- M. E. R. Carmona, M. A. P. Da Silva and S. G. Ferreira Leite, Process Biochem., 2005, 40, 779–788 CrossRef CAS
.
Footnotes |
| † Electronic supplementary information (ESI) available. See DOI: 10.1039/c9ra01086f |
| ‡ Present address: KAUST Catalysis Center (KCC) and Physical Sciences and Engineering Division (PSE), King Abdullah University of Science and Technology (KAUST), 4700 KAUST, Thuwal 23955-6900, Saudi Arabia. |
| This journal is © The Royal Society of Chemistry 2019 |


