 Open Access Article
A new COF linked by an ether linkage (–O–): synthesis, characterization and application in supercapacitance†
Hao Guo*a,
Mingyue Wanga,
Rui Xueb,
Jing Yaoa,
Xuejiao Wanga,
Longwen Zhanga,
Jianfeng Liua and
Wu Yang *a
*a
aKey Lab of Eco-Environments Related Polymer Materials of MOE, Key Lab of Bioelectrochemistry and Environmental Analysis of Gansu Province, College of Chemistry and Chemical Engineering, Northwest Normal University, Lanzhou 730070, P. R. China
bProvincical Key Laboratory of Gansu Higher Education for City Environmental Pollution Control, College of Chemistry and Chemical Engineering, Lanzhou City University, Lanzhou 730070, P. R. China
First published on 1st May 2019
Abstract
A new COF (NWNU-COF-4) linked by an aryl ether bond (Ar–O–Ar) was synthesized by the condensation reaction of 2,4,6-trihydroxypyrimidine and trinitrophenol under simple and easy reaction conditions. Fourier transform infrared spectroscopy (FT-IR), X-ray photoelectron spectroscopy (XPS), N2 adsorption–desorption, thermogravimetric analysis (TGA), powder X-ray diffraction (XRD) and scanning electron microscopy (SEM) were utilized to characterize the product. The BET specific surface area of NWNU-COF-4 was 21.33 m2 g−1, and its pore size was about 1.351 nm. Additionally, this method of preparation was simple and cheap. The electrochemical measurements showed that the synthesized NWNU-COF-4 had excellent pseudocapacitive performance with maximum specific capacitance of 133.44 F g−1 at 0.3 A g−1 in 6 mol L−1 KOH electrolyte. When the current density increased by 10 times (3.0 A g−1), the specific capacitance was 114.12 F g−1, and the retention rate was 82%. After 10![[thin space (1/6-em)]](https://www.rsc.org/images/entities/char_2009.gif) 000 GCD cycles, the capacitance still kept 94% of its initial capacitance.
000 GCD cycles, the capacitance still kept 94% of its initial capacitance.
1. Introduction
Since the first covalent organic frameworks (COFs), COF-1 and COF-5, were reported by Prof. Yaghi and co-workers in 2005, COFs have become more and more popular.1,2 In recent years, COFs have being extensively studied in potential applications, such as gas storage and separation,3–5 photoelectric function,6,7 fluorescence sensors,8–10 catalysis,11,12 drug delivery,13,14 dye and pollutant adsorption,15,16 electronic devices,17,18 and so on. COFs are composed of light weight elements (H, B, C, Si, N, O) and linked by strong covalent bonds,19 and the skeleton was constructed from a variety of rigid organic building units with different structural configurations. There are many building units utilized successfully to construct COF materials, for instance, 2,7-diboronic acid,20 2,6-naphthalenedicarbonitrile,21 2,3,6,7,10,11-hexahydroxytriphenylene,6 1,3,5-triformylphloroglucinol,22 5,10,15,20-tetrakis(4-aminophenyl)porphyrin,23 2,3,9,10,16,17,23,24-octahydroxy phthalocyaninato,24 tetra-(4-anilyl)-methane,25 1,3,5,7-tetraaminoadamantane,13 and so on.10 These monomers are linked together by different chemical reactions and give COFs a variety of properties.26 The current synthesis strategies of COF are as follows.10 (1) The formation of boronate anhydride from the dehydration of boronic acid. (2) The dehydration reaction of boronic acid and silanol. (3) The dehydration reaction between boronic acid and (acetonide-protected) catechol. (4) The dehydration of aldehyde and amine. (5) The dehydration of aldehyde and hydrazide. (6) The cyclotrimerisation of nitrile.With the increasing demand of new green sustainable energy to face the deepening energy crisis and environmental pollution, supercapacitors attracted much attention as a new energy storage device due to their performance of high power density, high capacitance, long cycling life, low maintenance cost and environmental friendliness. Generally, the electrode materials of supercapacitor can be summarized in three types: carbon material, conducting polymers and metal oxides.27 Recently, metal–organic frameworks (MOFs) was used as electrode material of supercapacitor owing to the redox behavior of metal cations inside MOFs.28 Nowadays, as a new type of porous organic framework material, the redox behavior of organic monomers inside COFs,29 such as anthraquinone, enables them as pseudocapacitive material for supercapacitors.
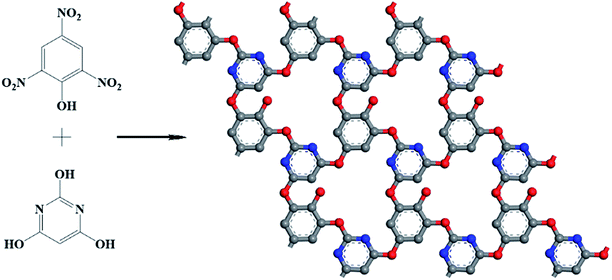
Herein we report a new COF linked by ether bond prepared under ordinary conditions and explore its application in supercapacitors as electrode material. A new 2D COFs (termed NWNU-COF-4) was designed and synthesized by the reaction of nitro-group (–NO2) and hydroxyl (–OH) for the first time. NWNU-COF-4 was constructed by the condensation of trinitrophenol and 2,4,6-trihydroxypyrimidine acid (Scheme 1) in the solvent of N-methyl pyrrolidone (NMP). The NWNU-COF-4 was coated on Ni foam as an electrode material, which exhibited good supercapacitor performance.
2. Experiment
2.1 Reagents
Trinitrophenol was purchased from Sinopharm Chemical Reagent Co., Ltd. and 2,4,6-trihydroxypyrimidine acid was purchased from Aladdin Chemistry Co., Ltd. N-methyl pyrrolidone (NMP), methyl alcohol and potassium hydroxide were purchased from Chengdu Forest Science & Technology Development Co., Ltd. All chemicals used were of analytical grade or better. The Doubly deionized water was prepared by ultra-pure water machine in our laboratory.2.2 Characterizations
Fourier transform infrared (FT-IR) spectra were obtained from a Digilab FTS-3000 spectrometer (Finland). The powder X-ray diffraction (XRD) patterns of products were obtained using a EMPYREAN X-ray diffractometer (Holland). The morphology analysis was examined by scanning electron microscopy (SEM, Zeiss, ULTRRA Plus, Germany). Thermal stability was inspected using a thermogravimetric analysis (TGA, PerkinElmer, SSC-5200, USA). The specific surface area and pore structure information were measured by using a nitrogen adsorption–desorption analysis (Quantachrome, Autosorb 1, USA). Elemental chemical states on the surface of materials were measured by X-ray photoelectron spectroscopy (XPS, ThermoFisher Scientific, ESCALAB 250Xi, USA).2.3 Synthesis of NWNU-COF-4
The synthesis procedure of NWNU-COF-4 is illustrated in Scheme 1. 2,4,6-Trihydroxypyrimidine (0.3843 g, 3 mmol) and potassium hydroxide (0.5049 g, 9 mmol) were weighed into a round flask with 40 mL N-methyl pyrrolidone (NMP), and magnetically stirred for 1 hour. And then, trinitrophenol was added (0.6870 g, 3 mmol), the reaction temperature was raised to 85 °C with magnetic stirring for 3 days under nitrogen atmosphere. The product was isolated by vacuum filtration and washed with methyl alcohol, dried at 50 °C under vacuum for 24 hours to yield NWNU-COF-4 as a brick red powder. The yield is about 36%.2.4 Electrochemical measurements
The capacitor performances of NWNU-COF-4 were carried out in three electrode system with 6 mol L−1 KOH solution as electrolyte, in which platinum plate electrode were used as counter electrode and the saturated calomel electrode (SCE) were used as reference electrode, respectively. The working electrode was consisted of prepared materials (80 wt%), acetylene black conductor (15 wt%), and PTFE (poly(polytetrafluoroethylene)) binder (5 wt%). Ethyl alcohol was added to the mixture of these three materials to make slurry, and then it was ultrasonically dispersed for 45 minutes and the resulting mixture was coated on Ni foam (1 × 1 cm2), then dried in a vacuum drying oven at 60 °C for 24 h. Finally, the Ni foams with electrode materials were pressed under 10 MPa to obtain the working electrodes. Cyclic voltammetry (CV), chronopotentiometry (CP) and electrochemical impedance spectroscopy (EIS) were performed on a CHI 660E Electrochemical Workstation (Chenhua, Shanghai, China). The galvanostatic charge–discharge (GCD) test was carried out on a CT2001A-LAND Cell Test System (Landian, Wuhan, China). The specific capacitances were calculated according to the following equation:| C = IΔt/ΔV | (1) |
The energy density (E) and power density (P) of the asymmetric two-electrode cell are calculated by eqn (2) and (3)
 | (2) |
 | (3) |
3. Result and discussion
3.1 Synthesis and characterization of NWNU-COF-4
Fig. S1† shows the FT-IR spectra of NWNU-COF-4. The sorption bands at 1685 cm−1 is attributed to the stretching of C![[double bond, length as m-dash]](https://www.rsc.org/images/entities/char_e001.gif) N bonds. The peaks at 1413 cm−1, 1489 cm−1 and 1622 cm−1 belong to the aromatic rings. The peak at 1085 cm−1 is assigned to the ether bond, which proves that the NWNU-COF-4 linked by ether bond (–O–) was synthesized successfully. In addition, the characteristic peaks of –NO2 and –OH can be observed at 1369 cm−1 and 1301 cm−1 respectively, due to the rest of the reactants and dangling bonds.
N bonds. The peaks at 1413 cm−1, 1489 cm−1 and 1622 cm−1 belong to the aromatic rings. The peak at 1085 cm−1 is assigned to the ether bond, which proves that the NWNU-COF-4 linked by ether bond (–O–) was synthesized successfully. In addition, the characteristic peaks of –NO2 and –OH can be observed at 1369 cm−1 and 1301 cm−1 respectively, due to the rest of the reactants and dangling bonds.
Fig. 1 shows the typical XPS survey spectrum and high-resolution elemental scan of N1s, which were recorded from the NWNU-COF-4. As shown in Fig. 1(a), XPS survey spectrum, C, N, O were detected at the binding energy of 286.8 eV, 403.2 eV, and 534.4 eV respectively. O1s high resolution XPS spectra included three chemical species with binding energy at about 533.07, 532.0 and 531.14 eV (Fig. 1(b)), which attributable to C–O–C, C–O–H, and N–O respectively. These results demonstrated that NWNU-COF-4 was synthesized successfully.
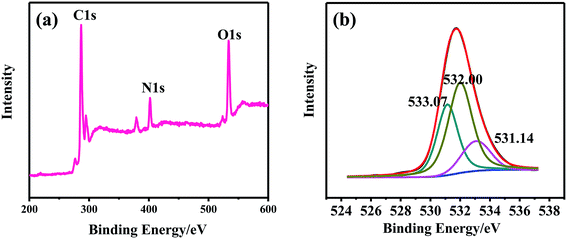 | ||
| Fig. 1 The XPS spectra of NWNU-COF-4. (a) The typical XPS survey spectrum of NWNU-COF-4; (b) the high resolution XPS spectra of O1s for NWNU-COF-4. | ||
The crystalline structure of NWNU-COF-4 was determined by powder X-ray diffraction (PXRD), and possible extended structures based on hexagonal unit cells were modeled as shown in Fig. 2(a and b). A hexagonal unit cell with the parameters a = b = 8.985616 Å, c = 4.645 Å and α = β = 90°, γ = 120° was deduced by Accelrys' Materials Studio 7.0 software. The corresponding curve (Fig. 2d) is closer to the experimental data (Fig. 2c). Peaks at 2θ = 25.71° and 28.87° correspond to the (1, 1, 1) plane of KOH and (2, 0, 0) plane of KCl respectively by comparing with the PDF cards, due to the small amount of potassium chloride and potassium hydroxide in the product were not completely removed. On the other hand, the peak at about 27.61° correspond to the π–π stacking between COF layers, and could be assigned to (0, 0, 1) planes.30
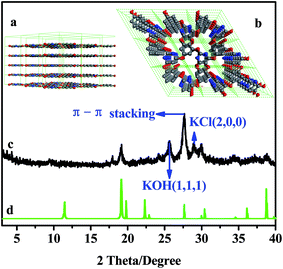 | ||
| Fig. 2 (a) The lateral view and (b) top view of NWNU-COF-4; (c) experimental and (d) simulated patterns of NWNU-COF-4. C: gray, N: blue, O: red, and H atoms are omitted for clarity. | ||
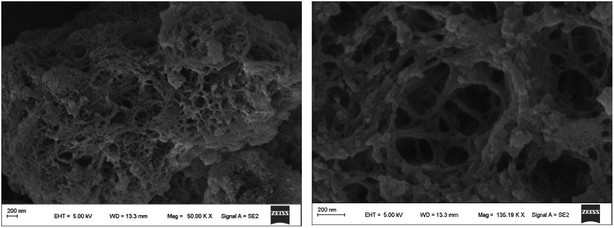
SEM images of NWNU-COF-4 are displayed in Fig. 3, from which we can observe that NWNU-COF-4 is three dimensional network structure with rough surface, and its internal structure is very loose. There are some amorphous particles on the surface of the material.
The permanent porosity of NWNU-COF-4 was demonstrated by N2 adsorption–desorption analysis at 77.350 K (Fig. 4). The isotherm shows a sharp increase in the gas uptake below P/P0 = 1.0. The Brunauer–Emmett–Teller (BET) surface area was calculated to be 21.33 m2 g−1, the total pore volume was calculated to be 0.198 cm3 g−1. The pore size distribution was calculated by Barrett–Joyner–Halenda (BJH) models, resulting a value of 13.51 Å. Thermogravimetric analysis (TGA) was used to evaluate the thermostability of NWNU-COF-4. The curve of TGA is showed in Fig. S2.† The stage below 100 °C with weight loss ∼2% is due to desorption of small amounts of water. The stage from 150 °C to 300 °C, the weight loss ∼7% can be attributed to desorption of solvent NMP and the decomposition of the reactants. An obvious weight loss process from 300 °C to 500 °C indicates that the framework structure of NWNU-COF-4 is collapsed, and the product is decomposed and gasified gradually. As the temperature continues to rise up to 800 °C, the molecular structure is further destroyed and decomposed.
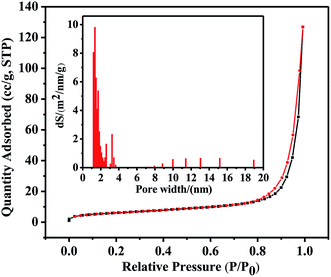 | ||
| Fig. 4 N2 adsorption and desorption isotherm of NWNU-COF-4. Inset: pore size distribution for NWNU-COF-4 measured at 77.3 K. | ||
3.2 Electrochemical properties of NWNU-COF-4
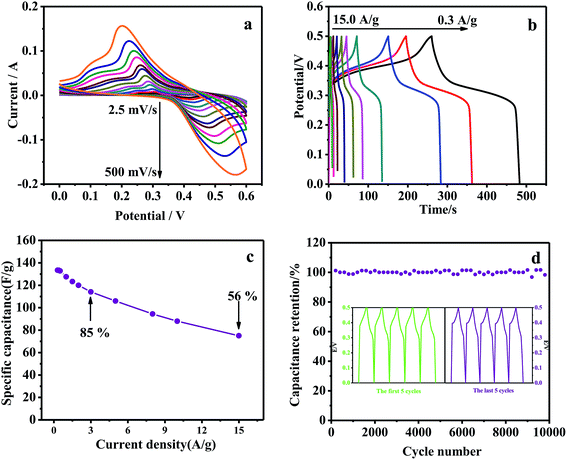
Fig. 5(a) shows the cyclic voltammogram (CV) curves of NWNU-COF-4 at different scan rates in 6 M KOH electrolyte within the potential window of 0 V to 0.6 V versus SCE. A couple of obvious redox peaks of the CV curves shows the distinct pseudocapacitance characteristic. When the scan rate was 50 mV s−1, a couple of obvious redox peaks was observed at 0.47 V and 0.26 V, respectively, resulted from oxidation and reduction of phenolic hydroxy group22,31 and possible reaction mechanism is shown in Scheme 2.The redox peak currents of NWNU-COF-4 are linearly proportional to the square root of scan rate (ν) from 5 mV s−1 to 500 mV s−1 with regression equations (Fig. S3†): IOx (A) = 0.01338 − 0.28694ν1/2 (R2 = 0.99801), IRe (A) = −0.00833 + 0.23714ν1/2 (R2 = 0.99880) respectively, indicating that the electrochemical process of NWNU-COF-4 is diffusion-controlled. Galvanostatic charge–discharge measurements were carried out at different current densities (0.3, 0.4, 0.5, 1.0, 1.5, 2.0, 3.0, 5.0, 8.0, 10.0, 15.0 A g−1) to evaluate the specific capacitance of NWNU-COF-4. Fig. 5(b) shows the GCD curves for different charging current densities. The plateaus at ∼0.25 V to approximately ∼0.45 V further verifies the pseudocapacitance behavior of NWNU-COF-4. The highest specific capacitance of NWNU-COF-4 is 133.44 F g−1 at the current density of 0.3 A g−1. When the current density increases by 10 times, 3.0 A g−1, the specific capacitance is 114.12 F g−1 with the retention rate of 82%. Even though the current density increased by 50 times (15 A g−1), the specific capacitance is 75 F g−1, and the retention rate is 56% (Fig. 5c), indicating a good rate performance of NWNU-COF-4.
The results of the cycling stability experiments illustrate an excellent stability of NWNU-COF-4 (Fig. 5d). The cycling stability performance was evaluated by GCD test at current density of 1 A g−1 within potential window of 0–0.5 V. As shown in Fig. 5d, after 10![[thin space (1/6-em)]](https://www.rsc.org/images/entities/char_2009.gif) 000 GCD cycles the capacitance still keep 94% of its initial capacitance, indicating its excellent cycling stability as a durable pseudocapacitive electrode material. Table 1 lists a comparison of the capacitance performances of synthesized NWNU-COF-4 with the reference results reported previously based on COF electrode materials. It can be found that except TpPA-(OH)2 (ref. 30) and TDFP-1,33 the prepared COF material possessed the highest specific capacitance. It is notable that the synthesized NWNU-COF-4 had the best cycle performance and high-rate performance at higher current density.
000 GCD cycles the capacitance still keep 94% of its initial capacitance, indicating its excellent cycling stability as a durable pseudocapacitive electrode material. Table 1 lists a comparison of the capacitance performances of synthesized NWNU-COF-4 with the reference results reported previously based on COF electrode materials. It can be found that except TpPA-(OH)2 (ref. 30) and TDFP-1,33 the prepared COF material possessed the highest specific capacitance. It is notable that the synthesized NWNU-COF-4 had the best cycle performance and high-rate performance at higher current density.
| Electrode materials | Electrolytes | Specific capacitance (F g−1) | Current density (A g−1) | Retention (%) (cycle@current density (A g−1)) | Potential window (V) | Specific capacitance retention (%) current density (A g−1) | Ref. |
|---|---|---|---|---|---|---|---|
| a Potential scan rate in unit of mV s−1.b Current density in unit of mA cm−2.c Specific capacitance in unit of mF cm−2. | |||||||
| DAAQ-TFP COF | 1 M H2SO4 | 48 | 0.1 | 84.5(5000@0.1) | −0.3 to 0.3 | 28.6(0.1 to 2.0) | 22 |
| TpBD-(OH)2 | 1M PBS | 90 | 0.5 | — | 0–0.7 | 49(0.5 to 5) | 30 |
| TpPA-(OH)2 | 1M PBS | 416 | 0.5 | 66(1000@5) | −0.2 to 0.5 | 58(2 to 20a) | 30 |
| COFDAAQ-BTA-3DG | 1M KOH | 32.6c | 0.025b | 30(500@0.5b) | −1.05 to −0.4 | 16.3(0.025 to 2.53b) | 31 |
| DAB-TFP-COF | 1 M H2SO4 | 79.1 | 20a | 92(6000@2) | −0.3 to 0.35 | — | 32 |
| TDFP-1 | 0.1 M H2SO4 | 418 | 0.5 | 95(1000@10) | −0.45 to 0.5 | — | 33 |
| NH2-f-MWCNT@COFTTA-DHTA | 1 M Na2SO4 | 127.5 | 0.4 | 96(1000@0.4) | 0–0.7 | 77(0.4 to 2) | 34 |
| NWNU-COF-4 | 6 M KOH | 133.44 | 0.3 | 94(10![[thin space (1/6-em)]](https://www.rsc.org/images/entities/char_2009.gif) 000@5) 000@5) |
0–0.5 | 82(0.3 to 3) | This work |
| 56(0.3 to 15) | |||||||
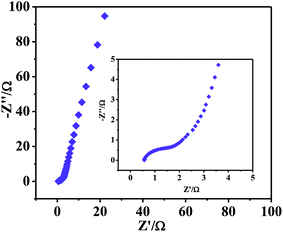
EIS was also employed at the potential of 0.3291 V in 6 M KOH over the frequency range of 0.01 Hz to 10![[thin space (1/6-em)]](https://www.rsc.org/images/entities/char_2009.gif) 000 kHz. Fig. 6 shows Nyquist plots of NWNU-COF-4. The Nyquist plot displays an unconspicuous semicircle at the high frequency range and a straight line at the low frequency region. The small semicircle at the high frequency range corresponds to low charge transfer resistance, and the straight line corresponds to diffusive resistance of the electrolyte. The phase angle of the straight line in low frequency region is larger than 45°, indicating a good ion mobility of electrode. The intercept at Z′ axis represents the equivalent series resistance, was consist of intrinsic resistance of electrode material, ionic resistance of electrolyte and contact resistance at the interface of electrode material/Ni foam.28 The value of equivalent series resistance is 0.56 Ω.
000 kHz. Fig. 6 shows Nyquist plots of NWNU-COF-4. The Nyquist plot displays an unconspicuous semicircle at the high frequency range and a straight line at the low frequency region. The small semicircle at the high frequency range corresponds to low charge transfer resistance, and the straight line corresponds to diffusive resistance of the electrolyte. The phase angle of the straight line in low frequency region is larger than 45°, indicating a good ion mobility of electrode. The intercept at Z′ axis represents the equivalent series resistance, was consist of intrinsic resistance of electrode material, ionic resistance of electrolyte and contact resistance at the interface of electrode material/Ni foam.28 The value of equivalent series resistance is 0.56 Ω.
To further estimate the practical applications of NWNU-COF-4, we fabricated the asymmetric two-electrode cell and measured its capacitance properties in 3 M KOH electrolyte. The asymmetric two electrode cell was constructed by using the NWNU-COF-4 electrode as positive electrode and commercially activated carbon (AC) as negative electrode, respectively. Fig. S4† shows the CV curves of NWNU-COF-4 and AC electrodes at 30 mV s−1, respectively. The potential window of AC is −1 to 0 V, and the potential window of NWNU-COF-4 is 0–0.6 V, thus the maximum operation potential windows of two-electrode cell can be extended to be 1.6 V.
The CV curves of two-electrode cell at scan rates of 5–200 mV s−1 are showed in Fig. 7a. The shape of the CV curves illustrates the behaviors of electric double-layer capacitance and caradaic capacitance at all scan rates. Typical GCD curves of the two-electrode cell at different current densities from 0.5 to 10 A g−1 are showed in Fig. 7b. The constructed ASC exhibits the highest specific capacity of 42.84 F g−1 at the current density of 0.5 A g−1, and retains 46.87% of its initial capacity at 10 A g−1 (Fig. S5†). In addition, the two-electrode cell delivers an energy density of 14.85 W h kg−1 at a power density of 394.83 W kg−1, which is superior to the other reported COF based electrode materials.35
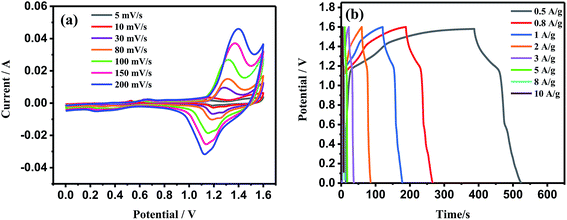 | ||
| Fig. 7 (a) CV curves of the two-electrode cell at the different scan rates. (b) GCD curves of the two-electrode cell at different current densities. | ||
4. Conclusion
A new COF linked by aryl ether linkage was synthesized by condensation of 2,4,6-trihydroxypyrimidine and trinitrophenol under the simple and easy reaction conditions. The BET specific surface area of NWNU-COF-4 was about 21.33 m2 g−1, and the pore size was about 1.351 nm (BJH). NWNU-COF-4 linked by –O– was synthesized by the reaction of nitro-group (–NO2) and hydroxyl (–OH) for the first time. This study provided a new way to design and synthesize COF material with simple method and ordinary conditions. The electrochemical measurements showed that the synthesized NWNU-COF-4 had excellent pseudocapacitive performance, highest specific capacitance of 133.44 F g−1 at 1 A g−1 in 6 mol L−1 KOH electrolyte, when the current density increased by 10 times, 3.0 A g−1, the specific capacitance was 114.12 F g−1, the retention rate was 82%. The capacitance still can keep 94% of its initial capacitance after 10![[thin space (1/6-em)]](https://www.rsc.org/images/entities/char_2009.gif) 000 GCD cycles. In addition, the asymmetric two electrode cell assembled by using NWNU-COF-4 and activated carbon (AC) delivered an energy density of 14.85 W h kg−1 at a power density of 394.83 W kg−1. These results demonstrated the promising applications of NWNU-COF-4 as supercapacitor electrode materials.
000 GCD cycles. In addition, the asymmetric two electrode cell assembled by using NWNU-COF-4 and activated carbon (AC) delivered an energy density of 14.85 W h kg−1 at a power density of 394.83 W kg−1. These results demonstrated the promising applications of NWNU-COF-4 as supercapacitor electrode materials.
Conflicts of interest
There are no conflicts to declare.Acknowledgements
Authors are very grateful to National Natural Science Foundation of China (21165024), Northwest Normal University Young Teachers Research Capacity Promotion Plan (NWNU-LKQN-18-23), the Key Lab of Eco-Environments Related Polymer Materials of MOE, Key Lab of Polymer Materials of Gansu Province for their financially supports.References
- C. Liu, Y. Yu, W. Zhang, Q. Zeng and S. Lei, Chemistry, 2016, 22, 18412–18418 CrossRef CAS PubMed.
- A. P. Côét, A. I. Benin, N. W. Ockwig, M. O'Keeffe, A. J. Matzger and O. M. Yaghi, Science, 2005, 310, 1166–1170 CrossRef PubMed.
- J. Graetz, Chem. Soc. Rev., 2009, 38, 73–82 RSC.
- J. Lan, D. Cao, W. Wang, T. Ben and G. Zhu, J. Phys. Chem. Lett., 2010, 1, 978–981 CrossRef CAS.
- Y. Wang, J. Li, Q. Yang and C. Zhong, ACS Appl. Mater. Interfaces, 2016, 8, 8694–8701 CrossRef CAS PubMed.
- S. Wan, J. Guo, J. Kim, H. Ihee and D. Jiang, Angew. Chem., Int. Ed., 2008, 47, 8826–8830 CrossRef CAS PubMed.
- E. L. Spitler and W. R. Dichtel, Nat. Chem., 2010, 2, 672–677 CrossRef CAS PubMed.
- W. L. Zhang, G. Qiu, Y. P. Yuan, A. J. Xie, Y. H. Shen and J. F. Zhu, J. Hazard. Mater., 2012, 221–222, 147–154 CrossRef CAS PubMed.
- G. Lin, H. Ding, D. Yuan, B. Wang and C. Wang, J. Am. Chem. Soc., 2016, 138, 3302–3305 CrossRef CAS PubMed.
- R. Xue, H. Guo, T. Wang, L. Gong, Y. Wang, J. Ai, D. Huang, H. Chen and W. Yang, Anal. Methods, 2017, 9, 3737–3750 RSC.
- S. Y. Ding, J. Q. Gao, Q. Wang, Y. Zhang, W. G. Song, C. Y. Su and W. Wang, J. Am. Chem. Soc., 2011, 133, 19816–19822 CrossRef CAS PubMed.
- Q. Fang, S. Gu, J. Zheng, Z. Zhuang, S. Qiu and Y. Yan, Angew. Chem., Int. Ed., 2014, 539, 2878–2882 CrossRef PubMed.
- Q. Fang, J. Wang, S. Gu, R. B. Kaspar, Z. Zhuang, J. Zheng, H. Guo, S. Qiu and Y. Yan, J. Am. Chem. Soc., 2015, 137, 8352–8355 CrossRef CAS PubMed.
- L. Bai, S. Z. F. Phua, W. Q. Lim, A. Jana, Z. Luo, H. P. Tham, L. Zhao, Q. Gao and Y. Zhao, Chem. Commun., 2016, 52, 4128–4131 RSC.
- C. Zhang, G. Li and Z. Zhang, J. Chromatogr. A, 2015, 1419, 1–9 CrossRef CAS PubMed.
- J. Liu, J. Cao, H. Chen and D. Zhou, Colloids Surf., A, 2015, 481, 276–282 CrossRef CAS.
- S. Wan, F. Gandara, A. Asano, H. Furukawa, A. Saeki, S. K. Dey, L. Liao, M. W. Ambrogio, Y. Y. Botros, X. Duan, S. Seki, J. F. Stoddart and O. M. Yaghi, Chem. Mater., 2011, 23, 4094–4097 CrossRef CAS.
- L. Chen, K. Furukawa, J. Gao, A. Nagai, T. Nakamura, Y. Dong and D. Jiang, J. Am. Chem. Soc., 2014, 136, 9806–9809 CrossRef CAS PubMed.
- B. P. Biswal, H. D. Chaudhari, R. Banerjee and U. K. Kharul, Chem.–Eur. J., 2016, 22, 4695–4699 CrossRef CAS PubMed.
- J. W. Colson and W. R. Dichtel, Nat. Chem., 2013, 5, 453–465 CrossRef CAS PubMed.
- M. J. Bojdys, J. Jeromenok, A. Thomas and M. Antonietti, Adv. Mater., 2010, 22, 2202–2205 CrossRef CAS PubMed.
- C. R. DeBlase, K. E. Silberstein, T. T. Truong, H. D. Abruna and W. R. Dichtel, J. Am. Chem. Soc., 2013, 135, 16821–16824 CrossRef CAS PubMed.
- A. Nagai, X. Chen, X. Feng, X. Ding, Z. Guo and D. Jiang, Angew. Chem., Int. Ed., 2013, 52, 3770–3774 CrossRef CAS PubMed.
- S. Jin, M. Supur, M. Addicoat, K. Furukawa, L. Chen, T. Nakamura, S. Fukuzumi, S. Irle and D. Jiang, J. Am. Chem. Soc., 2015, 137, 7817–7827 CrossRef CAS PubMed.
- W. Gao, X. Sun, H. Niu, X. Song, K. Li, H. Gao, W. Zhang, J. Yu and M. Jia, Microporous Mesoporous Mater., 2015, 213, 59–67 CrossRef CAS.
- S. Y. Ding and W. Wang, Chem. Soc. Rev., 2013, 42, 548–568 RSC.
- G. Wang, L. Zhang and J. Zhang, Chem. Soc. Rev., 2012, 41, 797–828 RSC.
- H. Gholipour-Ranjbar, M. Soleimani and H. R. Nader, New J. Chem., 2016, 40, 9187–9193 RSC.
- S. B. Alahakoon, C. M. Thompson, G. Occhialini and R. A. Smaldone, ChemSusChem, 2017, 10, 2116–2129 CrossRef CAS PubMed.
- S. Chandra, D. R. Chowdhury, M. Addicoat, T. Heine, A. Paul and R. Banerjee, Chem. Mater., 2017, 29, 2074–2080 CrossRef CAS.
- Z. Zha, L. Xu, Z. Wang, X. Li, Q. Pan, P. Hu and S. Lei, ACS Appl. Mater. Interfaces, 2015, 7, 17837–17843 CrossRef CAS PubMed.
- A. M. Khattak, Z. A. Ghazi, B. Liang, N. A. Khan, A. Iqbal, L. Li and Z. Tang, J. Mater. Chem. A, 2016, 4, 16312–16317 RSC.
- P. Bhanja, K. Bhunia, S. K. Das, D. Pradhan, R. Kimura, Y. Hijikata, S. Irle and A. Bhaumik, ChemSusChem, 2017, 10, 921–929 CrossRef CAS PubMed.
- B. Sun, J. Liu, A. Cao, W. Song and D. Wang, Chem. Commun., 2017, 53, 6303–6306 RSC.
- A. Roy, S. Mondal, A. Halder, A. Banerjee, D. Ghoshal, A. Paul and S. Malik, Eur. Polym. J., 2017, 93, 448–457 CrossRef CAS.
Footnote |
| † Electronic supplementary information (ESI) available. See DOI: 10.1039/c9ra01357a |
| This journal is © The Royal Society of Chemistry 2019 |

