 Open Access Article
CF3: an overlooked chromophore in VCD spectra. A review of recent applications in structural determination†‡
Sergio Abbate *a,
Giovanna Longhia,
Giuseppe Mazzeoa,
Claudio Villani
 b,
Silvija Petković§
c and
Renzo Ruzziconi
 c
c
aDMMT (Dipartimento di Medicina Molecolare e Traslazionale), Università di Brescia, Viale Europa 11, 25123 Brescia, Italy. E-mail: sergio.abbate@unibs.it
bDipartimento di Chimica e Tecnologie del Farmaco, Università di Roma “La Sapienza”, Piazzale Aldo Moro 5, 00185 Roma, Italy
cDipartimento di Chimica, Biologia e Biotecnologie, Università di Perugia, Via Elce di Sotto 8, 06123 Perugia, Italy
First published on 16th April 2019
Abstract
The VCD spectra of several chiral compounds containing the CF3 group are reviewed and analyzed. The list of compounds contains pharmaceutically relevant molecules as well as simple model molecules, having the value of case studies. In particular we point out the importance of the sign of the VCD band relative to some stretching normal mode of CF3 in the region 1110–1150 cm−1, as diagnostic of the configuration of stereogenic carbons C* to which the CF3 group is bound: the correspondence (−) ↔ (R) and (+) ↔ (S) holds for 100% of 1-aryl-2,2,2-trifluoroethanols. DFT calculations confirm these conclusions, but for the rule established here they serve just as a check. This rule is tested on two new compounds, namely N-tert-butanesulfinyl-1-(quinoline-4-yl)-2,2,2-trifluoroethylamine, 8, and 4-[2-(2,2,2-trifluoro-1-hydroxyethyl)pyrrolidin-1-yl]-2-(trifluoromethyl)benzonitrile, 10, both containing two stereogenic elements, one of them being an asymmetric carbon C* of unknown configuration binding a CF3 group. Discussion of the general validity of the rule is provided and some further tests are run on compounds in well-established drugs.
Introduction
Fluorine is a special atom, sharing some properties with the hydrogen atom (valence, size) but differing significantly in some others, so that, when it is used to replace H, it may change to an important degree some molecular properties, while still preserving or mimicking the minimal steric bulkiness of H and its binding properties. This may justify its large use in medicinal chemistry and in designing new drug molecules.1 Spectroscopic data help to understand the main chemico-physical properties we are alluding to. Table 1 reports the comparison of observed C–F frequencies (νC–F), IR integrated intensities of the CF-stretching mode(s) (A),2–9 the Atomic Polar Tensor (APT) characteristics of the fluorine atom, recently studied more thoroughly by updated methods,10–12 and bond lengths rCF in simple fluorine-containing molecules.| Compound (ref.) | νCX (cm−1) | A (km mol−1) | pAv (e) | β (e) | χ (e) | rCX (Å) |
|---|---|---|---|---|---|---|
| a νCX (cm−1) = observed IR frequency values; A (km mol−1) = observed IR intensity values; pAv (e) = average value of the Atomic Polar Tensor (APT) for F atom (or for H in CH4, or for Cl in CH3Cl). First (Linear) invariant of APT; β (e) = anisotropy (second (quadratic) invariant) of APT for F atom (or for H in CH4, or for Cl in CH3Cl). χ (e) = third (cubic) invariant of APT for F atom (or for H in CH4, or for Cl in CH3Cl). rCX (Å) = equilibrium bond length for CX bond (X = F or H in CH4, or for Cl in CH3Cl). [e = charge of the electron.] | ||||||
| CH4 (4) | 3019 | 69.7 | −0.004 | 0.670 | 0.019 | 1.090 |
| CH3Cl (5) | 738 | 23.4 | −0.268 | 0.175 | 0.298 | 1.780 |
| CH3F (3 and 6) | 1063 | 96.3 | −0.479 | 0.605 | 0.557 | 1.382 |
| CH2F2 (3 and 7) | 1090, 1111 | 311.9 | −0.488 | 0.640 | 0.574 | 1.351 |
| CHF3 (3 and 8) | 1150 (ν2 + ν5) | 626.8 | −0.505 | 0.670 | 0.595 | 1.332 |
| CF4 (3 and 9) | 1280 | 1080.0 | −0.512 | 0.410 | 0.547 | 1.329 |
Data for methane and chloromethane have been added for sake of comparison. For clarity's sake we recall the definition of Atomic Polar Tensor (APT) for atom X3 (particularly referenced to X = F):
the anisotropy (column 5, Table 1):
and the effective charge χ(F) (column 6), whose square is defined as 1/3 the trace of the APT square of fluorine atom; it should be noted that pAv(F), β(F) and χ(F) are invariant with respect to Cartesian axes choice. Not only the charge of the fluorine atom is ca. −0.5e and it increases in going from CH3F to CF4 with negative sign (as experimentally determined13–15), but fluorine exhibits also a large anisotropy, that means a large polarizability and a propensity to form hydrogen bonding.12 All these properties have been verified through DFT. In Table 2 we compare our own DFT calculated fundamental C–F stretching frequencies and the corresponding IR absorption intensities with the corresponding observed experimental data in the gas phase. Interestingly, irrespective of the fact that anharmonicity (neglected here) generally has the effect of decreasing their values, calculated frequencies are smaller than the observed ones, while the opposite happens for the intensities. In any case frequency values differ from the observed ones by 5% at most, while IR intensities by ca. 10%.
| Compound | νCF (cm−1) observed | νCF (cm−1) calculated | A (km mol−1) observed | A (km mol−1) calculated |
|---|---|---|---|---|
| a Calculations run by use of Gaussian09:22 computational level B3LYP/TZVP (see also Table 1). | ||||
| CH3F (3 and 6) | 1063 | 1043 | 96.3 | 111 |
| CH2F2 (3 and 7) | 1090, 1111 | 1067, 1103 | 89.5 + 230.4, Σ = 319.9 | 110 + 265, Σ = 375 |
| CHF3 (3 and 8) | 1150 | 1129, 1130 | Σ = 626.8 | 110 + 642, Σ = 752 |
| CF4 (3 and 9) | 1280 | 1247 | 1080 | 1362 |
Fourth point, but not the least, the length of the CF bond is progressively shorter as the number of C–F bonds (7th column in Table 1). This means a stronger C–F bond, which parallels the increasing value of νCF and increased effective charge value as well. From all the above properties, especially the large anisotropy, the presence of fluorine atoms is expected to affect the VCD spectra of organic molecules to a greater extent.
VCD is a technique,16–18 which, in conjunction with density functional theory (DFT) calculations, has emerged in the last 30 years as a powerful tool to investigate chiral molecules.19–22 Usually, it is applied together with other chiroptical techniques, like electronic circular dichroism (ECD) or optical rotatory dispersion (ORD).23,24
In this review we focus our attention onto a particular class of molecules bearing the CF3 group bound to a stereogenic carbon. The introduction of a CF3, into a structure of potentially bio-active compound, is an established paradigm in the modern medicinal chemistry and drug-design.25–27 Its use in medicinal chemistry dates almost a century, although the research became evermore intensive since the half of the past century. The trifluoromethyl group is often used as an isostere of iodine or an isopropyl group,28 bringing, however, the beneficial properties of fluorine. This is why it can be found in several agrochemicals, and patent drugs, encompassing Efavirenz, a HIV reverse transcriptase inhibitor; Befloxatone, a reversible inhibitor of monoamine oxidase A; Bitopertin, a glycine reuptake inhibitor; Ligandrol, for treatment of muscle wasting and osteoporosis; Mapracorat, an anti-inflammatory drug. In those drugs a CF3 group was added bound to a stereogenic carbon, and some of them were studied by VCD in a recent comprehensive paper.29
We feel that VCD is a privileged technique particularly suitable for the recognition of molecules containing CF3, since there is no specific electronic chromophore associated with this group to make the ECD technique competitive. Finally, we also surmise that some information may be gathered from VCD spectra about the interaction of the CF3 group with the molecular environment and this may be tied up with pharmacological properties of some drugs.
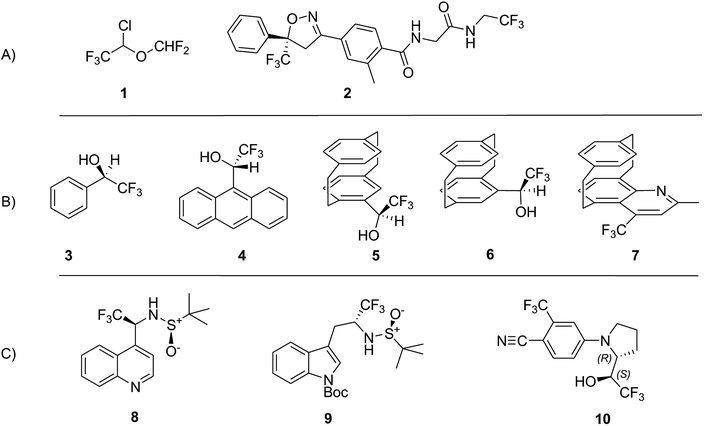
We shall consider the VCD spectra of some molecules containing CF3 groups, studied so far by this technique: from Table 1 we learn that the absolute value of the fluorine atomic charge in the CF3 group, as well as its anisotropy, are the highest among the fluorinated groups. The molecules whose VCD data will be discussed here, are depicted in Scheme 1, and are classified as follows: group A, previously studied pharmacologically important molecules (1 and 2); group B, previously studied molecules (3–7), exhibiting some relevant chiroptical and hydrogen bond properties established through VCD, IR spectroscopies and DFT calculations; group C, novel compounds (8 and10) studied by VCD here for the first time, plus a congener of 8, namely 9, which had been previously studied.30 The latter three compounds exhibit two stereogenic centers: in the sulfinamides 8 and 9 one stereocenter is the sulfur atom of a sulfoxide group of known AC and the additional stereogenic carbon binds a CF3 group.
Experimental
All data referring to the molecules 1–7 in Scheme 1 is from the literature. They are presented here and re-discussed in order to find a “fil rouge” binding several different instances.Data for stereoisomeric N-tert-butanesulfinyl-1-(quinoline-4-yl)-2,2,2-trifluoroethylamines (8) (Scheme 1) are fully commented in the present work for the first time, since the synthesis and properties thereof had never been investigated, while its “sister” molecule 9 was already studied in a previous work.30 Diastereomeric (X,RS)- and (Y,RS)-N-tert-butanesulfinyl-1-(quinoline-4-yl)-2,2,2-trifluoroethylamine (8) were obtained from the addition of 4-lithioquinoline to N-tert-butanesulfinyltrifluoroacetaldimine according to the following Scheme 2.
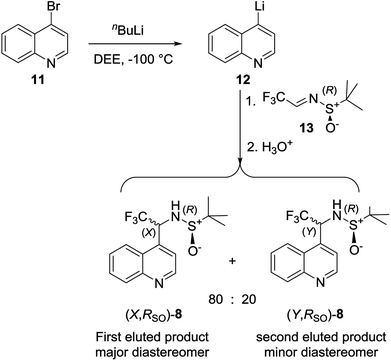 | ||
| Scheme 2 Synthesis of (X,RS)- and (Y,RS)-N-tert-butanesulfinyl-1-(quinoline-4-yl)-2,2,2-trifluoroethylamine. | ||
tert-Butyllithium (1.63 M in hexanes, 3.00 mL, 4.89 mmol) was added drop-wise in 5 min to a solution of 4-bromoquinoline (1.00 g, 4.81 mmol) in diethyl ether (22 mL) at −100 °C. After 90 min stirring at the same temperature, a solution of (R)-N-tert-butanesulfinyltrifluoroacetaldimine (1.00 g, 4.97 mmol) in diethyl ether (3 mL) was added, and the reaction mixture was stirred further for 90 min. The cold bath was removed and the temperature was allowed to rise to 25 °C before brine (25 mL) was added. The organic phase was separated and extracted with diethyl ether (3 × 25 mL), the collected organic phases were dried over Na2SO4 and the solvent was evaporated at reduced pressure. The remaining consisted mainly of a mixture of two diastereomeric products in 8![[thin space (1/6-em)]](https://www.rsc.org/images/entities/char_2009.gif) :
:![[thin space (1/6-em)]](https://www.rsc.org/images/entities/char_2009.gif) 2 molar ratio as determined by 19F NMR analysis. Chromatography on silica gel (eluent mixture, diethyl ether/ethyl acetate = 7
2 molar ratio as determined by 19F NMR analysis. Chromatography on silica gel (eluent mixture, diethyl ether/ethyl acetate = 7![[thin space (1/6-em)]](https://www.rsc.org/images/entities/char_2009.gif) :
:![[thin space (1/6-em)]](https://www.rsc.org/images/entities/char_2009.gif) 3) allowed to separate a white solid (1.03 mg; 65%), mp > 250 °C as the first eluted product exhibiting the following analytic and spectroscopic characteristics.
3) allowed to separate a white solid (1.03 mg; 65%), mp > 250 °C as the first eluted product exhibiting the following analytic and spectroscopic characteristics.
(X,RS)-N-tert-Butanesulfinyl-1-(quinoline-4-yl)-2,2,2-trifluoroethylamine [(X,RS)-8]. white rhombic crystals,: mp > 250 °C, [α]24D = +85 (c = 0.5, CH3OH). 1H NMR δ 9.03 (d, J = 4.6 Hz, 1H), 8.25 (d, J = 8.5 Hz, 1H), 8.14 (d, J = 8.6 Hz, 1H), 7.83 (t, J = 8.1 Hz, 1H), 7.70 (t, J = 8.2 Hz, 1H), 7.65 (d, J = 4.6 Hz, 1H), 5.80 (m, 1H), 4.13 (bd, J = 4.1 Hz, 1H), 1.26 (s, 9H); 13C NMR δ 149.6, 148.5, 137.9, 130.5, 130.0, 127.8, 126.6, 124.3 (q, J = 280 Hz), 122.6, 121.3, 56.9, 55.4 (broad), 22.3 (3C); 19F NMR δ −72.44 (bd, J = 7.1 Hz, 3 F). Elemental analysis, calcd for C15H17F3N2OS (330.37): C, 54.53; H, 5.19; N, 8.48. Found: C, 54.71; H, 5.25; N, 8.37. The second eluted product was obtained as yellow thick oil (0.26 g; 16%). (Y,RS)-N-tert-butanesulfinyl-1-(quinoline-4-yl)-2,2,3-trifluoroethylamine [(Y,RS)-8, 16%]. [α]24D = −201 (c = 0.5, CH3OH). 1H NMR δ 9.00 (d, J = 4.5 Hz, 1H), 8.25 (d, J = 8.1 Hz, 1H), 8.19 (d, J = 8.5 Hz, 1H), 7.84 (t, J = 7.9 Hz, 1H), 7.74 (t, J = 7.0 Hz, 1H), 7.61 (d, J = 4.5 Hz, 1H), 5.75 (quint, J = 6.7 Hz, 1H), 3.99 (d, J = 6.4 Hz, 1H), 1.28 (s, 9H); 13C NMR δ 149.3, 130.4, 130.2, 129.7, 128.2, 126.4, 125.7, 124.4 (q, J = 280 Hz), 122.5, 119.6, 57.4, 55.5 (q, J = 31 Hz), 22.3 (3C); 19F NMR δ −72.50 (d, J = 7.2 Hz, 3 F). Elemental analysis, calcd for C15H17F3N2OS (330.37): C, 54.53; H, 5.19; N, 8.48. Found: C, 54.64; H, 5.27; N, 8.54.
In the same way, diastereomeric (X,SS)- and (Y,SS)-N-tert-butanesulfinyl-1-(quinoline-4-yl)-2,2,3-trifluoroethylamine were obtained, in practically the same dr ratio and with satisfactory yields, starting from 4-bromoquinoline and (S)–N-tert-butanesulfinyltrifluoroacetaldimine. Their spectroscopic characteristics were identical to those reported above for (X,RS)-8 and (Y,RS)-8, respectively. Elemental analysis, calcd for C15H17F3N2OS (330.37): C, 54.53; H, 5.19; N, 8.48. Found, (X,SS)-8: C, 54.53; H, 5.19; N, 8.48; (Y,SS)-8: C, 54.68; H, 5.27; N, 8.36.
IR and VCD spectra were performed in CDCl3 solutions (ca. 0.08 M) in 200 μm-path length BaF2 IR cells and registered with a Jasco FVS-6000 apparatus, as the results of 5000 accumulated and averaged scans. Subtraction of the solvent was carried out both in the IR and in the VCD spectra, 4 cm−1 resolution was kept. DFT calculations were carried out by the use of Gaussian09, G09 for short;22 the MM analysis allowed a first screening of several conformers, then the use of the G09 module at the PBE0/TZVP/PCM(CH3Cl) level allowed to select 9 conformers for (R)-configuration arbitrarily assigned to the C*(CF3) stereogenic carbon and 6 conformers for the (S)-configuration. Rotational strengths were calculated through G09, based on Stephens' algorithm, PCM approximation being adopted. IR and VCD spectra were generated with a program resident in the Jasco VCD software package and compared with the corresponding experimental data, assuming a bandwidth of 10 cm−1, and with constant scaling factor of 0.98. ECD and UV measurements were performed in acetonitrile solutions (ca. 0.005 M) in 0.1 mm quartz cuvette. ECD-UV calculated spectra were treated with SpecDis.31
Compound 10, (4-[2-(2,2,2-trifluoro-1-hydroxyethyl)pyrrolidin-1-yl]-2-(trifluoromethyl)benzonitrile) was bought from Carbosynth, Gijanshu, China, and its integrity and structure was checked by NMR. We verified the compound to be optically inactive, by measuring all chiroptical properties available to us (OR, ECD and VCD). We thus attempted the separation of its four expected stereoisomers by HPLC on achiral and on chiral stationary phases. Chromatographic analysis on either bare silica or reversed C18 stationary phases always afforded a single, homogeneous peak. Chromatographic analysis on a chiral stationary phase (Chiralpak IA, 250 × 4.6 mm column, eluent hexane/CHCl3 1/1, flow rate 1.0 mL min−1) gave two equally intense peaks, oppositely signed when monitored by circular dichroism, with retention times of 17.9 and 20.3 minutes for the first and second eluted, respectively. The analytical separation was scaled up on a semipreparative column (Chiralpak IA, 250 × 10.0 mm column) giving 12.4 mg of the 1st eluted species with e.e. = 99.3%, and 13.8 mg of the second eluted one with e.e. = 95.5%. OR values, in chloroform solution, were measured at 589, 405 and 365 nm. First eluted (c 0.14): +68.4 (589 nm), +296.4 (405 nm) and +584.6 (365 nm). Second eluted (c 0.138): −64.3 (589 nm), −250.3 (405 nm) and −510.8 (365 nm). Taken together, chromatographic and polarimetric data indicate that compound 10 is a single diastereoisomer with racemic composition, either (R,S)/(S,R) or (R,R)/(S,S).
IR and VCD spectra of 10 were measured with the same apparatus and cell as for 8. The same computational protocol described above was followed, assuming either (R,R) or (R,S) as the configurational options, the second stereogenic center referring to the CF3-bearing carbon. For both options we considered all conformers, details are reported in the next section. In addition, a similarity analysis was also carried out. For the carbinol 10 calculations were effected using the functional M06-2X, as suggested recently by Kreienborg and Merten.32 Finally, in order to further strengthen our assignment, ECD spectra were also recorded with a Jasco 815SE instrument using ca. 0.0045 M acetonitrile solutions in 0.1 mm quartz cuvette. The conformer distribution was inferred from the B3LYP/TZVP/PCM (acetonitrile) and calculated ECD spectra from the CAM-B3LYP/TZVP/PCM (acetonitrile).
Discussion
The polyhalogenated ether 1 (Isoflurane®) is a widely used anesthetic33 and the diamide 2 (Fluralaner®) is used in veterinary medicine.34 Of course, they are not the only CF3 containing drugs submitted to VCD investigations,35,36 but, as far as we know, they are the first and the latest, respectively, to be investigated by this technique. In particular we would like to point out the systematic and complete contribution of Polavarapu and collaborators, who, at the offset of the VCD-DFT approach, established not only the absolute configuration (AC) of isoflurane, but also that of desflurane and 1,2,2,2-tetrafluoroethyl methyl ether by discussing also their relationship with 1-methoxytetrafluoropropionic acid, another anesthetic of the same family.37–39 The VCD and IR spectra of isoflurane and fluralaner are reported on the left and on the right, respectively, of Fig. 1.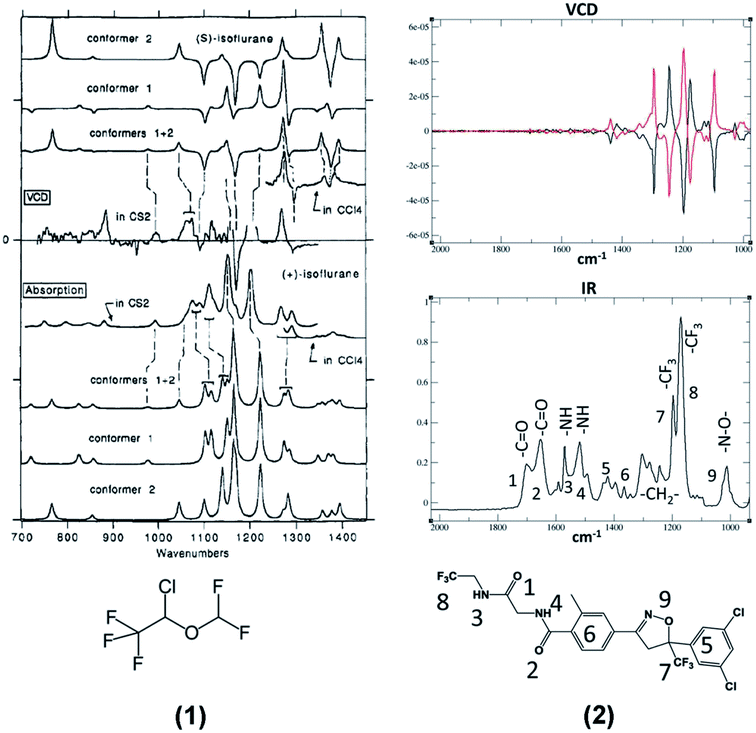 | ||
| Fig. 1 Left: VCD (top) and IR experimental and calculated spectra of Isoflurane, 1.33 Right: VCD (top) and IR experimental spectra of (±)-Fluralaner, 2.34 (Please notice that the wavenumber scales are in reversed order in the two spectra.) | ||
Though we do not intend effecting here a detailed analysis of the spectra of the products in Fig. 1, we note that they exhibit some important peculiarities, which are also present in the model compounds 3–7 with which the VCD technique has been tested for years. The first consideration involves the most intense IR doublet between 1100 and 1200 cm−1 in the spectra of molecules 1 and 2, both exhibiting a negative-positive couplet in their VCD spectra due to the antisymmetric and symmetric C–F stretching modes of the CF3 group (see Table 1). The signed character of VCD in this region gives to this couplet a relevant diagnostic value for the assignment of the absolute configuration at the stereogenic carbon bearing a CF3 group. Some similarities appear also in the IR and VCD spectra in the range 1200 and 1400 cm−1, where methine (isoflurane) and methylene (fluralaner) C–H bending modes are present.
The examination of the model compound 3–7 is motivated by the search for common features in the IR and VCD spectra of molecules containing CF3 groups. In Fig. 2 we juxtapose the IR and VCD spectra of both the enantiomers of 2,2,2-trifluoro-1-pheylethanol 3, (top) and of 1-phenylethanol (bottom).
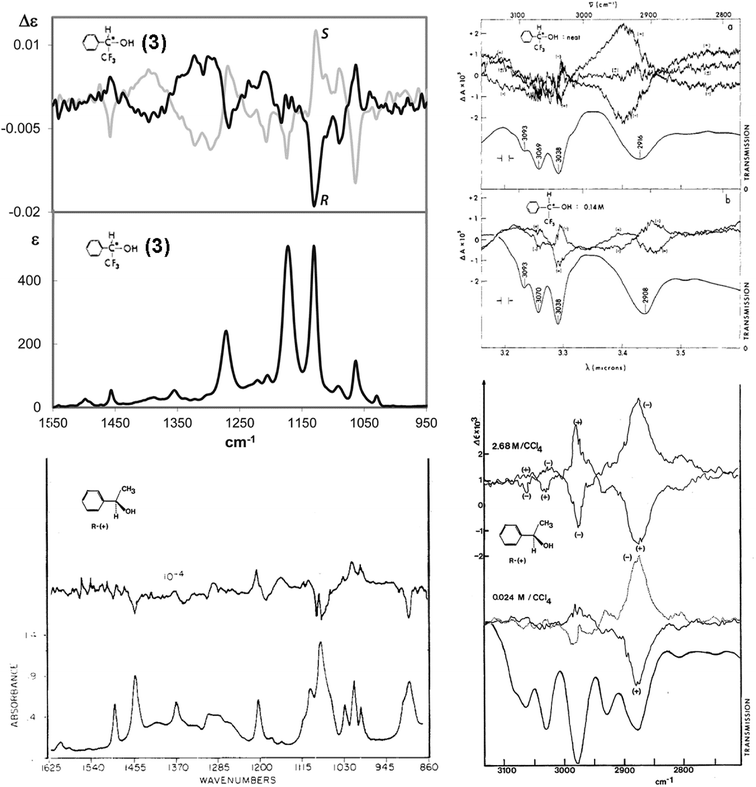 | ||
| Fig. 2 IR and VCD experimental spectra of the enantiomers of both 2,2,2-trifluoro-1-pheylethanol (3) (top) and 1-phenylethanol (bottom). Left, mid-IR region; right: CH-stretching region. (Data from ref. 38, 40–42.) | ||
These spectra have been recorded and analyzed by several authors. We report our own data for 2,2,2-trifluoro-1-pheylethanol in the mid-IR region,40 while data for 1-phenylethanol is from Polavarapu's work.38 Spectral data of 2,2,2-trifluoro-1-pheylethanol in the CH-stretching region are taken from the classical work of Nafie, Keiderling and Stephens,41 and those for 1-phenylethanol is from the nice work of Pultz.42 Referring to the CH-stretching region, we notice that the IR and VCD data of both 2,2,2-trifluoro-1-pheylethanol, 3, and 1-phenylethanol are fairly similar, that means fluorine has little influence, if any, on the C–H stretching region; the VCD spectrum is dominated by the C*–H stretching vibration, as proposed by Nafie and collaborators43,44 and verified by selectively deuterated analogues,45 though there is a remarkable dependence from the concentration. Unlike the CH-stretching region, the mid-IR region is influenced considerably by the presence of the CF3 group: overall, in that region the intensity is increased, as expected on the basis of the data of Tables 1 and 2. We also notice that the CF3-symmetric and antisymmetric stretching normal modes contributing to the IR and VCD bands at ca. 1130 and 1180 cm−1 are degenerate for CHF3 and are observed at ∼1150 cm−1 (Tables 1 and 2); the degeneracy is relieved by the interaction with adjacent groups, in particular with the polar OH-group competing with the electron-rich phenyl moiety. The IR intensity of the two components is much higher than that of all the other bands and the spectrum of 2,2,2-trifluoro-1-pheylethanol contains VCD bands which are stronger than those of 1-phenylethanol. In general, the VCD spectrum of 2,2,2-trifluoro-1-pheylethanol is quite different from that of 1-phenylethanol (see Fig. 2). No doubt, the presence of the CF3 group contributes substantially to increase the intensity of the VCD spectrum as a whole and it is easy to give a clear diagnostic value for AC assignment to the clearly defined and intense feature (at ∼1130 cm−1) nearby the observed CF3-symmetric stretching frequency in CHF3 (∼1150 cm−1). Namely, it has a negative sign for the (−)-(R) enantiomer and a positive sign for the (+)-(S) enantiomer. On the contrary, the feature at ca. 1180 cm−1 is weaker, and the sign is opposite to that of the other CF3-stretching component (Fig. 1). The new peculiar aspect of these two VCD bands ascribed to CF3-stretching normal modes, which is different from the perfectly bisignated aspect of Fig. 1, is due to the surrounding groups: the CF3 group attracts intramolecularly6,40,46 the OH group and competes effectively with the adjacent phenyl group; the propensity of CF3 to form H-bonding has a nice counterpart in the anisotropic character of the F-atom APT obtained through IR intensity analysis and evidenced in Table 1. In addition, the VCD intensification noticeable also in the rest of the spectrum at higher wavenumbers, in particular the broad and intense couplet between 1260 and 1430 cm−1, takes on some diagnostic value for the configuration assignment.
Similar phenomena are observed for other carbinols having the CF3 group bound to the α carbon. Fig. 3 shows the VCD and IR spectra of three chiral aryl (trifluoromethyl)carbinols, with the aryl group being phenyl (3), anthryl (4) and [2.2]paracyclophan-4-yl (5 and 6).40 In the first two cases the band at ca. 1130 cm−1 is intense in IR and VCD and exhibits a negative VCD sign for the (−)-(R)-enantiomer and the positive sign for the (+)-(S)-enantiomer. In the case of 2,2,2-trifluoro-1-(anthr-9-yl)ethanol the IR band is split and the VCD band is centered at ∼1100 cm−1 and its value appears indisputable for AC assignment. The VCD component at higher wavenumber (∼1200 cm−1), attributed to the other CF3-stretching component, is much weaker, though still intense in the IR, and exhibits the reversed sign with respect to the symmetric component; its value is less important for AC assignment compared with the lower frequency CF-stretching band. Even the very broad VCD band centered at ∼1300 cm−1 shows the same sign in the two molecules and thus is related to AC only, namely, it is positive for the (−)-(R)- and negative for the (+)-(S)-enantiomer.
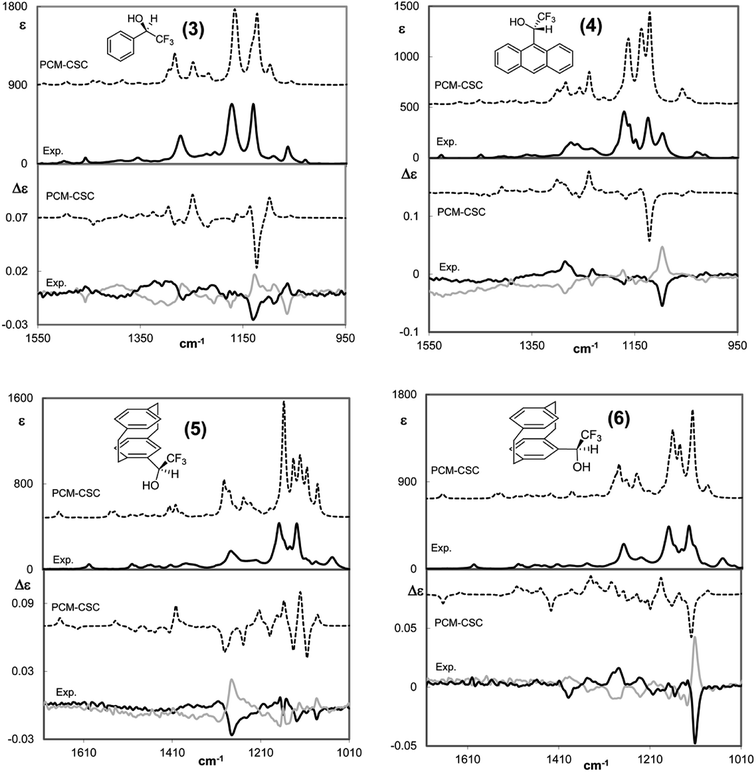 | ||
| Fig. 3 Comparison of calculated VCD (lower part of each panel) and IR (top part of each panel) spectra of the (R)-enantiomers/diastereomers with the corresponding experimental spectra of the (R) and (S) enantiomers of four chiral aryltrifluorocarbinols, aryl = phenyl, 3 (top left), = anthryl, 4 (top right), and = [2.2]paracyclophan-4-yl, (Rp)-5 and (Sp)-5 (bottom left and right, respectively). Data from ref. 40. No scaling factor applied. | ||
The case of 2,2,2-trifluoro-1-([2.2]paracyclophan-4-yl)ethanol 5 is slightly more complex, since the [2.2]paracyclophan-4-yl group adds a new stereogenic element, namely the planar chirality of paracyclophane moiety. We demonstrated how much the planar chiral paracyclophane moiety can help the AC assignment at the stereogenic carbon bound to it.40 In this case, VCD proved to be more effective than NMR in the AC assignment, which was further confirmed by X-ray. The VCD band at ∼1100 cm−1 containing the low-energy CF3-stretching normal mode is negative for (Rp,R) configuration, though with small intensity (bottom left in Fig. 3) and corresponds to (−) optical rotation. In the case of carbinol (Sp)-5, the VCD band at ca. 1100 cm−1 containing a low-energy CF3-stretching normal mode is more representative; it is negative for (Sp,R) AC (bottom right part of Fig. 3), it is quite intense and corresponds to (+) optical rotation. Here the 1100 cm−1 VCD band is Occam's resolving criterion for AC assignment to an ArC*H(CF3)OH system; in the previous case the criterion is still applicable, though the VCD band is weak. Ultimately, this is due to different interactions of the CF3 group with the neighbouring groups because of the different planar chirality.40 Other intense VCD bands may be useful for AC assignment, especially those at ∼1250 cm−1, due the C–F intensification phenomenon discussed above; it might be observed that the C–F stretching band frequency (∼1250 cm−1) is close to the value observed for the C–F stretching of CF4 (Tables 1 and 2) the latter may be considered the upper limit of influence of C–F stretching on the IR and VCD spectra.
Now let us consider CF3 in a quite different chiral environment. Fig. 4 shows the IR and VCD spectra of two closely related [2]paracyclo[2](5,8)quinolinophane derivatives of opposite planar AC, namely, (Rp)-2,4-dimethyl-[2]paracyclo[2](5,8)quinolinophane [(Rp)-11] and (Sp)-2-methyl-4-(trifluoromethyl)-[2]paracyclo[2](5,8)quinolinophane [(Sp)-7]. Apart from the different planar configuration, in the latter molecule a CF3 group replaces CH3 in the 4-position. It was pointed out that AC of a large number of quinolinophane derivatives is unambiguously defined by the (+,+,−) triplet between 1600 and 1500 cm−1 associated with (Rp), and (−,−,+) triplet associated with (Sp) configuration.47 This stands out clearly also in Fig. 4.
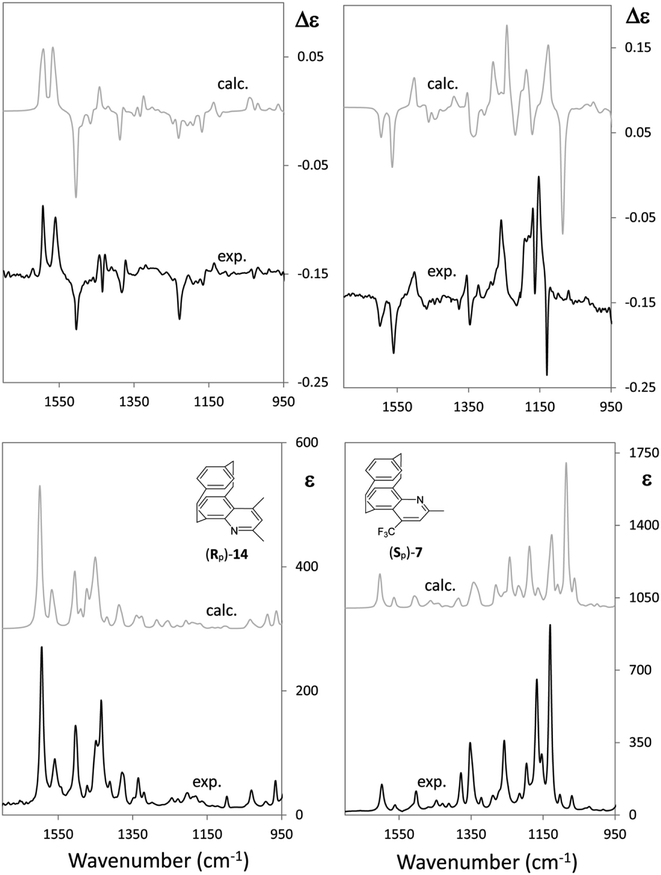 | ||
| Fig. 4 Comparison of the IR and VCD experimental and calculated spectra of two closely related (Rp)-2.4-dimethyl-[2]paracyclo[2](5,8)-quinolinophane [(Rp)-14] and (Sp)-2-methyl-4-(trifluoromethyl)-[2]paracyclo[2](5,8)-quinolinophane [(Sp)-7] (ref. 47). | ||
However, while the VCD and IR spectra of the dimethylquinolinophane (11) do not give any useful information below 1300 cm−1 (Fig. 4, left), the presence of the CF3 group (Fig. 4, right) offers a number of additional pieces of information, counting also two intense IR bands at 1170 and 1120 cm−1, due to mixed normal modes including C–F stretching. A strong VCD couplet is associated to the band at lower IR frequency, whose lower component is negative. The fact that the negative sign is associated with (Sp) planar chirality may be at odds with the correspondence (−) ↔ (R) for central chirality. This fact deserves investigating. It is due to the contamination of CF3-symmetric stretching with other modes of the quinolinophane moiety.
Before moving to the last part of this mini-review, we should remind that remarkable work on CF3 containing molecules has been carried out by Merten et al., by Monde et al. and again by the Polavarapu group.48–52
The last part of this work focuses on two new cases of VCD and IR spectra (compounds 8 and 10 of Scheme 1) with a special attention to C–F stretching modes:
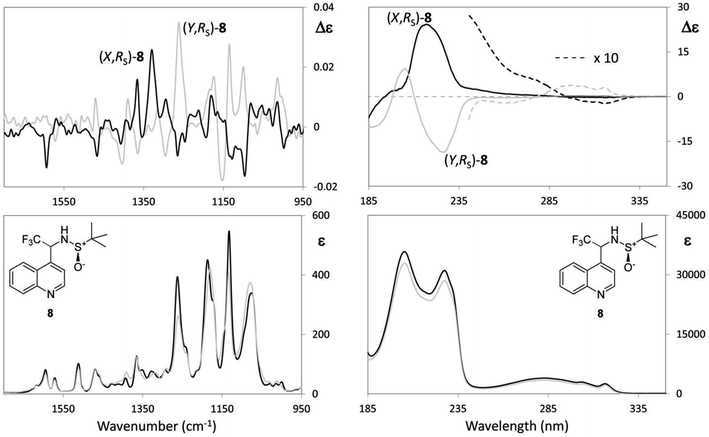
(a) The first case is N-tert-butanesulfinyl-1-(quinoline-4-yl)-2,2,2-trifluoroethylamine (8), which we consider together with the previously studied 1-tert-butoxycarbonyl-3-{2-[(tert-butanesulfinyl)amino]3,3,3-trifluoropropyl}-1H-indole (9), both containing a sulfoxide group with well-defined configuration at the sulfur atom and a stereogenic carbon bearing the CF3 group. Whilst the chiroptical properties of indole derivative 9 were extensively investigated in our previous work and the AC was correctly assigned,30 for the quinolone 8, the configuration at sulfur atom only is known. The two diastereomeric (X,RS)- and (Y,RS)-N-tert-butanesulfinyl-1-(quinoline-4-yl)-2,2,2-trifluoroethylamine compounds (8) (see experimental) were separated by simple chromatography on silica gel. In order to assign the AC to the stereogenic carbon of each diastereomer, the same approach based on DFT calculations was adopted, already employed in a previous work.30 However, owing to our increased confidence in handling chiroptical data and stemming from the considerations expounded above, at first, the interpretation of VCD was undertaken by looking at the experimental spectra only. VCD, IR, UV and ECD spectra are reported in Fig. 5; the spectra of each diastereomer having the same configuration at the sulfur atom designated with (X,RS)-8 and (Y,RS)-8 are superimposed; IR, VCD UV and ECD spectra for the respective enantiomers (Y,SS)-8 and (X,SS)-8 were also taken for a double check.
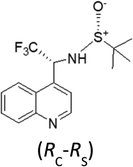
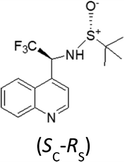
It should be noted that the UV and IR spectra of (X,RS)-8 and (Y,RS)-8 are essentially the same, though they could be different in principle, as for non meso-diastereomers. On the contrary, most of the features of the VCD and ECD spectra are different and show opposite sign, which makes them useful for AC assignment. Based on the previous analysis of VCD feature associated to CF3-symmetric stretching, a hypothesis of AC assignment can be formulated as follows: in correspondence of the intense IR band at ∼1130 cm−1 (X,RS)-8 exhibits a negative broad doublet, indeed, whereas (Y,RS)-8 exhibits a positive broad doublet almost enantiomeric to the feature of (X,RS)-8. On the basis of the analysis of the model compounds (3–7) we conclude that the negative feature at 1130 cm−1 corresponds to (R) configuration and the positive feature at 1130 cm−1 corresponds to (S) configuration; therefore, the AC of stereomer (X,RS)-8 is (R,RS)-8, and that of stereomer (Y,RS)-8 is (S,RS)-8. This is confirmed by applying the more rigorous protocol based on DFT calculations19 and in tune with similar compound 9.30 In accordance with that approach, we first carry out the conformational analysis of both (R,RS)- and (S,RS)-N-tert-butanesulfinyl-1-(quinoline-4-yl)-2,2,2-trifluoroethylamine. Results of such analysis are reported in Table 3.
| Conformer | ΔE (% pop) | ΔG (% pop) | φ (°) | ψ (°) | θ (°) | |
|---|---|---|---|---|---|---|
| a Dihedral angles φ, ψ and θ (in degrees) are more precisely defined in the text and denote respectively the orientation of CF3 with respect to the sulfoxide, to the aryl group and with respect to NH. ΔE and ΔG are expressed in kcal mol−1. | ||||||
| (R,RS)-N-tert-butanesulfinyl-1-(quinoline-4-yl)-2,2,2-trifluoroethylamine | ||||||
 |
a | 0 (60.6) | 0 (52.7) | 167 | 82 | 48 |
| b | 1.10 (9.3) | 0.73 (15.3) | 131 | 53 | −107 | |
| c | 1.82 (2.8) | 0.91 (11.3) | 96 | 90 | −37 | |
| d | 1.01 (9.7) | 0.96 (10.5) | 138 | 65 | −101 | |
| e | 0.92 (12.8) | 1.41 (4.8) | 171 | −102 | 53 | |
| f | 1.92 (2.4) | 1.77 (2.6) | 78 | 35 | −58 | |
![[thin space (1/6-em)]](https://www.rsc.org/images/entities/char_2009.gif) |
||||||
| (S,RS)-N-tert-butanesulfinyl-1-(quinoline-4-yl)-2,2,2-trifluoroethylamine | ||||||
 |
Conformer | ΔE (% pop) | ΔG (% pop) | φ (°) | ψ (°) | θ (°) |
| a | 1.05 (6.8) | 0 (32.5) | −157 | −89 | 73 | |
| b | 1.00 (7.4) | 0.06 (29.2) | −137 | −73 | 95 | |
| c | 0.26 (25.7) | 0.50 (14.0) | −108 | −89 | 16 | |
| d | 0.60 (14.3) | 0.59 (12.0) | −97 | −78 | 140 | |
| e | 0 (39.8) | 0.89 (7.2) | −93 | −24 | 140 | |
| f | 1.43 (3.6) | 1.37 (3.2) | −99 | 102 | 138 | |
Let us see now if full DFT and TD-DFT calculations provide the same answer. Several conformers are fairly well populated, though their population factors are different depending on whether they are calculated on the basis of either ΔE or ΔG, which means that large amplitude motions have a strong influence.53 In Table 3, the values of three important dihedral angles φ, ψ and θ, are reported: φ denotes the dihedral angle between F3C–C and N–SOtBu, ψ refers to the orientation of CF3 with respect to the aromatic moiety and θ represents the HNC*CF3-dihedral angle. In the most populated conformers, CF3 is away from both the quinoline moiety and sulfoxide group, whilst it tends to form hydrogen bond with amidic proton NH. The comparison of the calculated VCD spectra of (R,RS) and of (S,RS) with the superimposed experimental VCD spectra of (X,RS)-8 and (Y,RS)-8 is provided in Fig. 6 (the top and bottom part, respectively).
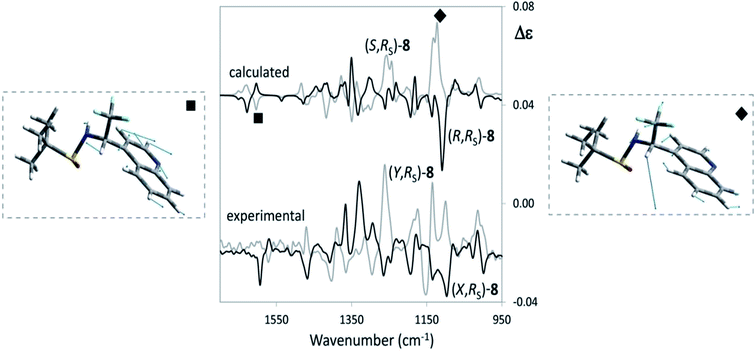 | ||
| Fig. 6 Comparison of VCD experimental spectra for (X,RS)- and (Y,RS)-N-tert-butanesulfinyl-1-(quinoline-4-yl)-2,2,2-trifluoroethylamine [(X,RS)- and (Y,RS)-8] with the corresponding calculated spectra of (R,RS)-8 and (S,RS)-8. The comparison allows to conclude that X = R and Y = S. Relevant VCD bands for AC assignment are evidenced and the underlying normal mode geometries, as calculated from Gaussian09,22 are depicted. | ||
We can see that the band at 1130 cm−1 (indicated with diamonds in Fig. 6) is associated with CF3 stretching and is diagnostic of the configuration of the stereogenic carbon and our above hypothesis about the configurational assignment turns out correct. However, it is worthwhile to notice that also the (−,+) couplet at ∼1600 cm−1 (indicated with a square in the spectra of Fig. 6), is diagnostic of C* configuration: DFT calculations show that both the VCD bands at 1130 cm−1 and at 1600 cm−1 contain a prevalent contribution from the C*H bending (in Fig. 6 the normal modes for the most populated conformers of (R,RS)- and (S,RS)-8 were considered). However, in the former case C*H bending combines with CF3-low frequency stretchings to a large extent, whereas in the latter case it does not and the corresponding intensity is lower.
The usefulness of VCD and, in particular, of the proposed empirical rule for the sign at ∼1150 cm−1 VCD band, in discriminating diastereomer configurations is better illustrated in the ESI,‡ where we provide more data for 8 and 9 and also the VCD data for the four diastereomers of a recently synthesized molecule, 2-acetyl-N-(tert-butanesulfinyl)-3-oxo-1-(trifluoromethyl)butylamine, obtained by Mannich-type addition of 1,3-dicarbonyl compounds to chiral tert-butanesulfinyltrifluoroacetaldimines.54
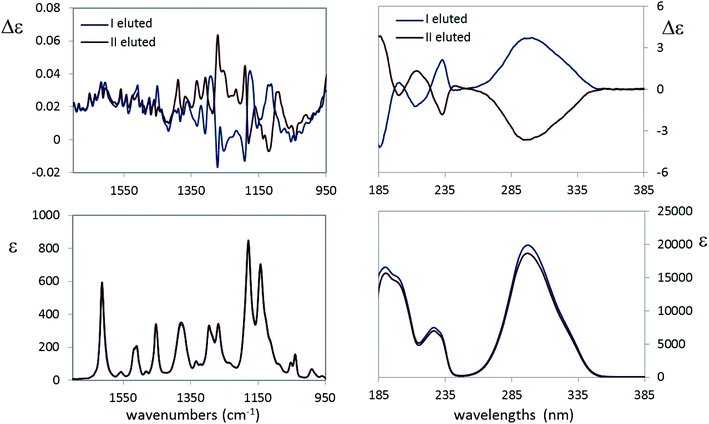
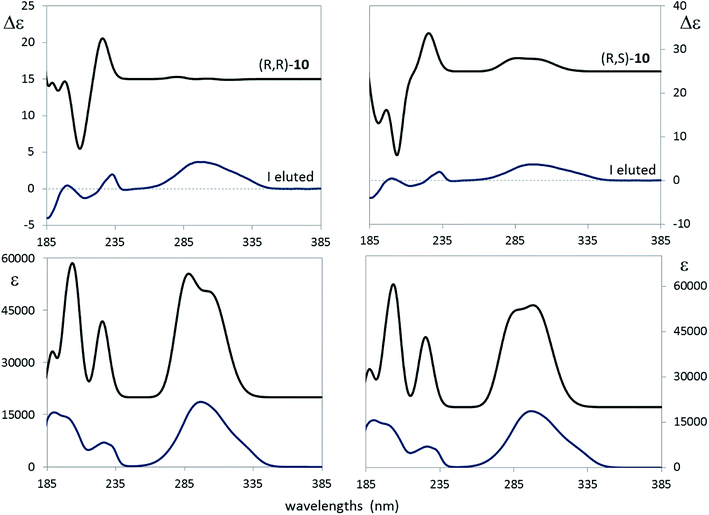
(b) The second new case-study here is 4-[2-(2,2,2-trifluoro-1-hydroxyethyl)pyrrolidin-1-yl]-2-(trifluoromethyl)benzonitrile, 10: indeed we received from Carbosynth Company an optically inactive product, with unknown diastereomeric composition, possibly a single diastereoisomer with racemic composition, instead of the expected Ligandrol®, the stereomer of (R,R) configuration. The chromatographic analysis of that product, performed on a chiral stationary phase, confirmed our hypothesis. As it is easy to gather from the experimental VCD, IR, ECD and UV spectra of the two eluted compounds shown in Fig. 7, they are enantiomers, given also the opposite specific rotation values measured immediately after the release of the samples from the column (see Experimental).
As a further proof, the absorption spectra (UV and especially IR) are identical, while the ECD as well as the VCD spectra are definitely mirror images, within the limits of experimental errors. It remains to be discovered whether the original sample is a (R,R)/(S,S) or (R,S)/(S,R) racemic mixture. DFT calculations help solving this dilemma and subsequently checking the above simple empirical rule for the CF3-symmetric stretching mode is valid. The free energy and corresponding population factors of the main conformers of the carbinol 10 for the (R,R) and (R,S) configurations respectively are reported in Table 4.
| CONF | ΔG | % pop | π | α | β | γ | d |
|---|---|---|---|---|---|---|---|
| a Dihedral angles: pucker (π: NC1*CC), α: C(CF3)C2*C1*N, β: HOC2*C(CF3), γ: C1*NC(ϕ)C(CF3) are in degrees, while the distance dH(O)–CF3 (d) is in Å. Free-energies are expressed in kcal mol−1. Significant reported conformers cover ca. 95% of overall populations. | |||||||
| (R,R)-a | 0.00 | 26.6 | −27.0 | −155.6 | 75.2 | −6.2 | 2.7 |
| (R,R)-b | 0.08 | 23.3 | −27.0 | −156.7 | 75.2 | 170.0 | 2.7 |
| (R,R)-c | 0.47 | 12.0 | −24.8 | −159.9 | 152.1 | −8.1 | 3.2 |
| (R,R)-d | 0.60 | 9.7 | 18.8 | −168.0 | 81.0 | −165.5 | 2.7 |
| (R,R)-e | 0.80 | 6.9 | −24.7 | −160.1 | 150.3 | 166.8 | 3.1 |
| (R,R)-f | 0.90 | 5.8 | 18.8 | −167.6 | 80.4 | 9.4 | 2.7 |
| (R,R)-g | 1.05 | 4.5 | −27.5 | −156.4 | −65.9 | 169.3 | 2.6 |
| (R,R)-h | 1.30 | 3.0 | −27.7 | −155.6 | −65.5 | −5.7 | 2.6 |
| (R,S)-a | 0.00 | 39.0 | −30.6 | −151.7 | 167.7 | 154.8 | 3.2 |
| (R,S)-b | 0.26 | 25.3 | −30.3 | −151.0 | 168.1 | −17.4 | 3.2 |
| (R,S)-c | 1.05 | 6.7 | −35.4 | 175.7 | −71.4 | −9.7 | 2.7 |
| (R,S)-d | 1.11 | 6.0 | −35.2 | 177.0 | −72.9 | 164.8 | 2.7 |
| (R,S)-e | 1.35 | 4.0 | −31.2 | −80.4 | 75.9 | −8.8 | 2.7 |
| (R,S)-f | 1.38 | 3.8 | −27.7 | 68.8 | −69.2 | 173.6 | 2.6 |
| (R,S)-g | 1.49 | 3.2 | −35.0 | −146.9 | 73.9 | 175.6 | 2.7 |
| (R,S)-h | 1.50 | 3.1 | −31.4 | −80.9 | 76.4 | 165.9 | 2.7 |
| (R,S)-i | 1.53 | 3.0 | −27.8 | 68.0 | −69.8 | −2.1 | 2.6 |
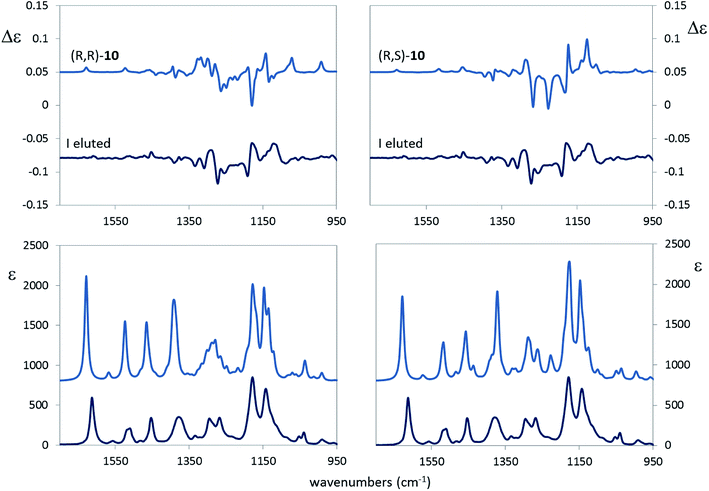
A large number of conformers is predicted for both the (R,R) and (R,S) options, with evident small free energy difference. Many of them arise from the rotation around the N–Ar bond: we observe, indeed, that the conformers in Table 4 come in pairs of almost equal free-energy value, one with the CF3 group connected to the aromatic ring and in pseudo-cis relation with the other CF3 group and the other pseudo-trans to it (cfr. the values of the γ dihedral angle in Table 4 for conformers a and b, c and d etc.). The main difference between the (R,R) and (R,S) option is that the two most populated conformers of the (R,R) stereomer show the OH bond closer to the CF3 group with a presumable hydrogen bond interaction, whereas, in the two most populated conformers of (R,S) stereomer the OH is directed towards the aromatic ring, as inferred from the angles β and the distance d. The α angle, in most cases close to 180°, allows one to conclude that the C2*–(CF3) and the C1*–N bonds are antiperiplanar trans in most cases. The puckering dihedral angle is negative in most cases, and this implies that the chiral group substituent of the pyrrolidine ring is axial. The comparison of the calculated VCD and IR spectra of the (R,R) and (R,S) configured molecules, scaled in frequency by 0.97, with the corresponding experimental spectra of the first eluted compound is shown in Fig. 8.
Visual inspection of the results in Fig. 8 seems to corroborate the (R,S) configuration assignment to the first eluted diastereomer. However, in order to be more quantitative, and to test the dependence from the scaling factor, we calculated for the VCD and IR spectra the similarity S.I. index55 and the Sim_NN index,56 critically discussed also in ref. 17. Results in Table 5 show that the (R,S) assignment to the first eluted sample we proposed above is better than (R,R), since larger S.I. and Sim_NN values are calculated for the former choice than for the latter. The 0.97 scaling factor is optimal; from the same table we infer, implicitly, that correlating to the experimental data of the first eluted compound the calculated VCD spectra of either the (S,S) or (S,R) choice is wrong, since negative indexes would be obtained in those case.
| VCD | ||||||
| Isomer | S.I.(1.00) | S.I.(0.99) | S.I.(0.98) | S.I.(0.97) | S.I.(0.96) | S.I.(0.95) |
| RR | 0.24 | 0.22 | 0.33 | 0.04 | 0.13 | 0.21 |
| RS | 0.40 | 0.23 | 0.49 | 0.69 | 0.27 | 0.24 |
| Isomer | Sim_NN(1.00) | Sim_NN(0.99) | Sim_NN(0.98) | Sim_NN(0.97) | Sim_NN(0.96) | Sim_NN(0.95) |
| RR | 0.14 | 0.12 | 0.20 | 0.02 | 0.07 | 0.11 |
| RS | 0.23 | 0.12 | 0.30 | 0.49 | 0.15 | 0.13 |
| IR | ||||||
| Isomer | S.I.(1.00) | S.I.(0.99) | S.I.(0.98) | S.I.(0.97) | S.I.(0.96) | S.I.(0.95) |
| RR | 0.60 | 0.63 | 0.75 | 0.90 | 0.86 | 0.71 |
| RS | 0.59 | 0.64 | 0.78 | 0.84 | 0.81 | 0.67 |
| Isomer | Sim_NN(1.00) | Sim_NN(0.99) | Sim_NN(0.98) | Sim_NN(0.97) | Sim_NN(0.96) | Sim_NN(0.95) |
| RR | 0.39 | 0.41 | 0.52 | 0.70 | 0.65 | 0.48 |
| RS | 0.36 | 0.41 | 0.55 | 0.61 | 0.58 | 0.43 |
A closer examination of the results in Fig. 8 induces us to pay attention to the characteristic IR doublet at 1160 and 1140 cm−1 corresponding respectively to the CF3 antisymmetric and CF3 symmetric modes, respectively, somewhat coupled to other vibrational modes. Noteworthy, the VCD band corresponding to the latter component is positive for the first eluted compound. It is reassuring that the correspondence (R,S) ↔ 1st eluted compound obeys the empirical rule we proposed in this work, i.e. the VCD band of the CF3 symmetric mode is positive for the (S) configuration of the stereogenic carbon; we also notice that this rule does neither imply nor require the OH and CF3 groups originating a hydrogen bond interaction.
As a final assessment of the just proposed assignment, let us look at Fig. 9, where the calculated ECD and UV spectra of (R,R)-10 and (R,S)-10 are compared with the experimental spectra of the first eluted compound. As described in the Experimental section, calculations in the PCM approximation were run keeping into account acetonitrile as the solvent; consequently a somewhat different conformer distribution of the same conformers of Table 4 was obtained. Fig. 9 suggests once again to favor the (R,S) option over the (R,R). Thus we conclude that what we had bought from Carbosynth was the racemic mixture of (R,S)-10 and of (S,R)-10.
Conclusions
In this work we have reviewed the IR and VCD spectra of a set of ca. ten representative chiral compounds containing the CF3 group, largely present in several important drugs, particularly, aryltrifluormethylcarbinols CF3–C*–H ArC*H(CF3)OH. The literature includes about 20 of these cases and we propose here an empirical rule to assign the absolute configuration, based on the sign of a VCD band, which applies in most cases. Indeed the band for the CF3-stretching, occurring at ca. 1150 cm−1, has a quite intense IR and VCD band, whose sign is diagnostic of the configuration at the stereogenic carbon C*: (−) for (R) and (+) for (S) configuration. The same bands have been investigated in other molecular contexts. The above empirical finding, which is somewhat independent on conformations, might prove quite useful to the organic chemists, and is backed by DFT calculations. Exceptions to the rule might occur when the spectroscopic region around 1150 cm−1 is particularly congested with other vibrational transitions, which couple with the low-energy CF3-stretching, significantly altering its interactions with the surrounding groups and for this reason changing its VCD response. The empirical rule was useful to assess the configurational assignment of two new cases, namely N-tert-butanesulfinyl-1-(quinoline-4-yl)-2,2,2-trifluoroethylamine and 4-[2-(2,2,2-trifluoro-1-hydroxyethyl)pyrrolidin-1-yl]-2-(trifluoromethyl)benzonitrile. For the latter the use of VCD data and in particular of the proposed empirical rule is efficacious in helping one establish the absolute configuration to be either (R,S) or (S,R) for a product which is on the market, while the drug ligandrol®, with the same chemical formula, is claimed to be (R,R).Finally we wish to report that, while reviewing the existing VCD literature for CF3-containing compounds, we realized that quite a few such studies exist. Thus there is ample room for future investigations of this sort, starting possibly from CF3-substituted steroids, which have paved the way to chiroptical techniques, as of the seminal studies by Djerassi,57 but have not been sufficiently considered by VCD. Another ground to be soon investigated should be the study of fluorine based NMR shift reagents, like Eu(fod)3.58
Conflicts of interest
There are no conflicts to declare.Acknowledgements
We are grateful to University of Brescia for supporting this work, under the auspices of International Activities program. We wish also to acknowledge the use of computer and software facilities at CINECA-Bologna, Italy, and Regione Lombardia for the LISA grant “LI08p_ChiPhyto”, HPL13POZE1.Notes and references
- (a) Y. Zhou, J. Wang, Z. Gu, S. Wang, W. Zhu, J. L. Aceña, V. A. Soloshonok, K. Izawa and H. Liu, Chem. Rev., 2016, 116, 422–518 CrossRef CAS PubMed; (b) V. Prakash Reddy, Organofluorine Compounds in Biology and Medicine, Elsevier, 2015 Search PubMed; (c) J. Wang, M. Sánchez-Roselló, J. L. Aceña, C. del Pozo, A. E. Sorochinsky, S. Fustero, V. A. Soloshonok and H. Liu, Chem. Rev., 2014, 114, 2432–2506 CrossRef CAS PubMed; (d) T. Yamazaki, T. Taguchi and I. Ojima, Unique Properties of Fluorine and their Relevance to Medicinal Chemistry and Chemical Biology, in Fluorine in Medicinal Chemistry and Chemical Biology, ed. I. Ojima, Wiley, 2009 Search PubMed; (e) Fluorine and Health, ed.Tressaud and G. Haufe, Elsevier, 2008 Search PubMed; (f) Fluorine in Pharmaceutical and Medicinal Chemistry, ed. V. Gouverneur and K Müller, Imperial College Press, 2012 Search PubMed.
- M. Gussoni, S. Abbate and G. Zerbi, Prediction of Infrared and Raman Intensities by Parametric Methods, in Vibrational Spectroscopy. Modern Trends, ed. A. J. Barnes and W. J. Orville Thomas, Elsevier, Amsterdam, ch. 14, 1977 Search PubMed.
- W. B. Person, Infrared Intensities and Atomic Polar Tensors. Ch.4, and: Prediction of infrared Intensities by Transfer of Atomic Polar tensors. Ch. 14, in Vibrational Intensities in Infrared and Raman Spectroscopies, ed. W. B. Person and G. Zerbi, Elsevier, Amsterdam, 1982 Search PubMed.
- M. Gussoni, Infrared Intensities by Parametric Methods; A Guided Tour. Ch. 5, in Vibrational Intensities in Infrared and Raman Spectroscopies, ed. W. B. Person and G. Zerbi, Elsevier, Amsterdam, 1982 Search PubMed.
- S. Kondo, Y. Koga, T. Nakanaga and S. Saëki, Bull. Chem. Soc. Jpn., 1983, 56, 416–421 CrossRef CAS.
- J. H. Newton and W. B. Person, J. Chem. Phys., 1976, 64, 3036–3049 CrossRef CAS.
- S. Kondo, T. Nakanaga and S. Saëki, J. Chem. Phys., 1980, 73, 5409–5418 CrossRef CAS.
- K. Kim and W. T. King, J. Chem. Phys., 1980, 73, 5591–5597 CrossRef CAS.
- J. H. Newton, R. A. Levine and W. B. Person, J. Chem. Phys., 1977, 67, 3282–3288 CrossRef CAS.
- A. F. Silva, W. E. Richter, A. B. M. S. Bassi and R. E. Bruns, Phys. Chem. Chem. Phys., 2015, 17, 30378–30388 RSC.
- W. E. Richter, L. J. Duarte, A. F. Silva and R. E. Bruns, J. Braz. Chem. Soc., 2016, 27, 979–991 CAS.
- A. Milani, J. Zanetti, C. Castiglioni, E. Di Dedda, S. Radice, G. Canil and C. Tonelli, Eur. Polym. J., 2012, 48, 391–403 CrossRef CAS.
- S. Abbate and M. Gussoni, Chem. Phys., 1979, 40, 385–395 CrossRef CAS.
- S. Kondo and S. Saëki, J. Chem. Phys., 1982, 76, 809–816 CrossRef CAS.
- K. Kim and C. W. Park, Bull. Korean Chem. Soc., 1987, 8, 174–179 CAS.
- L. A. Nafie, Vibrational Optical Activity: Principles and Applications, John Wiley and Sons, New York, NY, 2011 Search PubMed.
- P. L. Polavarapu, Chiroptical Spectroscopy. Fundamentals and Applications, CRC Press, Boca Raton, FL, 2017 Search PubMed.
- T. A. Keiderling and A. Lakhani, Chirality, 2018, 30, 238–253 CrossRef CAS PubMed.
- P. J. Stephens, F. J. Devlin and J. R. Cheeseman. VCD Spectroscopy for Organic Chemists, CRC Press, Boca Raton, FL, 2012 Search PubMed.
- P. J. Stephens, J. Phys. Chem., 1985, 89, 748–752 CrossRef CAS.
- J. Tomasi, B. Mennucci and R. Cammi, Chem. Rev., 2005, 105, 2999–3094 CrossRef CAS PubMed.
- M. J. Frisch, G. W. Trucks, H. B. Schlegel, G. E. Scuseria, M. A. Robb, J. R. Cheeseman, G. Scalmani, V. Barone, B. Mennucci, G. A. Petersson, H. Nakatsuji, M. Caricato, X. Li, H. P. Hratchian, A. F. Izmaylov, J. Bloino, G. Zheng, J. L. Sonnenberg, M. Hada, M. Ehara, K. Toyota, R. Fukuda, J. Hasegawa, M. Ishida, T. Nakajima, Y. Honda, O. Kitao, H. Nakai, T. Vreven, J. A. Montgomery Jr, J. E. Peralta, F. Ogliaro. M. Bearpark, J. J. Heyd, E. Brothers, K. N. Kudin, V. N. Staroverov, R. Kobayashi, J. Normand, K. Raghavachari, A. Rendell, J. C. Burant, S. S. Iyengar, J. Tomasi, M. Cossi, N. Rega, J. M. Millam, M. Klene, J. E. Knox, J. B. Cross, V. Bakken, C. Adamo, J. Jaramillo, R. Gomperts, R. E. Stratmann, O. Yazyev, A. J. Austin, R. Cammi, C. Pomelli, J. W. Ochterski, R. L. Martin, K. Morokuma, V. G. Zakrzewski, G. Voth, P. Salvador, S. Dannenberg, S. Dapprich, A. D. Daniels, Ö. Farkas, J. B. Foresman, J. V. Ortiz, J. Cioslowski and D. J. Fox, Gaussian 09, Revision A.02, Gaussian, Inc., Wallingford CT, 2009 Search PubMed.
- P. L. Polavarapu, E. A. Donahue, G. Shanmugam, G. Scalmani, E. K. Hawkins, C. Rizzo, I. Ibnusaud, G. Thomas, D. Habel and D. Sebastian, J. Phys. Chem. A, 2011, 115, 5665–5673 CrossRef CAS PubMed.
- P. Scafato, F. Caprioli, L. Pisani, D. Padula, F. Santoro, G. Mazzeo, S. Abbate, F. Lebon and G. Longhi, Tetrahedron, 2013, 69, 10752–10762 CrossRef CAS.
- (a) K. Izawa, J. L. Aceña, J. Wang, V. A. Soloshonok and H. Liu, Eur. J. Org. Chem., 2016, 16 Search PubMed; (b) W. K. Hagmann, J. Med. Chem., 2008, 51(15), 4359–4369 CrossRef CAS PubMed; (c) H.-J. Böhm, D. Banner, S. Bendels, M. Kansy, B. Kuhn, K. Müller, U. Obst-Sander and M. Stahl, ChemBioChem, 2004, 5, 637–643 CrossRef PubMed.
- For books or reviews, see: (a) Fluorinated Pharmaceuticals: Advances in Medicinal Chemistry, ed. A. D Westwell, Future Science, 2015 Search PubMed; (b) E. P. Gillis, K. J. Eastman, M. D. Hill, D. J. Donnelly and N. A. Meanwell, J. Med. Chem., 2015, 58(21), 8315–8359 CrossRef CAS PubMed; (c) Fluorine in Pharmaceutical and Medicinal Chemistry: From Biophysical Aspects to Clinical Applications, ed. V. Gouverneur, and Klaus Muller, 1st edn, Imperial College Press, 2012 Search PubMed; (d) J.-P. Bégué and D. Bonnet-Delpon, Bioorganic and Medicinal Chemistry of Fluorine, 1st edn, Wiley, 2008 CrossRef.
- W. Zhu, J. Wang, S. Wang, Z. Gu, J. L. Aceña, K. Izawa, H. Liu and V. A. Soloshonok, J. Fluorine Chem., 2014, 167, 37–54 CrossRef CAS.
- R. Ruzziconi, S. Spizzichino, A. Mazzanti, L. Lunazzi and M. Schlosser, Org. Biomol. Chem., 2010, 8, 4463–4471 RSC.
- E. C. Sherer, C. H. Lee, J. Shpungin, J. F. Cuff, C. Da, R. Ball, R. Bach, A. Crespo, X. Gong and C. J. Welch, J. Med. Chem., 2014, 57, 477–494 CrossRef CAS PubMed.
- G. Mazzeo, G. Longhi, S. Abbate, M. Palomba, L. Bagnoli, F. Marini, C. Santi, J. Han, V. A. Soloshonok, E. Di Crescenzo and R. Ruzziconi, Org. Biomol. Chem., 2017, 15, 3930–3937 RSC.
- T. Bruhn, A. Schaumlöffel, Y. Hemberger and G. Bringmann, Chirality, 2013, 25, 243–249 CrossRef CAS PubMed.
- N. N. Kreienborg and C. Merten, Phys. Chem. Chem. Phys., 2019, 21, 3506–3511 RSC.
- P. L. Polavarapu, A. L. Cholli and G. Vernice, J. Am. Chem. Soc., 1992, 114, 10953–10955 CrossRef CAS.
- J. Kong, L. A. Joyce, J. Liu, T. M. Jarrell, J. C. Culberson and E. C. Sherer, Chirality, 2017, 29, 854–864 CrossRef CAS PubMed.
- T. B. Freedman, X. Cao, L. A. Nafie, A. Solladié-Cavallo, L. Jierry and L. Bouerat, Chirality, 2004, 16, 467–474 CrossRef CAS PubMed.
- O. McConnell, Y. He, L. Nogle and A. Sarkahian, Chirality, 2007, 19, 716–730 CrossRef CAS PubMed.
- P. L. Polavarapu, C. Zhao, A. S. Cholli and G. G. Vernice, J. Phys. Chem. B, 1999, 103, 6127–6132 CrossRef CAS.
- P. L. Polavarapu, L. P. Fontana and H. E. Smith, J. Am. Chem. Soc., 1986, 108, 94–99 CrossRef CAS.
- L. A. Rozov, P. W. Rafalko, S. M. Evans, L. Brockunier and K. Ramig, J. Org. Chem., 1995, 60, 1319–1325 CrossRef CAS.
- S. Abbate, F. Lebon, S. Lepri, G. Longhi, R. Gangemi, S. Spizzichino, G. Bellachioma and R. Ruzziconi, ChemPhysChem, 2011, 12, 3519–3523 CrossRef CAS PubMed.
- L. A. Nafie, T. A. Keiderling and P. J. Stephens, Vibrational Circular Dichroism, J. Am. Chem. Soc., 1976, 98, 2715–2723 CrossRef CAS.
- V. M. Pultz, Vibrational Circular Dichroism Studies of Some Small Chiral Molecules, PhD Thesis, University of Minnesota, 1983.
- M. G. Paterlini, T. B. Freedman and L. A. Nafie, J. Am. Chem. Soc., 1986, 108, 1389–1397 CrossRef CAS.
- D. M. P. Gigante, F. Long, L. A. Bodack, J. M. Evans, J. Kallmerten, L. A. Nafie and T. B. Freedman, J. Phys. Chem. A, 1999, 103, 1523–1537 CrossRef CAS.
- M. Passarello, S. Abbate, G. Longhi, S. Lepri, R. Ruzziconi and V. P. Nicu, J. Phys. Chem. A, 2014, 118, 4339–4350 CrossRef CAS PubMed.
- F. Hof, D. M. Scofield, W. B. Schweizer and F. Diederich, Angew. Chem., Int. Ed., 2004, 116, 5166–5169 CrossRef.
- G. Mazzeo, G. Longhi, S. Abbate, F. Buonerba and R. Ruzziconi, Eur. J. Org. Chem., 2014, 7353–7363 CrossRef CAS.
- C. Merten, K. J. Jalkanen, V. C. Weiss and A. Hartwig, Chirality, 2010, 22, 772–777 CAS.
- K. Monde, N. Miura, M. Hashimoto, T. Taniguchi and T. Inabe, J. Am. Chem. Soc., 2006, 128, 6000–6001 CrossRef CAS PubMed.
- F. Wang, P. L. Polavarapu, V. Schurig and R. Schmidt, Chirality, 2002, 14, 618–624 CrossRef CAS PubMed.
- P. L. Polavarapu, C. Zhao and K. Ramig, Tetrahedron: Asymmetry, 1999, 10, 1099–1106 CrossRef CAS.
- C. D. Tran, V. I. Grishko and G. Huang, Anal. Chem., 1994, 66, 2630–2635 CrossRef CAS PubMed.
- G. Longhi, S. Abbate, P. Scafato and C. Rosini, Phys. Chem. Chem. Phys., 2010, 12, 4725–4732 RSC.
- G. Mazzeo, G. Longhi, S. Abbate, F. Mangiavacchi, C. Santi, J. Han, V. A. Soloshonok, L. Melensi and R. Ruzziconi, Org. Biomol. Chem., 2018, 16, 8742–8750 RSC.
- T. Kuppens, W. Langenaeker, J. P. Tollenaere and P. Bultinck, J. Phys. Chem. A, 2003, 107, 542–553 CrossRef CAS.
- J. Shen, C. Zhu, S. Reiling and R. Vaz, Spectrochim. Acta, Part A, 2010, 76, 418–422 CrossRef PubMed.
- C. Djerassi, Steroids, in Optical Rotatory Dispersion, ed. C. Djerassi, McGraw-Hill, New York, 1960, ch. 4 Search PubMed.
- D. H. Williams, Pure Appl. Chem., 1974, 40, 25–40 CAS.
Footnotes |
| † Work presented in part at the International VOA-6 Conference held in Brescia, Italy, in September 9-13, 2018. |
| ‡ Electronic supplementary information (ESI) available: Experimental VCD and IR spectra of enantiomers and diastereomers (when available) of compounds 8 and 9 and diastereomers of (X,Y)-2-acetyl-N-(tert-butanesulfinyl)-3-oxo-1-(trifluoromethyl)butylamine.54 See DOI: 10.1039/c9ra01358j |
| § At the time the research was carried out, SP was an Erasmus student from University of Zagreb, Croatia, visiting the lab in Perugia, Italy, headed by RR. |
| This journal is © The Royal Society of Chemistry 2019 |


