 Open Access Article
Construction of novel multifunctional luminescent nanoparticles based on DNA bridging and their inhibitory effect on tumor growth†
Qiaobei Pan‡
a,
Jing Zhang‡ b,
Xiang Li*c,
Qian Zouc,
Peng Zhangb,
Ying Luob and
Yi Jin*a
aNational Pharmaceutical Engineering Center for Solid Preparation in Chinese Herbal Medicine, Jiangxi University of Traditional Chinese Medicine, Nanchang, Jiangxi Province, People's Republic of China. E-mail: jinyidr@163.com; Tel: +86-791-8711-9610
bKey Laboratory of Modern Preparation of TCM, Ministry of Education, Jiangxi University of Traditional Chinese Medicine, Nanchang, Jiangxi Province, People's Republic of China
cState Key Laboratory of Innovative Drug and Efficient Energy-Saving Pharmaceutical Equipment, Jiangxi University of Traditional Chinese Medicine, Nanchang, Jiangxi Province, People's Republic of China. E-mail: 20111013@jxutcm.edu.cn; Tel: +86-791-8711-9661
First published on 14th May 2019
Abstract
Cyclic RGD peptide was introduced onto the surface of silver nanoparticle (AgNP)-single strand DNA (ssDNA)-graphene quantum dots (GQDs) (ADG) after coating with a hybrid phospholipid material (ADG-DDPC) to be used for antitumor treatment. The Ag and ssDNA content was quantified. The morphology and properties of the nanoparticles were characterized by ultraviolet-visible absorption spectroscopy (UV-VIS), scanning electron microscopy (SEM), transmission electron microscopy (TEM), and atomic force microscopy (AFM). The etching effect of H2O2 on the AgNPs and the cleavage of DNA was observed. The cytotoxicity of the ADG-DDPC was investigated using the cell viability and LDH content. The cell uptake was evaluated by using the fluorescence recovery of the GQDs in the ADG-DDPC. The antitumor effects of ADG-DDPC were also evaluated. The content of the ssDNA was 15.3 μg mL−1. The content of the silver element in AgNPs was 3.75 μg mL−1 and 20.43 μg mL−1 in ADG-DDPC. ADG were distributed uniformly with the GQDs on the surface. After coating with hybrid phospholipid membranes containing DSPE-PEG2000-cRGD, ADG-DDPC was detected with an average size of 25.2 nm with a low IC50 of 209.68 ng mL−1 and showed LDH activity on HeLa cells. A better cellular uptake of ADG-DDPC was observed in HeLa cells, compared with cRGD-unmodified ADG nanoparticles (ADG-DDP), up to 6 and 12 h using the fluorescence recovery of GQDs as a measurement. Compared with ADG-DDP (3.6 mg of silver equivalent per kg body weight), ADG-DDPC at the same dose significantly halted 50.9% of tumor growth with little change to body weights when compared with a PTX Injection (10 mg kg−1). The novel nanoparticles, ADG-DDPC, could target tumor sites to exhibit multifunctional inhibition on tumor growth with little toxicity.
Introduction
Cancer is a group of diseases that originate in human epithelial tissue and is the most common type of malignancy.1 Chemotherapy and radiotherapy are commonly used in traditional cancer treatment.2,3 These treatments can inhibit the growth of tumors to some extent, but can also cause systemic toxicity, resistance tolerance and other defects. Normal human tissue has a huge adverse reactions to these treatments, making this a difficult problem in medical history.4 Obviously, a single, traditional treatment method can no longer meet our clinical needs. Therefore, treatments based on tumor specific cell surface receptor binding peptides, such as apoptosis peptides, suicide genes, and imaging dyes have been developed.5–7 Many have been designed to achieve accurate and systematic delivery and significantly reduce the damage to normal tissues caused by drugs or tumor suppressing substances.8 In recent decades, many research groups have developed novel multi-functional preparations such as dual targeting liposomes,9 microcapsules and microspheres,10,11 inclusion complexes,12 and nanoparticles.13,14Graphene quantum dots (GQDs) are a new type of materials that have been evolved from graphene. The most obvious difference between GQDs and graphene is that the energy level band gap of GQDs is about 7 eV, compared to the energy band gap of graphene which is zero. This difference gives GQDs have a stronger edge effect and a smaller size effect, and the fluorescence quantum yield is significantly higher than that of graphene.15,16 GQDs are generally about 10 nm in size, and not only retain the properties of graphene, that is, the large π bond, but also introduces many characteristic light energy clusters during the synthesis, such as hydroxyl, carboxyl, amino, and so forth.17 This makes it possible to provide a theoretical basis for the successful connection to other materials. Owing to their good biocompatibility, chemical inertness and stable photoluminescence, GQDs have broad prospects for applications in biosensor imaging and optoelectronic devices. By using the photoluminescence properties of GQDs and changing their particle size of GQDs, the gap between the conduction band and the valence band can be changed, which directly affects the variation of the emission wavelength of GQDs with the change of the particle size.18 At present, a large number of published studies have reported the synthesis of GQDs, and have shown that different fluorescence colors can be generated.19–22 If we can accurately transport GQDs to the tumor site and make use of the important photoluminescence characteristics under the action of an external light source, by focusing the light at the tumor site, we could overcome the problem of the tumor site being difficult to determine and could reach a the radical cure.23–25
Silver nanoparticles (AgNPs) have been developed for a broader range of applications, such as for use as photosensitive materials,26 decorative materials, catalysis, antibacterial materials and in medicine.27–30 Many methods have been reported for the preparation of AgNPs, including spherical, tubular, rod-shaped, and so forth, and these are sized between 1–100 nm.31–35 AgNPs have a very large specific surface area and a small size effect and are often used as a fungicide. Owing to the increasing advantages of using AgNPs in the bactericidal field, many research groups have begun to study their potential in anti-tumor cells.36–40 Research teams have shown that AgNPs does have varying degrees of killing effect on many cancer cell lines, such as breast cancer cells,41,42 lymphoma cells,43 cervical cancer cells,44 and lung cancer cells,45 which provided the idea of developing a novel inorganic anti-tumor nanoscale preparation. AgNPs can also indirectly induce the production of reactive oxygen species (ROS) by inducing inflammatory responses in cells.46–49 ROS is a series of reactive oxygen species produced by aerobic cells in the metabolic process, including: O2−, H2O2, HO2 ˙and·OH.50 Aceituno et al. indicated that the toxicity of reactive oxygen species mainly comes from the peroxidation reaction with cellular proteins and unsaturated fatty acids, which destroys the cell membrane structure and further leads to apoptosis.51
Here, we designed AgNPs/GQDs cores bridged by a single strand DNA (ssDNA). The design was developed to take advantage of the following points: (1) nano-silver demonstrates strong cytotoxicity against many cancer cells;52,53 (2) GQDs with stable photoluminescence can stimulate cells to produce reactive oxygen species (ROS), which has a certain inhibitory effect on cell growth; (3) ssDNA, is connected to the AgNPs/GQDs by π–π stacking between the GQDs and the surface of AgNPs-DNA.54
Therefore, cRGD cyclic peptides, that have the sequence: cyclo (Arg-Gly-Asp-D-Phe-Cys), were used to modify hybrid phospholipids membrane after coating ADG cores to achieve long-circulation profile and tumor targeting.55 First, the RGD specifically acts on the surface of the tumor cells or the surface of the αvβ3 integrin receptor on the tumor vascular endothelial cells.56 Then the cell surface specific proteolytic enzyme cleaves the cRGD peptide to form an activated CendR peptide which can specifically recognizes and activates the neuropilin-1 receptor on the cell surface and can therefore achieve targeted delivery through the cell membrane.57 We used cRGD as a specific transport carrier to externally modify the long-circulation time of the nanomaterials. The coupled nanomaterials can not only maintain long cycle properties in vivo, but the delivery of nanomaterials to the tumor during this process is also maximized.58–61
The aim of this article is to describe the construction of a new nano-formulation which can target the tumor tissue and achieve the long-circulation of nanoparticles in the body by fabricating an inorganic nanosilver material as the internal core and connecting this, using an ssDNA, to GQDs, which have a fluorescence localization function.
Experimental section
Materials
An ssDNA labeled with sulfhydryl, SH-DNA (5′-SHGGAGTTGGGGAGGAGG-3′), was purchased from Sangon Biotech Co., Ltd (Shanghai, China). The GQDs (XF093) were purchased from Nanjing XF NANO Materials Tech (Nanjing, China). Tris(2-carboxyethyl)phosphine (TCEP) was purchased from Sigma-Aldrich (Saint Louis, MD, USA). 1,2-Dioleoyl-3-trimethylammonium-propane chloride salt (DOTAP) and 1,2-distearoyl-sn-glycero-3-phosphoethanolamine-N-[methoxy(polyethylene glycol)-2000] (DSPE-PEG2000) were purchased from Shanghai Advanced Vehicle Technology Pharmaceutical Ltd. (Shanghai, China). 1,2-Distearoyl-sn-glycero-3-phosphoethanolamine-N-[methoxy(polyethylene glycol)-2000]-cRGD (DSPE-PEG2000-cRGD) was from Xi'an Ruixi Biological Technology Co., Ltd. (Xi'an China). The ssDNA Quantitation Kit was purchased from Invitrogen (Thermo Fisher Scientific). Paclitaxel (PTX) Injection was obtained from Jiangsu Aosaikang Pharmaceutical CO., Ltd (5 mL: 30 mg, CFDA approval number H20064300, Jiangsu, China). Silver standard storage solution (Ag, GSB 04-1712-2004, uniquely identifies: 17A039-1, 1000 mg L−1) was obtained from National Nonferrous Metals and Electronic Materials Analysis and Testing Center. Rh internal standard element (100 mg L−1) was purchased from Thermo Fisher Scientific Co., Ltd. 50 nm filter (85037-547-44) were purchased from Sartorius CO., Ltd.The human cervical cancer cell line HeLa was obtained from the Cell Bank of the Chinese Academy of Sciences (Shanghai, China). HeLa cells were cultured in DMEM (Life Technologies, Carlsbad, CA, USA) containing 10% fetal bovine serum (Life Technologies), L-glutamine (2 mM), and penicillin–streptomycin solution (40 U mL−1-each; Life Technologies). Cells were cultivated in a humidified incubator at 37 °C and under 5% CO2. The cells were harvested with 0.05% trypsin–EDTA before subculture. The cell counting kit-8 (CCK-8) was purchased from Thermo Fisher Scientific (Waltham, MA, USA). The lactate dehydrogenase (LDH) kit was purchased from Beijing solarbio science & technology Co., Ltd (Beijing, China).
The animal experiments were carried out in accordance with the Guide for the Care and Use of Laboratory Animals (National Research Council of China, Beijing, China). The study protocol was approved by the Institutional Animal Care and Use Committee of Jiangxi University of Traditional Chinese Medicine (Nanchang, China). Female BALB/c nude mice (6 weeks; 18–20 g) were provided by Hunan SJA Laboratory Animals (no: SCXK [XIANG] 2016-0002, Hunan, China). Animals were cared for in the animal laboratory center of Jiangxi University of Traditional Chinese Medicine. The animal room was well ventilated and had a regular 12 h light dark cycle throughout the experimental period.
Synthesis of silver nanoparticles (AgNPs)
In this paper, the chemical reduction method and sodium borohydride were used to deoxidize silver atoms to give AgNPs in aqueous solution. After preliminary experiments, it was determined that 30 mL of 3.3 mM sodium citrate aqueous solution and 90 mL of 6.6 mM sodium borohydride aqueous solution should be taken and mixed evenly under ice bath conditions. Then, 3.3 mM silver nitrate drops were added to the mixture, and the ice bath and stirring conditions were maintained during the dropping process. After the reaction was complete, the solution was placed in the dark overnight, to ensure that the sodium borohydride was completely decomposed. After aging, the mixture was dialyzed against a dialysis bag with a molecular weight cut off of 3500 Da, and the dialysate was changed every half hour for at least 6 h. The purpose of the dialysis was to remove some of the ions from the outside of the silver nanoparticles. After dialysis, the silver nanoparticle solution in the dialysis bag was collected for further experiments.Synthesis of ADG cores coating hybrid lipid membrane (ADG-DDPC)
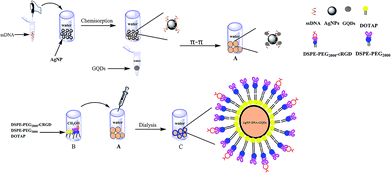
The scheme for the synthesis of the ADG cores coated with a hybrid lipid membrane (ADG-DDPC) is shown in Fig. 1.First, 20 μL of 10 mM TCEP and 20 μL of 100 μM SH-DNA were incubated for 1 h in a Britton–Robinson buffer (BR buffer, pH = 6). Then, 20 μL of SH-DNA (50 μM) was added to 6 mL of the AgNPs solution (the pH of the AgNPs solution was adjusted to neutral by adding 1.5 mL of BR buffer). The solution was incubated for about 5 min to allow the adsorption of DNA onto the AgNPs. After this, a citrate buffer (500 mM, pH = 3) was added into the AgNPs solution to reach a final concentration of 5 mM. After 5 min incubation, the same amount of citrate buffer was added into the solution again to achieve a final concentration of 10 mM citrate. After incubating for 15 min, the excess DNA was removed by centrifuging at 12![[thin space (1/6-em)]](https://www.rsc.org/images/entities/char_2009.gif) 000 rpm for 30 min and the remaining pellet was then washed three times with BR buffer. The prepared AgNP-DNA conjugates were dispersed in BR buffer for further use. Then, the AgNP-DNA was re-dispersed in BR buffer and a final concentration of 50 μg mL−1 GQDs was added. The solution was incubated at room temperature for 2 h to obtain ADG cores. After dialysis for 6 h in a dialysis bag with a molecular weight cut off of 10
000 rpm for 30 min and the remaining pellet was then washed three times with BR buffer. The prepared AgNP-DNA conjugates were dispersed in BR buffer for further use. Then, the AgNP-DNA was re-dispersed in BR buffer and a final concentration of 50 μg mL−1 GQDs was added. The solution was incubated at room temperature for 2 h to obtain ADG cores. After dialysis for 6 h in a dialysis bag with a molecular weight cut off of 10![[thin space (1/6-em)]](https://www.rsc.org/images/entities/char_2009.gif) 000 Da, the non-adsorbed GQDs were removed and used.
000 Da, the non-adsorbed GQDs were removed and used.
A hybrid phospholipids solution (200 μL) containing 6.87 mM DOTAP and 0.38 mM DSPE-PEG2000-cRGD in methanol was slowly injected into the prepared ADG cores and incubated for about 30 min at 40 °C in a water bath with gentle shaking. After the phospholipids were adsorbed onto the surface of the ADG cores, 2 mL of the obtained suspension were dialyzed for more than 8 h in the dialysate tube to ensure that the organic phase methanol was completely dialyzed. The prepared phospholipid nanoparticles were filtered through a 50 nm filter to obtain ADG-DDPC. The ADG cores coated with the hybrid lipid membrane containing DOTAP and DSPE-PEG2000 (ADG-DDP) were prepared using almost the same protocol as that of the ADG-DDPC, except that 0.43 mM of DSPE-PEG2000 was used to replace the DSPE-PEG2000-cRGD.
Characterization of ADG-DDPC
Several methods were used to characterize the preparation of ADG-DDPC.Determination of the ssDNA adsorbed by the AgNPs was performed by using an ssDNA quantitation kit Quant-iTTM OliGreen® ssDNA Kit. After the DNA was adsorbed onto the surface of AgNPs, a three-fold volume of BR buffer (pH = 3) was added, centrifuged at 12![[thin space (1/6-em)]](https://www.rsc.org/images/entities/char_2009.gif) 000 rpm for 20 min, washed five times using BR buffer, and the total ssDNA in the supernatant was measured as recommended by manufacturer.
000 rpm for 20 min, washed five times using BR buffer, and the total ssDNA in the supernatant was measured as recommended by manufacturer.
The concentration of silver nanoparticles was measured using an inductively coupled plasma mass spectrometer (ICP-MS), (Thermo Fisher Scientific). The ICP-MS was performed using the following conditions: RF power 1550 W, cooling gas 14 L min−1, auxiliary gas 0.7763 L min−1, atomization gas 1.0749 L min−1, spray chamber temperature 2.5 °C, and peristaltic pump speed 40 rpm.
The etching of the Ag in the ADG cores under H2O2 was performed by adding 200 μM H2O2 into 400 μL of BR buffer containing 180 pM of the ADG cores. The mixture was reacted for 40 min at 37 °C. Then the morphology of the ADG after H2O2 addition was observed using transmission electron microscopy (TEM).
Ultraviolet-visible absorption spectroscopy (UV-VIS) (UV-2550 spectrophotometer, Shimadzu, Japan) was used to obtain the spectroscopic characterization of ADG-DDPC. The structural characterizations of ADG-DDPC was confirmed by using a FEI Quanta 250 scanning electron microscope (SEM) (Thermo Fisher Scientific, USA), a JEM2100 electron microscopy (TEM) (JEOL Ltd., Japan) and an atomic force microscopy (AFM) images were acquired under ambient conditions using a SPM9700 AFM (Shimadzu, Japan) in the tapping mode. The particle size distributions were determined using the Nano ZS ZEN3690 (Malvern Instruments Ltd., Malvern, UK). Fluorescence detection of H2O2 were determined using the FLS980 Steady-state transient fluorescence spectrometer (Edinburgh instruments co., Ltd.)
Cell viability
The cytotoxicity of the AgNPs, GQDs, ADG-DDP and ADG-DDPC complexes against HeLa cells were assessed using the CCK-8 method. HeLa cells were seeded in 96-well plates at a density of 5 × 10³ cells per well and incubated for 24 h at 37 °C in 5% CO2. Then the culture medium was removed and fresh medium containing AgNPs, GQDs, ADG-DDP and ADG-DDPC complexes were added to each well. After 24 h of incubation, 10 μL of the CCK-8 solution was added and further incubated for 1 h. The optical density of the solution was measured at 450 nm using a Spectra-Max M3 microplate reader (Molecular Devices, CA, USA). The cell viability for each of the treated groups was calculated and normalized to control untreated cells. Each concentration was detected using six wells. The mean drug concentration for 50% inhibition of cell growth (IC50) was calculated.LDH activity
According to the instructions on the kit, the catalytic production of 1 nM pyruvate per minute 1 × 10⁴ cells or bacteria at 37 °C was defined as an enzyme activity unit. HeLa cells were seed into the 6-well plates at a density of 5 × 10⁵ cells per well and incubated for 24 h at 37 °C in 5% CO2. Cells were divided into the treated group, the control group and the standard group, and each group was set with three replicate wells at each concentration. The cells were collected into a centrifuge tube the supernatant was discarded after centrifugation, and the cells were disrupted using an ultrasonicator (ice bath, power 20%, sonication for 3 s, interval 10 s, repeated 30 times); 8000 g centrifuge for 10 min at 4 °C, the supernatant was then removed and placed on ice prior to being measured. The LDH activity in each group was obtained as recommended by the manufacturer.Cell uptake
HeLa cells were incubated with 24 ng mL−1 of ADG-DDP and ADG-DDPC for 6, 12 h in a laser confocal dish. After the incubation, the cells were washed and fixed with 4% paraformaldehyde. Finally, the cells were washed three times. The intracellular localization of ADG-DDP or ADG-DDPC was visualized using an LSM 710 confocal microscope from Zeiss (Oberkochen, Germany). The fluorescence signals of the GQDs were excited at 350 nm and detected at 425 nm, respectively. The percentages of fluorescence positive cells (fluorescence caused by released GQDs) were quantified by Image J software.In vivo antitumor activity
The in vivo antitumor activity was assessed in HeLa xenograft mice. The HeLa cells (1 × 10⁷/per mouse) were injected subcutaneously into the right anterior armpit of BALB/c nude mice. When the tumor volume reached approximately 300–400 mm3, the tumor-bearing mice were randomly divided into 4 groups (6 mice per group) and were intravenously injected with normal saline, PTX Injection (10 mg kg−1), ADG-DDP and ADG-DDPC (3.6 mg of silver equivalent per kg body weight) every two days, three times in total. The tumor volume and body weight of the mice were recorded once every two days. The tumor volume was calculated using the following formula (1):| V = (W2 × L)/2, | (1) |
Tissue analysis
The BALB/c nude mice, body weight 20–25 g, were used for tissue analysis studies after HeLa cells were implanted intradermally into the armpit for one week. Forty tumor-bearing mice were fasted overnight and randomly divided into three groups of ten mice each. GQDs (10 mg kg−1, the dose was equivalent to GQDs in the ADG-DDP and ADG-DDPC), ADG-DDP and ADG-DDPC were injected intravenously (3.6 mg of silver equivalent per kg body weight). Another ten animals were sacrificed without treatment, and their tissues were used as blank controls. The animals were decapitated in groups of three at 360 minutes, and three tumor samples per group tumor tissue were removed, and washed of residual blood, air-dried, and weighed. Tissue samples were homogenized with saline 0.2 mg mL−1, take 1 mL tissue homogenate into the microwave digestion tube and add internal standard (IS) working solution of Rh at 50 mL volumetric flask, the final concentration of IS was 50 μg L−1, then add 5 mL HNO3 (2%) solution, digest according to the microwave heating program (temperature rise 180 °C, pressure 25 bar, hold for 15 min), and transfer the liquid, using the inductively coupled plasma mass spectrometer measurement as described earlier. Take 0.1, 0.5, 1, 5, 10, 20, 50 μg L−1 of Ag standard solution and add the same volume of IS, digested as described earlier, using the inductively coupled plasma mass spectrometer measurement as described earlier.The remaining mice were sacrificed on the tenth day to take the heart, liver, spleen, lungs, kidneys, brain, and tumor tissue of BALB/c nude mice were evaluated by histology with H&E staining, in which hematoxylin stains nuclei to bluish-purple colors, and eosin stains cytoplasm and the stroma matrix to red-pink colors.
Statistical analyses
All the results except in vivo data are presented as the mean ± standard deviation (SD). The Student's t-test and one-way analysis of variance were used to evaluate significance. p < 0.05 was considered significant.Results and discussion
Characterization of ADG-DDPC
The amount of the ssDNA adsorbed onto the AgNPs was calculated by using an ssDNA quantitation kit (Quant-iT™ OliGreen® ssDNA Kit) as recommended by manufacturer, and was found to be 15.3 μg mL−1. The content of the silver element in the AgNPs was 3.75 μg mL−1 and the content of the silver element in ADG-DDP and ADG-DDPC were 20.36 μg mL−1,20.43 μg mL−1, respectively, measured using ICP-MS.As shown in Fig. 2a, AgNPs have a strong characteristic absorption peak at 400 nm, and the peak shape is narrow and symmetrical. We diluted ADG-DDPC with ultrapure water by half, and as expected, the UV absorbance ratio also decreased by half, and the position of the maximum absorption peak was unchanged (Fig. 2b). After incubation with 200 μM H2O2 in ADG for 40 min, the silver nanoparticles began to “erode” and the originally closely packed GQDs were randomly dispersed (Fig. 2c).
From the UV-VIS absorption curved of AgNPs, it indicates that the AgNPs synthesized using this method are relatively homogeneous, as when the surface has adsorbed DNA, the characteristic absorption peak of the complex is red shifted by 5 nm and the absorbance decreases, and the peak shape is more asymmetric compared to that of the AgNPs. This is due to the fact that the molecular weight of the DNA molecule (Mw, ∼5303.6 Da) is much greater than the molecular weight of the citrate (Mw, ∼185 Da), when the DNA modification is adsorbed onto the surface of the AgNPs, the refractive index of the medium around the AgNPs will increase, and the particle size range is wider than that of the AgNPs. Therefore, the adsorption modification of the DNA molecules on the surface of the AgNPs will cause the red-shift of the characteristic absorption peaks of AgNPs, and the decrease of absorbance may be due to the loss of some AgNPs during the adsorption process.62 The change in the UV characteristic peak proves that the DNA is indeed adsorbed onto the surface of the AgNPs. When the ADG cores were coated with asymmetric phospholipids, the UV absorption peaks were not significantly different from those of the AgNPs-DNA. After diluted with ultrapure water, the UV absorbance of ADG-DDPC was changed according to the dilution without shift of absorption peak, which proved that the internal particle size of the synthesized material was uniform.
When the ADG cores were treated with H2O2, the silver nanoparticles began to “erode” and the GQDs were unpacked. This underlying mechanism is probably due to the following reaction, shown in formula (2):
| Ag + H2O2 + H+ = Ag+ + ·OH + H2O | (2) |
It was proven that the AgNPs were corroded and agglomerated by H2O2, the π–π bonds of the GQDs and DNA are destroyed, the GQDs are separated from AgNPs, and the fluorescence properties are restored. Using the characteristically high levels of H2O2 in cancer cells compared to the low H2O2 content in normal cells, we can use this property for cancer treatment in order to realize the integration of diagnosis and treatment.
The morphology of AgNPs, GQDs and ADG-DDPC were viewed under AFM and TEM. It can be seen from AFM and TEM that the particle size distribution of AgNPs prepared by this method is uniform and the properties are stable (Fig. 3a1–a5, enlarged images are shown in Fig. S1†). We can see from the TEM diagram that using the ssDNA as a “bridge” is very necessary (Fig. 3c1–c2, enlarged images are shown in Fig. S3†). Without the addition of DNA, the GQDs are randomly dispersed and do not exist on the surface of the AgNPs. As we can see from the TEM diagram, after adding the DOTAP and the DSPE-PEG2000-cRGD to wrap the ADG kernel, the original random particles are transformed into the smooth particles with larger particle sizes. Using DOTAP as a cationic lipid, the particle size distribution is preferentially adsorbed onto the surface of the DNA with negative charge, thus the first step of encapsulating the core of the phospholipid is realized. In order to enable compound material to remain in vivo for a long cycle, a kind of phospholipid (DSPE-PEG2000-cRGD) was added to the outside of DOTAP by changing of the dispersing medium. This also ensures that the materials are less toxic before they reach the target site. Using the Malvern particle sizer measured the particle size of ADG-DDP and ADG-DDPC were found to be (23.8 ± 0.5) nm and (25.2 ± 0.8) nm, respectively. This shows that the addition of cRGD does not have a significant effect on the particle size of the preparation.
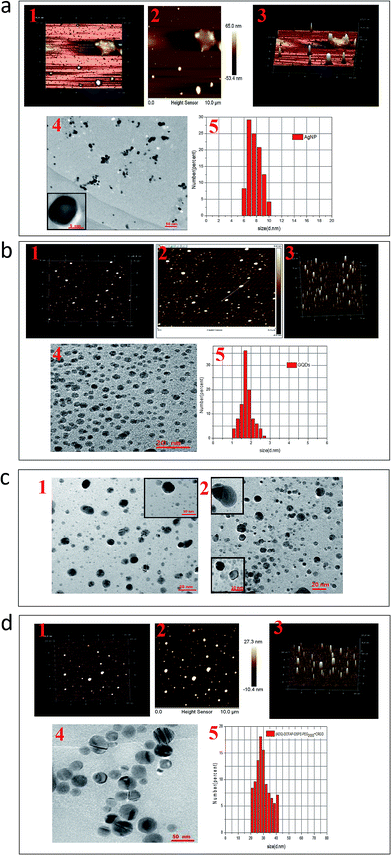 | ||
| Fig. 3 (a1) Three-dimensional AFM topography image, (a2) AFM height image, (a3) AFM three-dimensional height profile image, (a4) TEM images and (a5) size distribution of AgNPs; (b1) three-dimensional AFM topography image, (b2) AFM height image, (b3) AFM three-dimensional height profile image, (b4) TEM images and (b5) size distribution of GQDs; (c1) TEM images of physical mixture of AgNPs and GQDs and (c2) TEM images of AgNP-DNA-GQDs as squares indicate; (d1) three-dimensional AFM topography image, (d2) AFM height image, (d3) AFM three-dimensional height profile image, (d4) TEM image and (d5) size distribution of ADG-DDPC (enlarged images are shown in Fig. S1–S4†). | ||
The morphology of the particles was detected by AFM and TEM, which indicates that the nucleation process of each particle is relatively stable. In this paper, it is suggested that when DNA is adsorbed onto the surface of AgNPs by using mercapto ssDNA as a “bridge”, the refractive coefficient of the AgNPs after adsorption will decrease, and the characteristic absorption peak will be red shifted. The GQDs and ssDNA adsorbed onto the surface of the AgNPs are adsorbed by π–π bonds. The advantage of this kind of physical adsorption is that it retains the properties of the original material, and the adsorption between substances is much easier compared to that of covalent bonds. Without the addition of DNA (Fig. 3c1 and c2), the GQDs are randomly dispersed and do not exist on the surface of the AgNPs, which affirmed the necessary existence of ssDNA in ADG.
Stability of ADDG, ADG-DDP and ADG-DDPC
It is not difficult to see from Table 1 that with the prolongation of time, the phospholipid-coated ADG core is prone to aggregation, and the particle size has exceeded 100 nm at 7 h, while the particle size of ADG-DDP and ADG-DDPC did not change significantly within 48 h. This is because the ADG core is separated by phospholipids, demonstrating that the phospholipid system is stably dispersed in aqueous solution over a period of time.| 0 | 1 | 2 | 3 | 5 | 7 | 10 | 12 | 24 | 48 | |
|---|---|---|---|---|---|---|---|---|---|---|
| Size/nm | 18.78 | 23.3 | 29.93 | 53.61 | 89.12 | 104.4 | 352.2 | 378.4 | 594.9 | 832 |
| PDI | 0.332 | 0.371 | 0.516 | 0.310 | 0.521 | 0.621 | 0.519 | 0.421 | 0.668 | 0.877 |
| Size/nm | 23.88 | 23.91 | 23.91 | 23.92 | 23.94 | 24.11 | 24.51 | 24.53 | 25.65 | 27.78 |
| PDI | 0.025 | 0.013 | 0.032 | 0.132 | 0.142 | 0.035 | 0.120 | 0.113 | 0.032 | 0.246 |
| Size/nm | 25.18 | 25.18 | 25.32 | 25.34 | 25.38 | 25.38 | 26.10 | 26.21 | 27.63 | 30.33 |
| PDI | 0.035 | 0.071 | 0.121 | 0.214 | 0.105 | 0.213 | 0.189 | 0.233 | 0.310 | 0.279 |
Fluorescence detection of H2O2
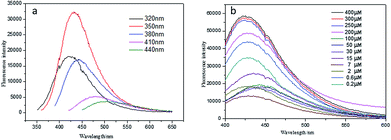
To detect H2O2, aliquots (400 μL) of BR buffer (pH = 6) containing 200 pM ADG were spiked with H2O2 (0–400 μM) and reacted at 37 °C for 40 min. Then, the fluorescence was measured under excitation at 350 nm. Fig. 4a shows the emission spectra of GQDs at different excitation wavelengths. It can be seen from the figure that the maximum emission wavelength of the GQDs is 425 nm under excitation light of 350 nm. Fig. 4b shows the fluorescent spectra of ADG in the presence of variable concentrations of H2O2. The ADG nanocomposite exhibited weak fluorescence in the absence of H2O2. However, the fluorescence intensity around 425 nm gradually enhanced upon increasing H2O2 addition. A good linearity concentration was raised from 2.0 to 400 μM, deriving a detection limit of 0.2 μM. The results indicate that our constructed ADG nanocomposite is appropriate for highly sensitive quantification of H2O2 in aqueous solution.Cell viability and LDH activity
Different concentrations of AgNPs and GQDs dispersions were added to HeLa cells and incubated for 24 h. As shown in Table 2, the AgNPs showed a strong toxicity in HeLa cells with an IC50 value of 347.78 ng mL−1, while GQDs showed no cytotoxicity below 150 μg mL−1. This is consistent with what we expected to achieve. Both the ADG-DDP and ADG-DDPC had the effect of killing the HeLa cells in a certain concentration range, and the killing effect was dose-dependent.| Preparations | IC50 (ng mL−1) |
|---|---|
| GQDs | <150 × 103 |
| AgNPs | 347.78 ± 0.06 |
| ADG-DDP | 270.85 ± 0.07 |
| ADG-DDPC | 209.68 ± 0.09 |
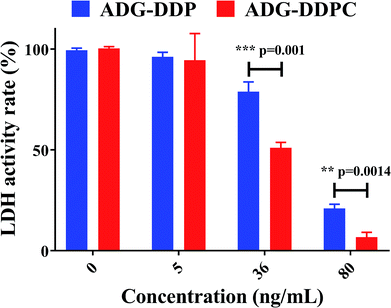
Upon addition of DSPE-PEG2000-cRGD, ADG-DDPC exhibited a lower IC50 compared to that of ADG-DDP, which was consistent with the results of the LDH activity of the ADG-DDP- or ADG-DDPC-treated group (Fig. 5). In order to allow the rapid growth and reproduction of tumors, tumor cells often have a high glucose uptake and possess the ability to convert glucose into lactic acid.63 LDH is a key enzyme in glycolysis, which catalyzes the terminal steps of anaerobic glycolysis to deoxidize pyruvic acid by catalyzing the reversible reaction between pyruvic acid and lactic acid, with this NAD+/NADH interconversion.64 The activity of LDH can be used as a marker of the level of glycolysis level. The activity of LDH was calculated after equal amounts of ADG-DDP and ADG-DDPC were incubated in the cells for 24 h at 37 °C in 5% CO2. At the same dose, the intracellular LDH activity of the ADG-DDPC group was significantly lower than that of the ADG-DDP group, indicating that the glycolytic pathway of the cells was significantly inhibited after adding ADG-DDPC.
It has been found that nano-silver has a strong cytotoxicity against many cancer cells, which proves that AgNPs have a realistic basis as an anti-tumor preparation. However, there is no definitive conclusion as to how nanosilver produces cancer cell toxicity. Based on this characteristic, AgNPs and H2O2 could react to release highly toxic silver ions in the tumor cells, and the released silver ions could bind to enzymes in the respiratory chain, inhibit the synthesis of adenosine triphosphate. In addition, the generated silver ions could also bind to the base pair of DNA generated within the cell, inhibiting DNA replication and amplification, and blocking the most essential part of cell proliferation.
Cell uptake
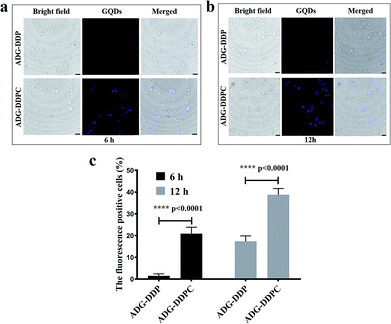
ADG-DDP and ADG-DDPC (24 ng mL−1) were added to HeLa cells and incubated for 6, 12 h at 37 °C in 5% CO2, and GQDs in both phospholipids were emitted. Intensity of fluorescence, and with the prolongation of incubation time, the intensities of ADG-DDPC were more obvious, cRGD-added phospholipid material more easily into the cell. On the one hand, due to the presence of H2O2 in tumor cell, the DNA in the phospholipid material is “eroded”, releasing fluorescent quenched GQDs and restoring its fluorescence, this result is consistent with expectations. With the prolongation of incubation time, the fluorescence intensities of ADG-DDPC were more obvious (Fig. 6a and b, enlarged images are shown in Fig. S5†). The percentages of cells exhibiting fluorescence were indicated by the fluorescence of released GQDs in cells and quantified in Fig. 6c. The results indicated that in the safe dose range, cRGD-modified nanoparticles were more easily taken up into these cells and the ADG cores were unpacked to release GQDs, which was consistent with the lower IC50 and LDH activity measured in the ADG-DDPC group in Table 2 and Fig. 5.From the cell uptake experiments, we can see that the intracellular fluorescence intensity of the nanomaterials containing DSPE-PEG2000-cRGD is more obvious when compared with that of the ADG-DDP, that is, the luminescence efficiency of the GQDs is higher. This may be due to the fact that the nanomaterials containing the transmembrane peptide cRGD can enter the tumor cells more quickly and therefore the fluorescence recovery of the GQDs is faster.65
HeLa cells were incubated with ADG-DDP or ADG-DDPC for 6 h and 12 h individually and it was observed that ADG-DDPC was more easily uptaken by cells and could release GQDs from ADG under H2O2. Because tumor cells metabolize much faster than normal cells, the amount of hydrogen peroxide produced in the cells is also higher than that in normal cells. It is reported that the content of H2O2 in tumor cells can reach 10–50 μM.66 Based on this feature, AgNPs and H2O2 after the following reaction occurs in the tumor cells, the highly toxic silver ions are released, and the released silver ions can bind to the enzymes in the respiratory chain, uncoupling the respiratory chain, inhibiting the synthesis of adenosine triphosphate (ATP), thereby making the cancer cells cannot proliferate normally. In the presence of the target H2O2, H2O2 corrodes the silver nanoparticles, reduces the absorption intensity of the silver nanoparticles, and weakens the energy transfer between the AgNPs and the GQDs, thereby recovering the fluorescence of the GQDs.
Anti-tumor growth effect
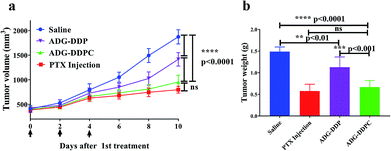
Based on the favorable capability of inducing apoptosis, an in vivo therapeutic efficacy study was performed to assess the potentials of ADG-DDP or ADG-DDPC for inhibiting tumor growth. It can be seen that ADG-DDP, ADG-DDPC and PTX injection could suppress tumor growth (Fig. 7a) and the average of tumor growth inhibition rates for ADG-DDP, ADG-DDPC and PTX Injection were calculated to be 24.8, 50.9, and 57.7%, respectively, according to the tumor weight (Fig. 7b). As the high toxicity of anticancer drugs usually leads to a reduction in body weight and necrosis in organs, the body weight of the PTX Injection group showed a slightly decreasing trend, whereas little effect on body weight was observed in the ADG-DDPC group (data not shown).Taking all of these results into consideration, ADG-DDPC, as a new multifunctional nano-preparation, has a good effect in inhibiting tumors and is less toxic than commercially available PTX Injections. In the novel ADG-DDPC nanoparticle preparations, each component could contribute to some degree to the outstanding efficacy on tumor inhibition. Targeted phospholipids can circulate in mice tumor for a prolonged time. When cRGD recognizes tumor cells and binds to the tumor cell surface receptors, the nanomaterials are brought into the cells by endocytosis. Owing to the higher concentration of H2O2 inside the tumor cells, the AgNPs entering the cell are dissolved, and the silver ions are released, When the AgNPs are etched, GQDs are released, thereby achieving the purpose of the design, that is, antitumor property.
Tissue analysis in BALB/c nude mice
H&E staining of the PBS, GQDs, ADG-DDP and ADG-DDPC groups did not show obvious kidney injury, pulmonary toxicity, cardiac damage, or inflammatory infiltrates in the spleen (Fig. 8). The control tumor had many mitotic figures, showing the high mitotic activity of tumor cells.67 Tumors that were treated with ADG-DDPC experienced a dramatic decrease in the number of mitotic figures, and exhibited more basophilic and uniform nuclei.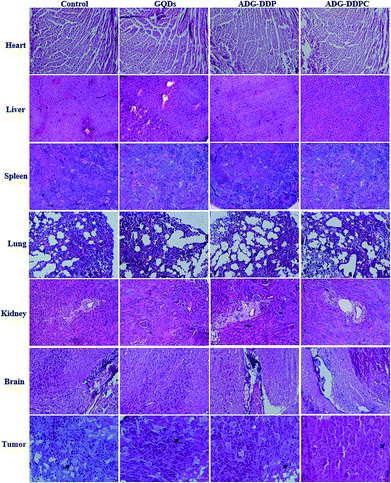 | ||
| Fig. 8 H&E staining of major organs (10×) and tumors (20×) of groups treated with GQDs, ADG-DDP and ADG-DDPC groups. Arrows indicate the presence of spindle-shaped cells. | ||
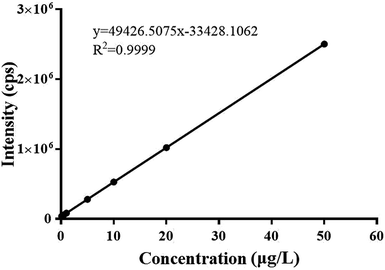
The standard curve of silver elemental solution are shown in the Fig. 9, the correlation coefficient is equal to 0.9999, indicating that silver elemental have a good linear relationship.
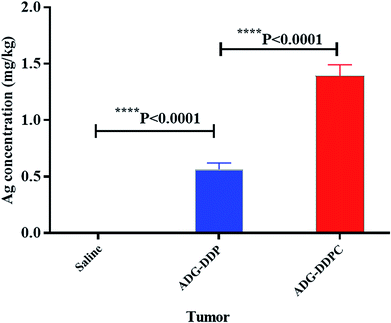
The results of silver content determination in the tumor are shown in the Fig. 10. Silver was not detected in the saline group, and the intratumoral silver content in the ADG-DDPC group was significantly higher than that in the ADG-DDP group, indicating that the cRGD could be better transported the nanosilver into the tumor.
Conclusions
Using the ssDNA as a “bridge”, AgNPs were connected to non-toxic luminescent materials GQDs to form a core, which were encapsulated by non-toxic hybrid phospholipid membrane which have a long circulation time in vivo and the ability of tumor targeting. This study presented a novel nanometer preparation of ADG-DDPC that can inhibit the growth of tumor cells and emit light within tumor cells.Conflicts of interest
There are no conflicts to declare.Acknowledgements
The authors thank the National Natural Science Fund of China (81560575, 81760639, 81603054 and 81373347), the Project funded by Jiangxi Province Postdoctoral Science Foundation (2016KY08), the Natural Science Fund of Jiangxi Province (20171BAB215066, 20171ACB21074), the Jiangxi Province Outstanding Young Talents Program (20162BCB23034, 20171BCB23097), Young Jinggang Scholar of Jiangxi Province (Jing Zhang), “1050” Youth Talent Project of Jiangxi University of Traditional Chinese Medicine (Jing Zhang), Jiangxi BaiQianWan Talents Program (Xiang Li), the Project funded by China Postdoctoral Science Foundation (2016M602084), the Project funded by Jiangxi Provincial Health and Family Planning Commission (2016A008), the Fund for First-Rate Discipline of Chinese Materia Medica (JXSYLXK-ZHYAO055, JXSYLXK-ZHYAO056, JXSYLXK-ZHYAO019) and the Youth Foundation of Jiangxi Provincial Education Department (GJJ170748) for financial support.References
- H. Long, G. Li, X. Wen, M. Zhang, Y. Wei, W. Xie, P. Zhong and L. Pang, Gene, 2018, 678, 270–279 CrossRef CAS.
- S. Conti, A. Vexler, L. Hagoel, L. Kalich-Philosoph, B. W. Corn, N. Honig, N. Shtraus, Y. Meir, I. Ron, I. Eliaz and S. Lev-Ari, Integr. Cancer Ther., 2018, 17, 1225–1234 CrossRef CAS.
- M. Thomsen and L. Vitetta, Integr. Cancer Ther., 2018, 17, 1027–1047 CrossRef PubMed.
- P. Thankamony, R. Chandar, J. Kattoor and R. K. Nair, J. Pediatr. Adol. Gynec., 2018, 31, 629–631 CrossRef PubMed.
- Y. Wang, Q. Lei, Z. Yan, C. J. Shen and N. Wang, Biochem. Pharmacol., 2018, 155, 510–523 CrossRef CAS PubMed.
- S. Liu, W. J. Song, F. S. Liu, J. W. Zhang and S. Q. Zhu, Exp. Eye Res., 2018, 172, 144–151 CrossRef CAS.
- J. Y. Lee, S. J. Chung, H. J. Cho and D. D. Kim, Biomaterials, 2016, 85, 218–231 CrossRef CAS PubMed.
- M. Green, J. Cunningham, D. O'Connell and G. Garvey, Aust. Health Rev., 2017, 41, 231–233 CrossRef PubMed.
- Y. Song, W. Li, S. Y. Meng, W. Zhou, B. Su, L. Tang, Y. M. Zhao, X. Y. Wu, D. Z. Yin, M. X. Fan and C. C. Zhou, Nanoscale Res. Lett., 2018, 13, 1–9 CrossRef CAS PubMed.
- W. P. He, J. Frueh, Z. W. Wu and Q. He, Langmuir, 2016, 32, 3637–3644 CrossRef CAS PubMed.
- I. K. Kyriakou, K. Mavridis, D. P. Kalogianni, T. K. Christopoulos, P. C. Ioannou and A. Scorilas, Anal. Bioanal. Chem., 2018, 410, 971–980 CrossRef CAS PubMed.
- N. Dong, M. Y. Dong, A. T. Zhao, Q. J. Zhu, Z. Tao and Y. Zhao, Sci. China: Chem., 2010, 53, 2304–2310 CrossRef CAS.
- M. F. Dias, B. C. P. Figueiredo, J. Teixeira-Neto, M. C. A. Guerra, S. L. Fialho and C. A. Silva, Biomed. Pharmacother., 2018, 103, 1107–1114 CrossRef CAS PubMed.
- E. M. Mastria, L. Y. Cai, M. J. Kan, X. H. Li, J. L. Schaal, S. Fiering, M. D. Gunn, M. W. Dewhirst, S. K. Nair and A. Chilkoti, J. Controlled Release, 2018, 269, 364–373 CrossRef CAS PubMed.
- Z. S. Qian, X. Y. Shan and L. J. Chai, J. Nanoscale., 2014, 6, 5671–5674 RSC.
- O. V. Sedelnikova, C. P. Ewels, L. G. Bulusheva and A. V. Okotrub, J. Struct. Chem., 2018, 59, 870–876 CrossRef CAS.
- B. Oh and C. H. Lee, Pharm. Res., 2016, 33, 2736–2747 CrossRef CAS PubMed.
- P. Huang, J. J. Shi, M. Zhang, X. H. Jiang, H. X. Zhong, Y. M. Ding, X. Cao, M. Wu and J. Lu, J. Phys. Chem. Lett., 2016, 7, 2888–2892 CrossRef CAS PubMed.
- G. Battogtokh and Y. Tag, J. Controlled Release, 2016, 234, 10–20 CrossRef CAS PubMed.
- Z. S. Qian, X. Y. Shan, L. J. Chai, J. J. Ma, J. R. Chen and H. Feng, Biosens. Bioelectron., 2014, 60, 64–70 CrossRef CAS PubMed.
- M. A. Ribas, A. K. Singh, P. B. Sorokin and B. I. Yakobson, Nano Res., 2011, 4, 143–152 CrossRef CAS.
- H. Hu, L. Xiong, J. Zhou, F. Y. Li, T. Y. Cao and C. H. Huang, et al., J. Chemistry., 2009, 15, 3577 CrossRef CAS PubMed.
- J. S. Klein, G. S. Mitchell and S. R. Cherry, Phys. Med. Biol., 2017, 62, 4183 CrossRef CAS PubMed.
- F. Musumeci, L. A. Applegate, G. Privitera, A. Scordino, S. Tudisco and H. Niggli, J. Photochem. Photobiol., B, 2005, 79, 93–99 CrossRef CAS PubMed.
- B. M. Seddon, D. J. Honess, B. Vojnovic, G. M. Tozer and P. Workman, J. Radiat. Res., 2001, 155, 837 CrossRef CAS.
- B. P. Aduev, G. M. Belokurov, D. R. Nurmukhametov and N. V. Nelyubina, Combust., Explos. Shock Waves, 2012, 48, 361–366 CrossRef.
- X. L. Cao, M. Tang, F. Liu, Y. Y. Nie and C. S. Zhao, Colloids Surf., B, 2010, 81, 555–562 CrossRef CAS PubMed.
- L. Deng, X. Y. Ouyang, J. Y. Jin, C. Ma, Y. Jiang, J. Zheng, J. S. Li, Y. H. Li, W. H. Tan and R. H. Yang, Anal. Chem., 2013, 85, 8594–8600 CrossRef CAS PubMed.
- A. Karolak, V. C. Estrella, A. S. Huynh, T. G. Chen, J. Vagner, D. L. Morse and K. A. Rejniak, Sci. Rep., 2018, 8, 36–38 CrossRef PubMed.
- J. K. Patra and K. H. Baek, Int. J. Nanomed., 2016, 11, 4691–4705 CrossRef CAS PubMed.
- D. C. Emerson, D. F. Luiz Francisco Poli, P. O. José, M. S. Marcelo, D. O. Roberto Angelo, F. F. Fabiane, S. M. Valeria, Z. Valtencir, S. L. Anna Sara and F. C. Silvia, J. Nanobiotechnol., 2015, 13, 64 CrossRef PubMed.
- V. Singh and S. Ahmad, Cellulose, 2012, 19, 1759–1769 CrossRef CAS.
- M. R. C. Sytu and D. H. Camacho, J. Bionanosci., 2018, 8, 835–844 CrossRef.
- X. Chen and H. J. Schluesener, Toxicol. Lett., 2008, 176, 1–12 CrossRef CAS PubMed.
- O. Choi and Z. Hu, Environ. Sci. Technol., 2008, 42, 4583–4588 CrossRef CAS.
- R. K. Thapa, J. H. Kim, J. H. Jeong, J. H. Jeong, B. S. Shin, H. G. Choi, C. S. Yong and J. O. Kim, Colloids Surf., B, 2017, 153, 95–103 CrossRef CAS PubMed.
- D. Sandhanasamy, A. Mohamad, V. Radhakrishnan, A. Akram, A. Nehad, A. Musaad, M. Kadarkarai, S. Shaban, N. Marcello and B. Giovanni, J. Cluster Sci., 2017, 28, 595–605 CrossRef.
- C. Pimentel, R. Guadalupe, R. B. Viviana, M. M. S. Eduardo, G. G. Consuelo and H. Juan Paulo, J. Biomater. Sci., Polym. Ed., 2016, 27, 218–234 CrossRef PubMed.
- S. A. Sadat Shandiz, A. M. Shafiee, D. Shahbazzadeh, A. Assadi, C. R. Ahangari, V. Asgary and S. Salehi, Artif. Cells, Nanomed., Biotechnol., 2017, 45, 1–10 CrossRef PubMed.
- R. G. Saratale, H. S. Shin, G. Kumar, G. Benelli, D. S. Kim and G. D. Saratale, Artif. Cells, Nanomed., Biotechnol., 2018, 46, 211–222 CrossRef CAS PubMed.
- Z. Ge, Q. Chen, K. Osada, X. Liu, T. A. Tockary, S. Uchida, A. Dirisala, T. Ishii, T. Nomoto, K. Toh, Y. Matsumoto, M. Oba, M. R. Kano, K. Itaka and K. Kataoka, Biomaterials, 2014, 35, 3416–3426 CrossRef CAS PubMed.
- M. K. Hossain, H. Y. Cho, K. J. Kim and J. W. Choi, Sci. Adv. Mater., 2014, 6, 2491–2495 CrossRef CAS.
- J. A. Jacob and A. Shanmugam, Colloids Surf., B, 2015, 136, 1011–1016 CrossRef CAS PubMed.
- N. Miura and Y. Shinohara, Biochem. Biophys. Res. Commun., 2009, 390, 733–737 CrossRef CAS PubMed.
- M. Jha, N. G. Shimpi and S. S. Sonawane, J. Genet. Eng. Biotechnol., 2018, 16, 115–124 CrossRef PubMed.
- H. Y. Xu, F. Qu, H. Xu, W. H. Lai, Y. A. Wang, Z. P. Aguilar and H. Wei, BioMetals, 2012, 25, 45–53 CrossRef CAS PubMed.
- A. Ivask, O. Bondarenko and N. Jepihhina N, Anal. Bioanal. Chem., 2010, 398, 701–716 CrossRef CAS PubMed.
- D. Nandita and R. Chidambaram, Environ. Chem. Lett., 2016, 14, 477–485 CrossRef.
- A. R. Lee, S. J. Lee, M. Lee, M. Y. Nam, S. Lee, J. Choi, H. J. Lee, D. U. Kim and K. L. Hoe, Toxicol. Sci., 2018, 161, 171–185 CrossRef CAS PubMed.
- A. Rinna, Z. Magdolenova, A. Hudecova, M. Kruszewski, M. Refsnes and M. Dusinska, Mutagenesis, 2015, 30, 59–66 CrossRef CAS PubMed.
- C. A. Verónica, A. Sungeun, Y. S. Shakina, W. Chao, M. Ramya and C. Y. Deok, In Vitro Cell. Dev. Biol.: Anim., 2016, 52, 1012–1019 CrossRef PubMed.
- H. Margarita, R. Gonzalo, J. M. P. Raul, V. G. R. Jose, D. Concepcion and S. Paz, Nanoscale Res. Lett., 2012, 7, 364 CrossRef PubMed.
- D. W. Guo, D. D. Dou, L. Ge, Z. H. Huang, L. P. Wang and N. Gu, Colloids Surf., B, 2015, 134, 229–234 CrossRef CAS PubMed.
- Z. Huang, F. Pu, Y. Lin, J. Ren and X. Qu, Chem. Commun., 2011, 47, 3487–3489 RSC.
- T. Hada and Y. Sakurai, Pharmaceutics, 2015, 7, 320–333 CrossRef CAS PubMed.
- B. Dicheva, T. Hagen, A. Seynhaeve, M. Amin, A. Eggermont and G. Koning, Pharm. Res., 2015, 32, 3862–3876 CrossRef CAS PubMed.
- S. He, B. Cen, L. Liao, Z. Wang, Y. X. Qin, Z. M. Wu, W. J. Liao, Z. Y. Zhang and A. M. Ji, Drug Delivery, 2017, 24, 471–481 CrossRef CAS PubMed.
- J. Hedhli, S. L. L. Slania, A. Pska, A. Czerwinski, C. J. Konopka, M. Wozniak, M. Banach, I. T. Dobrucki, L. Kalinowski and L. W. Dobrucki, Sci. Rep., 2018, 8, 5401 CrossRef PubMed.
- G. B. Braun, K. N. Sugahara, O. M. Yu, V. R. Kotamraju, T. Molder, A. M. Lowy, E. Ruoslahti and T. Teesalu, J. Controlled Release, 2016, 232, 188–195 CrossRef CAS PubMed.
- P. F. Liu, L. B. Qin, Q. Wang, Y. Sun, M. J. Zhu, M. Shen and Y. R. Duan, Biomaterials, 2012, 33, 6739 CrossRef CAS PubMed.
- M. Amin, A. Badiee and M. R. Jaafari, Int. J. Pharm., 2013, 458, 324–333 CrossRef CAS PubMed.
- X. Zhang, M. R. Servos and J. W. Liu, Chem. Commun., 2012, 48, 10114–10116 RSC.
- Z. Guo, J. Jia, M. Yao, J. Kang, Y. Wang, X. Yan, L. Zhang, Q. Lv, X. Chen and F. Lu, Exp. Cell Res., 2018, 373, 211–220 CrossRef CAS.
- L. Yang, D. Wang, X. T. Wang, Y. P. Lu and L. Zhu, Biochem. Biophs. Res. Commun., 2018, 507, 128–135 CrossRef CAS PubMed.
- C. D. Jorge, V. G. Juan, H. M. Fernando, C. S. Lionel, L. S. Juan, N. V. Juanita, M. H. Francisco, K. P. Rodrigo, C. F. Clemencia, B. G. Margarita, R. E. Ivonne and F. O. Maritza, Rev. Chil. Obstet. Ginecol., 2008, 73, 308–312 Search PubMed.
- Z. Wu, Y. Wang, X. Meng, X. Wang, Z. Li, S. Qian, Y. Wei, L. Shu, Y. Ding, P. Wang and Y. Peng, Int. J. Mol. Med., 2018, 42, 3157–3170 CAS.
- A. Goel and H. Goel, J. Indian Soc. Pedod. Prev. Dent., 2011, 29, S61–S65 CrossRef CAS PubMed.
Footnotes |
| † Electronic supplementary information (ESI) available. See DOI: 10.1039/c9ra01381d |
| ‡ These authors contributed equally to the work. |
| This journal is © The Royal Society of Chemistry 2019 |

