 Open Access Article
A ratiometric and colorimetric probe for detecting Hg2+ based on naphthalimide–rhodamine and its staining function in cell imaging †
Yuesong Wang,
Haichang Ding,
Shuai Wang,
Congbin Fan ,
Yayi Tu,
Gang Liu
 * and
Shouzhi Pu*
Jiangxi Key Laboratory of Organic Chemistry, Jiangxi Science and Technology Normal University, Nanchang, Jiangxi 330013, PR China. E-mail: liugang0926@163.com; pushouzhi@tsinghua.org.cn; Fax: +86-791-83831996; Tel: +86-791-83831996
First published on 15th April 2019
Abstract
In this work, a rhodamine derivative was developed as a colorimetric and ratiometric fluorescent probe for Hg2+. It exhibited a highly sensitive fluorescence response toward Hg2+. Importantly, studies revealed that the probe could be used for ratiometric detection of Hg2+, with a low detection limit of 0.679 μM. The mechanism of Hg2+ detection using compound 1 was confirmed by ESI-MS, 1H NMR, and HPLC. Upon the addition of Hg2+, the rhodamine receptor was induced to be in the ring-opening form via an Hg2+-promoted hydrolysis of rhodamine hydrazide to rhodamine acid. In addition to Hg2+ detection, the naphthalimide–rhodamine compound was proven to be effective in cell imaging.
Introduction
Fluorescent probes have become powerful tools for the detection of heavy metal ions due to their low cost, high selectivity, and low concentration.1–5 Among heavy metal ions, Hg2+ is one of the most troublesome ions because it easily goes through the biofilm, and then causes serious damage to the central nervous and endocrine systems.6–10 In view of this, the synthesis of probes to identify Hg2+ has attracted sustained attention. So far, studies on Hg2+ probes have been mainly focused on using fluorescence intensity as an identifying signal.11–15 However, these intensity-based probes have a range of disadvantages because intrinsic and extrinsic factors may affect the measurement of fluorescence intensity during the test.Among fluorescent probes, the ratiometric fluorescent probe is designed to decrease the impact of these limitations.16–20 Especially, probes based on fluorescent resonance energy transfer (FRET) have been increasingly studied.21–23 FRET mechanism is interpreted as an interchange of energy between two excited fluorophore in which the donor power of excitation state is migrated to a non-radiative receptor unit. Well overlapped is superior to that of the sole fluorophore to achieve ratiometric change. This method demonstrates the ratiometric change in emission intensity of two different wavelengths, providing a synchronous recording of the ratio signal, which could provide self-modification of environmental impacts and afford an easy way to visualize complicated biologic procedures at the molecular level.24–27 For example, Qian28 et al. exploited a BODIPY–rhodamine probe for detecting Hg2+ on the ppb degree under physiological standards, which displays the non-interference and the same intensity of the emission bands. In order to validate the FRET process, the spectra of donor emission and acceptor absorption need to be well overlapped, which limits the layout and advancement of these probes. Therefore, it is imperative to construct a new ratiometric fluorescent probe to mitigate the limitations.
As a classic fluorophore, rhodamine-based fluorescent probes have been attracting increasing interests in the field of ion detection because of the high fluorescent quantum yield and long wavelength emission. Rhodamine materials are ideal candidates as energy receptors in the FRET system.29–36 Besides rhodamine, naphthalimide is also a versatile fluorophore with easy manipulability, admirable stability and large stokes shift. The fluorescence emission of naphthalimide ranges from 470 nm to 570 nm, which overlaps with the absorption of rhodamine. It is promising to obtain ratiometric probe by connecting rhodamine and naphthalimide based on the FRET mechanism.
In this work, a fluorescent probe 1 with naphthalimide group as the energy donor and rhodamine as the energy acceptor was successfully designed and synthesized. The probe displayed a highly selective and sensitive detection for Hg2+ in CH3CN–H2O (7/3, v/v) solution.
Experimental
Materials and apparatus
4-Bromo-1,8-naphthalic, morpholine, 2-methoxyethanol, ethylenediamine, chloroacetyl chloride, trimethylamine, hydrazine monohydrate, benzotriazol-1-yloxytris(dimethylamino)phosphonium hexafluorophosphate, and anhydride were bought from Innochem (Beijing, China). The other reagents were purchased from J&K Chemicals. All reagents were analytical level and employed without further purification. Nitrate salts of metal ions (Cd2+, Ni2+, Co2+, Ba2+, Ca2+, Pb2+, Fe3+, Cu2+, Mg2+, Mn2+, Zn2+, K+, Sr2+, Cr3+, Al3+, Ag+) and the perchlorate salt of Hg2+ were used for appraising the combining capacity of ions to compounds. Deionized water was applied to the entire experiment.1H and 13C NMR spectra were obtained on a Bruker AV400 NMR spectrometer using CD2Cl2 as the solvent and tetramethylsilane (TMS) as an internal reference. Mass spectrometry was conducted on an Agilent 1100 ion trap MSD spectrometer. HPLC spectra were taken on an Agilent 1260. An Agilent UV-8454 spectrophotometer was applied to the absorption measurements. The fluorescence spectra were collected using a Hitachi F-4500 fluorescence spectrophotometer. The melting points were determined by a WRS-1B melting point apparatus. The staining of cells was performed using an OLYMPUS FV1000 confocal laser scanning microscope. The fluorescence quantum yield value was recorded by a machine named QY C11347-11.
Methods
A mixture of 1 (1.0 × 10⁻³ mol L−1) was ready in 2.0 mL CH3CN–H2O (7/3, v/v) solution, which was used for the fluorescence and absorption studies with proper concentration of metal ions at room temperature. The detection experiments of metal ions were gained by adding 5.0 eq. metal ions into 2.0 mL CH3CN–H2O (7/3, v/v) solution of 1 (2.0 × 10⁻⁵ mol L−1). The excitation and emission slit of fluorescence measurements were carried out with 5 nm and 10 nm (λex = 410 nm).Synthesis
The synthetic route for 1 was shown in Scheme 1. Compound 2 was obtained from commercial suppliers, and compound 3, 4, 5 and 6 were synthesized by the composited methods.37,38![[thin space (1/6-em)]](https://www.rsc.org/images/entities/char_2009.gif) :
:![[thin space (1/6-em)]](https://www.rsc.org/images/entities/char_2009.gif) 1, v/v) as eluent, and then gained compound 7 (0.48 g, 0.60 mmol) as red solid in 38%. Mp 447–449 K; 1H NMR (400 Hz, CD2Cl2), δ (ppm): 8.54 (d, J = 8.0 Hz, 1H), 8.45 (t, J = 6.0 Hz, 2H), 7.99 (d, J = 8.0 Hz, 1H), 7.70 (t, J = 8.0 Hz, 2H), 7.64 (d, J = 8.0 Hz, 1H), 7.60 (d, J = 8.0 Hz, 1H), 7.19 (d, J = 8.0 Hz, 2H), 6.63 (t, J = 8.0 Hz, 2H), 6.55 (t, J = 10.0 Hz, 2H), 6.47 (s, 1H), 6.38 (d, J = 8.0 Hz, 1H), 4.37 (t, J = 4.0 Hz, 2H), 3.94 (s, 4H), 3.65–3.63 (m, 2H), 3.41–3.36 (m, 4H), 3.21 (d, J = 16.0 Hz, 8H), 2.93 (s, 2H), 2.58 (s, 4H), 1.18 (t, J = 8.0 Hz, 6H) (Fig. S1†); 13C NMR (100 MHz, CD2Cl2), δ (ppm): 169.32, 168.60, 163.93, 163.48, 155.36, 152.47, 152.13, 149.10, 133.87, 131.87, 130.36, 129.75, 129.26, 128.67, 128.06, 127.84, 126.89, 125.49, 125.07, 123.99, 123.29, 122.35, 115.85, 114.22, 110.62, 109.11, 107.73, 104.99, 101.02, 96.84, 66.10, 60.60, 47.45, 43.76, 38.45, 37.51, 28.93, 11.55 (Fig. S2†); ESI-MS (m/z): 821.2 ([M7]+), calculated for C48H49N6O7: 821.3 (Fig. S3†).
1, v/v) as eluent, and then gained compound 7 (0.48 g, 0.60 mmol) as red solid in 38%. Mp 447–449 K; 1H NMR (400 Hz, CD2Cl2), δ (ppm): 8.54 (d, J = 8.0 Hz, 1H), 8.45 (t, J = 6.0 Hz, 2H), 7.99 (d, J = 8.0 Hz, 1H), 7.70 (t, J = 8.0 Hz, 2H), 7.64 (d, J = 8.0 Hz, 1H), 7.60 (d, J = 8.0 Hz, 1H), 7.19 (d, J = 8.0 Hz, 2H), 6.63 (t, J = 8.0 Hz, 2H), 6.55 (t, J = 10.0 Hz, 2H), 6.47 (s, 1H), 6.38 (d, J = 8.0 Hz, 1H), 4.37 (t, J = 4.0 Hz, 2H), 3.94 (s, 4H), 3.65–3.63 (m, 2H), 3.41–3.36 (m, 4H), 3.21 (d, J = 16.0 Hz, 8H), 2.93 (s, 2H), 2.58 (s, 4H), 1.18 (t, J = 8.0 Hz, 6H) (Fig. S1†); 13C NMR (100 MHz, CD2Cl2), δ (ppm): 169.32, 168.60, 163.93, 163.48, 155.36, 152.47, 152.13, 149.10, 133.87, 131.87, 130.36, 129.75, 129.26, 128.67, 128.06, 127.84, 126.89, 125.49, 125.07, 123.99, 123.29, 122.35, 115.85, 114.22, 110.62, 109.11, 107.73, 104.99, 101.02, 96.84, 66.10, 60.60, 47.45, 43.76, 38.45, 37.51, 28.93, 11.55 (Fig. S2†); ESI-MS (m/z): 821.2 ([M7]+), calculated for C48H49N6O7: 821.3 (Fig. S3†).![[thin space (1/6-em)]](https://www.rsc.org/images/entities/char_2009.gif) :
:![[thin space (1/6-em)]](https://www.rsc.org/images/entities/char_2009.gif) 1, v/v) as the eluent, and then obtained target compound 1 (0.12 g, 0.14 mmol) as yellow solid in 93% yield. Mp 456–458 K; 1H NMR (400 MHz, CD2Cl2), δ (ppm): 8.55 (d, J = 8.0 Hz, 1H), 8.48 (d, J = 8.0 Hz, 1H), 8.45 (d, J = 8.0 Hz, 1H), 7.87–7.89 (m, 1H), 7.71 (t, J = 8.0 Hz, 1H), 7.56 (s, 1H), 7.50–7.48 (m, 2H), 7.23 (d, J = 8.0 Hz, 1H), 7.07–7.05 (m, 1H), 6.64 (s, 1H), 6.53 (d, J = 8.0 Hz, 1H), 6.51 (d, J = 4.0 Hz, 1H), 6.47 (s, 1H), 6.45 (s, 1H), 6.34 (d, J = 8.0 Hz, 1H), 4.38 (t, J = 6.0 Hz, 2H), 3.95 (t, J = 4.0 Hz, 4H), 3.71 (s, 2H), 3.67–3.62 (m, 2H), 3.39–3.34 (m, 4H), 3.24 (t, J = 4.0 Hz, 4H), 3.18 (s, 4H), 2.94 (s, 2H), 2.59 (s, 4H), 1.17 (t, J = 6.0 Hz, 6H) (Fig. S4†); 13C NMR (100 MHz, CD2Cl2), δ (ppm): 169.38, 165.15, 163.91, 163.44, 155.33, 152.90, 152.73, 151.45, 150.93, 148.33, 131.81, 131.71, 130.35, 129.71, 127.51, 127.18, 125.07, 122.82, 122.04, 115.95, 114.24, 110.73, 108.60, 107.60, 104.10, 101.57, 97.25, 66.12, 64.64, 60.65, 47.60, 43.65, 38.45, 37.44, 11.60 (Fig. S5†); ESI-MS (m/z): 835.2 ([M1 + H+]+), calculated for C48H50N8O6: 834.3 (Fig. S6†).
1, v/v) as the eluent, and then obtained target compound 1 (0.12 g, 0.14 mmol) as yellow solid in 93% yield. Mp 456–458 K; 1H NMR (400 MHz, CD2Cl2), δ (ppm): 8.55 (d, J = 8.0 Hz, 1H), 8.48 (d, J = 8.0 Hz, 1H), 8.45 (d, J = 8.0 Hz, 1H), 7.87–7.89 (m, 1H), 7.71 (t, J = 8.0 Hz, 1H), 7.56 (s, 1H), 7.50–7.48 (m, 2H), 7.23 (d, J = 8.0 Hz, 1H), 7.07–7.05 (m, 1H), 6.64 (s, 1H), 6.53 (d, J = 8.0 Hz, 1H), 6.51 (d, J = 4.0 Hz, 1H), 6.47 (s, 1H), 6.45 (s, 1H), 6.34 (d, J = 8.0 Hz, 1H), 4.38 (t, J = 6.0 Hz, 2H), 3.95 (t, J = 4.0 Hz, 4H), 3.71 (s, 2H), 3.67–3.62 (m, 2H), 3.39–3.34 (m, 4H), 3.24 (t, J = 4.0 Hz, 4H), 3.18 (s, 4H), 2.94 (s, 2H), 2.59 (s, 4H), 1.17 (t, J = 6.0 Hz, 6H) (Fig. S4†); 13C NMR (100 MHz, CD2Cl2), δ (ppm): 169.38, 165.15, 163.91, 163.44, 155.33, 152.90, 152.73, 151.45, 150.93, 148.33, 131.81, 131.71, 130.35, 129.71, 127.51, 127.18, 125.07, 122.82, 122.04, 115.95, 114.24, 110.73, 108.60, 107.60, 104.10, 101.57, 97.25, 66.12, 64.64, 60.65, 47.60, 43.65, 38.45, 37.44, 11.60 (Fig. S5†); ESI-MS (m/z): 835.2 ([M1 + H+]+), calculated for C48H50N8O6: 834.3 (Fig. S6†).Results and discussion
Fluorescence spectral responses of probe 1 to metal ions
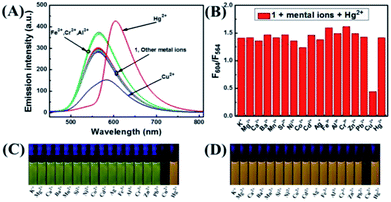
The selectivity of 1 was investigated by fluorescence spectroscopy. Fig. 1A showed the emission spectra of 1 (20 μM) in CH3CN–H2O (7/3, v/v) solution while being excited at 410 nm. Probe 1 showed an emission peak at 564 nm, which was ascribed to the fluorescence of the naphthalimide group. As shown in Fig. 2, by adding Hg2+, the characteristic fluorescence of rhodamine at 604 nm emerged quickly and the peak at 564 nm decreased gradually with an apparent color change from green to orange. The accession of Hg2+ triggered the ring-opening of the spirolactam of the rhodamine part that was useful for the acquisition of fluorescence resonance energy from the naphthalimide portion. Among these metal ions, some ions (Fe3+, Al3+, Cr3+) only induced single-signal slight fluorescence enhancement and Cu2+ could slightly quench the fluorescence. Subsequently, in order to evaluate the anti-interference ability of 1 for detecting Hg2+, a series of experimentations were conducted to observe the ratio variation in the fluorescence strength between 604 nm and 564 nm with the addition of 5.0 eq. of Hg2+ to the mixture of 1 in the existence of other metal ions (5.0 eq.). As shown in Fig. 1B, the result suggested that metal ions other than Cu2+ had no influence on the Hg2+-induced fluorescence responses.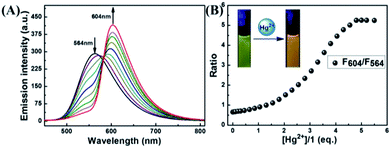 | ||
| Fig. 2 (A) The fluorescence variation of 1 induced by Hg2+; (B) the curve of fluorescent intensity ratio at 564 nm and 604 nm with the addition of different eq. of Hg2+. | ||
The fluorescence spectra of probe 1 treated with a range of concentrations of Hg2+ in CH3CN–H2O (7/3, v/v) solution were recorded with results shown in Fig. 2A. The spectra of 1 exhibited fluorescence emission at 564 nm of naphthalimide section and no obvious emission at 604 nm of rhodamine group was detected. Adding Hg2+ (0–5.0 eq.) to the CH3CN–H2O (7/3, v/v) solution of 1, the strength of the naphthalimide peak decreased, while a new peak belonged to the characteristic peak of rhodamine appeared and gradually increased, indicating the FRET process had occurred. When the concentration of Hg2+ was added to 5.0 eq., the ratio of emission intensities (F604/F564) remained unchanged and the fluorescent color of the solution of probe 1 transformed from green to orange. The quantum yield of fluorescence for probe 1 was calculated as Φ = 0.410 (for λem = 564 nm), whereas the worth of 1–Hg2+ complex belonged to 0.029 (for λem = 604 nm). In the concentration ranging from 0 to 21 μM, the variation of ratio of emission intensities (F604/F564) revealed a fine linear relationship (Y = 2.33097X + 188.4710, R = 0.994) with the concentration of Hg2+ (Fig. S7A†). The detection limit was calculated to be 2.334 μM based on 3σ/k (Fig. S7B†) (σ stands for the standard deviation of the blank signal and k indicates the ratio of grade for the linear calibration plot).39,40 The present probe was compared with other probes reported for Hg2+ detection in recent years,7–10 As shown in Table 1, these results revealed that probe 1 could detect a low level of Hg2+. These probes showed some good physical properties such as linear range, lower LOD, high sensitivity and so on. For the 1 + Hg2+ complex, a moderate performance in all aspects was observed, suggesting that probe 1 could serve as a fluorescence probe for Hg2+.
Absorption responses of 1 to metal ions
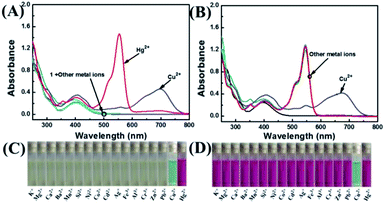
According to Fig. 3A, the absorbance of probe 1 showed only the characteristic absorption peak of the donor (naphthalimide) at 401 nm. The addition of 5.0 eq. Hg2+ instantly led to a remarkable increase in the absorption of rhodamine at 554 nm, and the color of the solution changed from light yellow to pink as observed by naked eyes. When 5.0 eq. of Cu2+ was added in the solution, the absorbance was markedly increased with a new peak arising at 697 nm. Next, we carried out competitive trials for the anti-interference capability of 1 + Hg2+. As shown in Fig. 3B, although the absorption of Cu2+ had a notable red shift, it was perfectly staggered and had no interference with the absorption peak at 554 nm. In titration experiments with Hg2+, absorption spectra of 1 + Hg2+ complex were obtained (Fig. 4A). With the gradual increase of Hg2+ concentration, the band at 554 nm was gradually increased. When the concentration of Hg2+ was 5.0 eq., the absorbance (A554) stabilized (Fig. 4B). In addition, the color of the solution changed from light yellow to pink upon addition of Hg2+. For Hg2+ in a concentration range of 0–70 μM, the absorbance (A554) displayed a great linear relationship (Y = 0.0158X − 0.094, R = 0.983). The UV/vis detection limit was calculated to be 0.679 μM based on 3σ/k (Fig. S8†).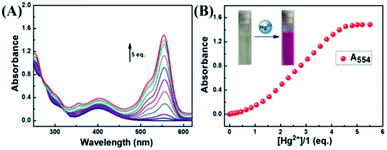 | ||
| Fig. 4 (A) Absorption spectral changes of 1 in the presence of different amounts of Hg2+; (B) the absorbance intensity at 554 nm. | ||
Detection mechanism for Hg2+
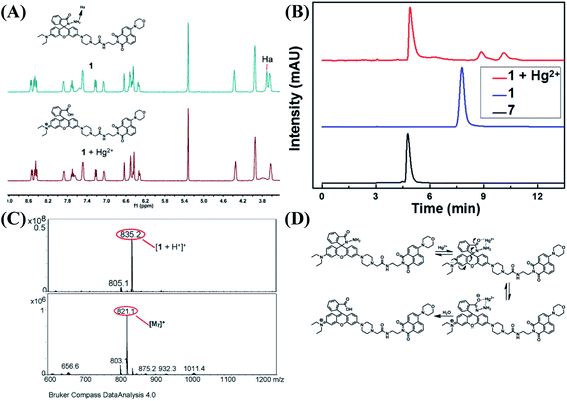
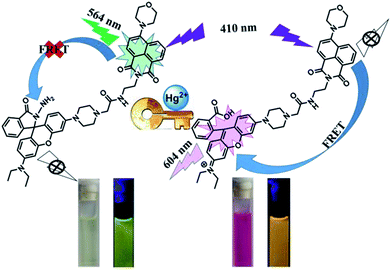
With the addition of Hg2+, the probe showed orange fluorescence, which implied that the spirolactam ring of the rhodamine group was opened. In order to verify this process, 1H NMR measurements were performed (Fig. 5A). In the spectrum of 1, the peak (Ha) of spirolactam ring was located at 3.70 ppm. Upon the addition of Hg2+ to the solution of 1, the peak disappeared because of the interaction between 1 and Hg2+. To further confirm the interaction between 1 and Hg2+, HPLC spectra of compound 7, 1 and 1 + Hg2+ were recorded as shown in Fig. 5B. The retention time of 1 + Hg2+ was almost the same as that of compound 7. In addition, ESI-MS measurements were performed with results shown in Fig. 5C. A characteristic peak at 835.2 m/z corresponding to [M1 + H+]+ was obtained in the mass spectra and a familiar peak at 821.1 m/z appeared upon the addition of Hg2+, which was the same as [M7]+. Based on the above results, it was verified that probe 1 was hydrolyzed to rhodamine acid and the structure returned compound 7 (1 + Hg2+ complex). A possible reaction mechanism41 for Hg2+-promoted hydrolysis was proposed as shown in Fig. 5D.As illustrated in Scheme 2, the probe 1 was in the spirolactam ring-closing status and the FRET must remain closure before reacting with Hg2+. The addition of Hg2+ caused the rhodamine acceptor to be in the ring-opening form through Hg2+-promoted hydrolysis of rhodamine hydrazide to rhodamine acid as formerly reported,42,43 and thus initiated the FRET process.
Cell culture and imaging
To investigate the membrane permeability of 1 in biological systems, HeLa cells (human cervical cancer cell) were incubated in DMEM (Dulbecco modified Eagle's medium) increasing 10% PBS in the condition of 5% CO2 and 95% air at 37 °C. Subsequently, HeLa cells were cultured with compound 1 (20 μM) for 30 minutes and imaged with a fluorescent microscope. As illustrated in Fig. 6, a green fluorescence was observed. This result indicated that probe 1 was a promising candidate for cell imaging.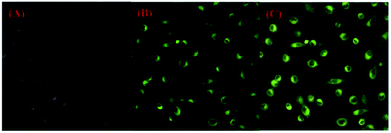 | ||
| Fig. 6 Fluorescence images of HeLa cells with an excitation filter of 410 nm and emission collected at 500–700 nm: (A) bright field image; (B) dark field image; (C) merged images of (A) and (B). | ||
Conclusions
In conclusion, a rhodamine–naphthalimide probe has been developed. The Hg2+-induced changes in color and fluorescence not only have high selectivity and sensitivity but also can be visualized by “naked-eyes”. The probe also exhibited a good linear relationship in both fluorescence and UV-vis measurements. In addition, the spectral shifts of two obvious emission bands were up to 40 nm, which could reduce the interference of crosstalk signals, eliminate any influence of excitation backscattering, and improve the detection accuracy. Additionally, it was successfully applied to intracellular staining in biological applications. Therefore, the results reported here provided a novel approach for the recognition of Hg2+.Conflicts of interest
There are no conflicts of interest to declare.Acknowledgements
The authors are grateful for the financial support from the National Natural Science Foundation of China (41867052, 21662015, 21861017, 41867053), the “5511” Science and Technology Innovation Talent Project of Jiangxi, the key project of Natural Foundation of Jiangxi Province (20171ACB20025), the Science Funds of Natural Science Foundation of Jiangxi Province (20171BAB203014, 20171BAB203011), the Masters' Innovative Foundation of Jiangxi Science and Technology Normal University (YC2018-X43).Notes and references
- X. Chen, T. Pradhan, F. Wang, J. S. Kim and J. Yoon, Chem. Rev., 2011, 112, 1910–1956 CrossRef PubMed.
- Y. L. Fu, C. B. Fan, G. Liu and S. Z. Pu, Sens. Actuators, B, 2017, 239, 295–303 CrossRef CAS.
- E. T. Feng, C. B. Fan, N. S. Wang, G. Liu and S. Z. Pu, Dyes Pigm., 2018, 151, 22–27 CrossRef CAS.
- Y. P. Xuan and J. B. Qu, RSC Adv., 2018, 8, 4125–4129 RSC.
- X. L. Zheng, H. Li, W. Feng, H. C. Xia and Q. H. Song, ACS Omega, 2018, 3, 11831–11837 CrossRef CAS PubMed.
- K. Y. Tan, C. Y. Li, Y. F. Li, J. J. Fei, B. Yang, Y. J. Fu and F. Li, Anal. Chem., 2017, 89, 1749–1756 CrossRef CAS PubMed.
- R. C. Gupta, S. S. Razi, R. Ali, S. K. Dwivedi, P. Srivastava, P. Singh, B. Koch, H. Mishra and A. Misra, Sens. Actuators, B, 2017, 251, 729–738 CrossRef CAS.
- W. J. Feng, Q. X. Hai, Y. Zhou, Y. Ni, L. L. Wang, S. Jing, L. Li and W. Ji, Talanta, 2017, 167, 681–687 CrossRef CAS PubMed.
- E. Bozkurt and H. I. Gul, Sens. Actuators, B, 2018, 255, 814–825 CrossRef CAS.
- F. J. Orriach-Fernandez, A. Medina-Castillo, J. F. Fernandez-Sanchez, A. M. Pena and A. Fernandez-Gutierrez, Anal. Methods, 2013, 5, 6642–6648 RSC.
- A. Mohan and R. N. Kizhakayil, ACS Appl. Mater. Interfaces, 2016, 8, 14125–14132 CrossRef CAS PubMed.
- S. H. Jing, C. H. Zheng, S. Z. Pu, C. B. Fan and G. Liu, Dyes Pigm., 2014, 107, 38–44 CrossRef CAS.
- D. Singhal, N. Gupta and A. K. Singh, RSC Adv., 2015, 5, 65731–65738 RSC.
- Y. J. Gong, X. B. Zhang, Z. Chen, Y. Yuan, Z. Jin, L. Mei, J. Zhang, W. H. Tan, G. L. Shen and R. Q. Yu, Analyst, 2012, 137, 932–938 RSC.
- S. Gupta and M. D. Milton, New J. Chem., 2018, 42, 2838–2849 RSC.
- Y. J. Gong, X. B. Zhang, C. C. Zhang, A. L. Luo, T. Fu, W. H. Tan, G. L. Shen and R. Q. Yu, Anal. Chem., 2012, 84, 10777–10784 CrossRef CAS PubMed.
- J. M. Hu, L. Dai and S. Y. Liu, Macromolecules, 2011, 44, 4699–4710 CrossRef CAS.
- K. M. Vengaian, C. D. Britto, K. Sekar, G. Sivaraman and S. Singaravadivel, RSC Adv., 2016, 6, 7668–7673 RSC.
- M. Kaur, Y. H. Ahn, K. H. Choi, M. J. Choa and D. H. Choi, Org. Biomol. Chem., 2015, 13, 7149–7153 RSC.
- S. k. Yao, Y. Qian, Z. Q. Qi, C. G. Lu and Y. P. Cui, New J. Chem., 2017, 41, 13495–13503 RSC.
- D. W. Huang, C. G. Niu, G. M. Zeng, X. Y. Wang and X. X. Lv, Talanta, 2015, 132, 606–612 CrossRef CAS PubMed.
- P. Mahato, S. Saha, E. Suresh, R. D. Liddo, P. P. Parnigotto, M. T. Conconi, M. K. Kesharwani, B. Ganguly and A. Das, Inorg. Chem., 2012, 51, 1769–1777 CrossRef CAS PubMed.
- M. F. Czar, F. Zosel, I. König, D. Nettels, B. Wunderlich, B. Schuler, A. Zarrine-Afsar and R. A. Jockusch, Anal. Chem., 2015, 87, 7559–7565 CrossRef CAS PubMed.
- P. Siddhartha, S. Buddhadeb, M. Manjira, D. Koushik, Z. Ennio, K. M. Sushil, R. K. Anisur and C. Pabitra, Analyst, 2014, 139, 1628–1631 RSC.
- A. B. Othman, J. W. Lee, J. S. Wu, J. S. Kim, R. Abidi, P. Thuery, J. M. Strub, A. V. Dorsselaer and J. Vicens, J. Org. Chem., 2007, 72, 7634–7640 CrossRef PubMed.
- Y. H. Lee, M. H. Lee, J. F. Zhang and J. S. Kim, J. Org. Chem., 2010, 75, 7159–7165 CrossRef CAS PubMed.
- C. Ma, F. Zeng, L. F. Huang and S. Z. Wu, J. Phys. Chem. B, 2011, 115, 874–882 CrossRef CAS PubMed.
- X. L. Zhang, Y. Xiao and X. H. Qian, Angew. Chem., 2008, 120, 8145–8149 CrossRef.
- J. F. Sun, B. Hua, Q. Li, J. Zhou and J. Yang, Org. Lett., 2018, 20, 365–368 CrossRef CAS PubMed.
- Y. X. Fu, H. Jin, X. N. Bu and R. J. Gui, J. Agric. Food Chem., 2018, 66, 9819–9827 CrossRef CAS PubMed.
- N. Melnychuk and A. S. Klymchenko, J. Am. Chem. Soc., 2018, 140, 10856–10865 CrossRef CAS PubMed.
- Y. Y. Wang, X. Xiang, R. Yan, Y. Liu and F. L. Jiang, J. Phys. Chem. C, 2018, 122, 1148–1157 CrossRef CAS.
- J. M. Haimerl, I. Ghosh, B. König and J. M. Lupton, J. Phys. Chem. B, 2018, 122, 10728–10735 CrossRef CAS PubMed.
- M. J. Liu, J. Yuan, J. Tao, Y. Q. Zhang, C. M. Liu and H. Z. Kou, Inorg. Chem., 2018, 57, 4061–4069 CrossRef CAS PubMed.
- J. Yuan, S. Q. Wu, M. J. Liu, O. Sato and H. Z. Kou, J. Am. Chem. Soc., 2018, 140, 9426–9433 CrossRef CAS PubMed.
- L. Liu and J. C. Dai, Cryst. Growth Des., 2018, 18, 4460–4469 CrossRef CAS.
- X. Zheng, R. Ji and X. Cao, Anal. Chim. Acta, 2017, 978, 48–54 CrossRef CAS PubMed.
- J. C. Wu, T. Yi, T. M. Shu, M. X. Yu, Z. G. Zhou, M. Xu, Y. F. Zhou, H. J. Zhang, J. T. Han, F. Y. Li and C. H. Huang, Angew. Chem., Int. Ed., 2008, 47, 1063–1067 CrossRef CAS PubMed.
- L. He, X. Yang, Y. Liu and W. Lin, Anal. Methods, 2016, 8, 8022–8027 RSC.
- S. Wang, H. C. Ding, Y. S. Wang, C. B. Fan, Y. Y. Tu, G. Liu and S. Z. Pu, RSC Adv., 2018, 8, 33121–33128 RSC.
- D. Virginie, F. Francis and W. Anthony, J. Am. Chem. Soc., 1997, 119, 7386–7387 CrossRef.
- L. Song, X. D. Sun, Y. Ge, Y. H. Yao, J. Shen, W. B. Zhang and J. H Qian, Chin. Chem. Lett., 2016, 27, 1776–1780 CrossRef CAS.
- J. L. Tang, C. Y. Li, Y. F. Li, X. Lu and H. R. Qi, Anal. Chim. Acta, 2015, 888, 155–161 CrossRef CAS PubMed.
Footnote |
| † Electronic supplementary information (ESI) available. See DOI: 10.1039/c9ra01459d |
| This journal is © The Royal Society of Chemistry 2019 |


