 Open Access Article
Creative Commons Attribution 3.0 Unported Licence
Effect of reduction temperature on the structure and hydrodesulfurization performance of Na doped Ni2P/MCM-41 catalysts
Nan Jianga,
Fuyong Zhangab and
Hua Song *a
*a
aProvincial Key Laboratory of Oil & Gas Chemical Technology, College of Chemistry & Chemical Engineering, Northeast Petroleum University, Daqing 163318, Heilongjiang, P. R. China. E-mail: jiangnandq@163.com; songhua2004@sina.com; Tel: +86-6503167
bState Key Laboratory of Physical Chemistry of Solid Surfaces, Collaborative Innovation Center of Chemistry for Energy Materials, National Engineering Laboratory for Green Chemical Productions of Alcohols, Ethers and Esters, College of Chemistry and Chemical Engineering, Xiamen University, Xiamen 361005, P. R. China. E-mail: 867881282@qq.com
First published on 17th May 2019
Abstract
The removal of sulfur compounds from petroleum is increasingly important because of the environmental pollution caused by sulfur compounds. In this work, Na doped Ni2P/MCM-41 catalysts were successfully prepared, and their hydrodesulfurization (HDS) performances were assessed using dibenzothiophene (DBT) as a model molecule. Moreover, the effects of reduction temperature (450–600 °C) on the structure and HDS performance of the Ni2P/Na-MCM-41 catalysts were studied. Results showed that: (a) the reduction temperature of the catalyst could be as low as 450 °C due to Na doping, which is about 200 °C lower than that of the conventional temperature-programmed reduction method (650–1000 °C); (b) increasing the reduction temperature lead to an increase in the diameter of Ni2P particles, which was demonstrated by size distribution analysis; (c) the HDS performance of the Ni2P/Na-M41-T catalysts increases with reduction temperature and 99.2% DBT conversion was observed for Ni2P/Na-M41-600, whereas the hydrogenation route of the catalysts decreased with increasing the reduction temperature, which indicates the lower reduction temperature favored the direct desulfurization pathway (DDS).
1. Introduction
The removal of sulfur from gasoline and diesel fuels has been the subject of intensive investigations in recent years. Sulfur-containing aromatic compounds such as thiophenes, benzothiophenes, dibenzothiophenes (DBT) and their alkylated derivatives from petroleum fractions in most cases were removed through the hydrodesulfurization (HDS) process.1 Among them, DBT and its alkylated derivatives are the most difficult sulfur-containing molecules to hydrodesulfurize.2 Supported transition metal phosphides have recently received extensive attention as a new family of non-sulfided HDS catalysts due to their high activity and stability for the HDS of petroleum feedstocks.3,4 Among these HDS catalysts, supported Ni2P has shown better HDS performance and thus are good candidates for deep HDS,5–7 and it was found that the HDS activity of Ni2P catalysts was remarkably enhanced when it was supported on MCM-41. In conventional TPR method, the oxidic precursors were obtained mainly by the impregnation of (NH4)2HPO4 (or NH4H2PO4) and Ni(NO3)2 solutions, then dried, calcined. Then the Ni2P phase was obtained by reducing the oxidic precursors in flow of H2,8,9 however, the reduction temperature is higher (≥650 °C) owing to the strong P–O–P bond. This means a strong investment for energy consumption during the preparation process, which limits the practical application of this Ni2P/MCM-41 catalyst. Therefore, the development of a simple method for preparing Ni2P/MCM-41 catalysts under mild conditions is an interesting direction and received a great deal of research. Generally, for the synthesis of Ni2P/MCM-41 catalyst under mild conditions, the methods of ‘Changing phosphide precursors’ that using different phosphide precursors such as NH4H2PO2 and NiCl2·6H2O to reduce the reduction temperature have been frequently used, because the reduction temperature could be effectively decreased by using low-state phosphide instead of high-state phosphide. It is well known that the reduction of nickel phosphide precursors and their dispersion on the support can be modified by the addition of some additives to the support.10 Among many different materials, Na-containing supports have attracted special attention in the field of hydrodesulfurization catalysis. Rodrigo11 et al. found that the addition of Na content has a strong influence on the HDS performance of Ni–Mo catalysts supported on TiO2 nanotubes and their reduction nature. Similar results were obtained by Sawada,12 in which the reduction temperatures of Rh2P supported on Al2O3 and SiO2 catalysts could be reduced by addition of Na to the corresponding catalyst. One of their explanations is that the alkali metal cation may act as a trap for dissociated hydrogen species significantly reducing hydrogen spillover and hydrogen mobility on the catalyst surface.13 However, to the best of our knowledge, the effect of reduction temperature on the performance of Na doped support was not discussed and role of Na is still not fully recognized. Therefore, further investigations are still needed.In this paper, the Ni2P catalyst supported on the Na doped MCM-41 supports (Na-MCM-41) were successfully prepared. The aims of this research are to study the effect of reduction temperature on the structure and HDS performance of the Ni2P/Na-MCM-41 catalyst and propose a promising low energy consumption (a low reduction temperature) and high HDS activity preparation method of supported Ni2P catalysts.
2. Experimental
2.1. Preparation of support and catalysts
Siliceous MCM-41 was synthesized using tetraethyl orthosilicate (TEOS) as the silica source and cetyltrimethylammonium bromide (CTAB) as the template, following the procedure as described in the literature.14 The Na-MCM-41 was prepared following the method reported by our previous study.15 The supports obtained were named ‘M41’ for MCM-41 and ‘Na-M41’ for Na-MCM-41, respectively, where the mass fraction of Na is 0.7 wt%. The supported Ni2P catalysts were prepared by TPR method. In a typical synthesis technique, 2.66 g (NH4)2HPO4 and 2.95 g Ni(NO3)2·6H2O were dissolved in 20 mL of deionized water at room temperature to form a uniform solution. A quantity of 4.8 g Na-M41 was wet impregnated with the above solution for 12 h. After the water was evaporated, the resulting solid was dried at 120 °C for 12 h and calcined at 500 °C for 3 h to obtain the final oxidic precursor. It was then ground with a mortar and pestle, pelletized using a press, crushed, and then sieved to achieve a particle diameter of 16/20 mesh, finally the samples were transferred to a crucible and placed in the center of the tube furnace, and then reduced by heating from room temperature room temperature to 450 °C, 500 °C, 550 °C and 600 °C at a rate of 2.0 °C min−1 in a flow of H2 (200 mL min−1), and held for 2 h at each temperature.16 The obtained catalysts were allowed to cool naturally to room temperature in a continuous H2 flow and then passivated in an O2/N2 mixture (0.5 vol% O2) with a flow rate of 20 mL min−1 for 2 h. The obtained catalysts with the Ni loading of 9.73 wt%, an initial Ni/P molar ratios of 1/2 are denoted as Ni2P/Na-M41-T, where T is the reduction temperature of Ni2P/Na-M41 catalyst precursors.2.2. Catalysts characterization
The reducibility of precursors was characterized by the H2 temperature programmed reduction (H2-TPR) using PC-1200 gas adsorption analyser. For the other characterizations, the reduced and passivated catalysts were immediately sealed and were characterized as soon as possible. The X-ray diffraction (XRD) patterns were obtained with a D/max-2200PC-X-ray diffractometer using Cu Kα radiation under the setting conditions of 40 kV, 30 mA, scan range from 10 to 80° at a rate of 10° min−1. N2 adsorption–desorption was carried out on a NOVA2000e instrument at 77 K. The CO uptake measurements were used to titrate the surface nickel atoms and to provide an estimation of the active sites on the catalysts. The CO uptakes were obtained by pulsing calibrated volumes of CO into a He carrier. Usually, 0.2 g of sample was loaded into a quartz reactor and pretreated in H2 at 400 °C for 3 h. After cooling in He, pulses of CO in a He carrier at 40 cm3 (NTP) min−1 were injected at RT through a sampling valve. CO uptake was calculated by measuring the decrease in the peak areas caused by adsorption in comparison with the area of a calibrated volume.The analysis of the TEM images of the Ni2P particles can be done with the open source program ImageJ, with which the particles can be measured. The scale must be transferred and then the primary particles can be measured. The X-ray photoelectron spectroscopy (XPS) spectra were acquired using ESCALAB MKII spectrometer.
2.3. Catalytic activity tests
The HDS of DBT over prepared catalysts was performed in a flowing high-pressure fixed-bed reactor using a feed consisting of a decalin solution of DBT (1 wt%), WHSV = 2.5 h−1, and hydrogen/oil ratio of 550 (v/v). Prior to reaction, 0.8 g of the catalysts were pretreated in situ with flowing H2 (30 mL min−1) at test temperature for 2 h. Sampling of liquid products was started 2 h after the steady reaction conditions had been achieved. The feed and reaction product was analyzed by FID gas chromatography with a GC-14C-60 column. Turnover frequency (TOF) values of the samples containing nickel phosphide were calculated using eqn (1):17| TOF = (F × X)/(W × M) | (1) |
3. Results and discussion
3.1. H2 temperature programmed reduction
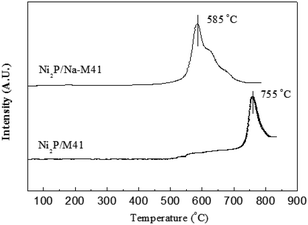
The H2 temperature programmed reduction (H2-TPR) profile of the Ni2P/Na-M41 catalyst precursor is shown in Fig. 1. It can be observed from Fig. 1 that the reduction of Ni2P/M41 precursors started at 700 °C and the hydrogen consumption peak was centered around 755 °C, which can be attributed to the reduction of highly stable P–O–P bond and the co-reductions of the nickel species in phosphate.16 whereas the reduction of Ni2P/Na-M41 precursors started at 500 °C and the hydrogen consumption peak was centered around 585 °C. This result indicates the reduction temperature of Ni2P/Na-M41 decreased at least 170 °C as compared to that of Ni2P/M41 consumption peak was centered around 585 °C. This result indicates the reduction temperature of Ni2P/Na-M41 decreased at least 170 °C as compared to that of Ni2P/M41. This reveals that the Ni2P phase obtained could be obtained under lower temperature by doping Na. One explanation12 was that (NH4)2HPO4 could be transformed to polyphosphate during the calcination process. Generally, a certain number of the oxygen atoms are shared between PO4 groups in polyphosphates, and the reduction of polyphosphates were realized by breaking of P–O–P linkages, which is more difficult as compared with the P–O–H linkages in phosphate. Van Wazer and co-workers17 studied the effect of Na cation on the distribution of phosphate structural units on the basis of statistics. They found that Na cation acts as a polymerization inhibitor, which decrease the length of chain phosphates. It was also reported18 that the metal Na is partially covalently bonded in the complexes or at least are held at specific sites, which further demonstrated that the formation of polyphosphate with highly stable P–O–P bond could be prevented by the addition of Na. Recently, Sawada et al.12 found that the precursor of phosphide catalyst required reduction temperature can be decreased by Na addition. As our results showed similar results to the reported literatures, we can also attributed the decreased temperature of hydrogen consumption peak to polymerization inhibitor Na, which makes the phosphide catalyst be easily formed at a lower reduction temperature.3.2. The X-ray diffraction (XRD) patterns analysis
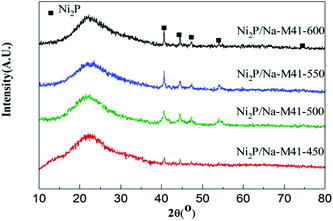
The X-ray diffraction (XRD) patterns of Ni2P/Na-M41-T catalysts are shown in Fig. 2. As can be seen, all samples exhibit a broad feature owing to the amorphous nature of mesoporous M41 at 2θ ≈ 22°. For the Ni2P/Na-M41-T samples, the strong diffraction peaks at 2θ = 40.6°, 44.5°, 47.1° and 54.1° (PDF: 03-0953) can be assigned to Ni2P, and no additional phase related to Ni and P is observed. This indicates that the active phase formed is mainly Ni2P for these samples. It is worth noting that some obvious diffraction peaks of Ni2P phase were started to generate at the reduction temperature of 450 °C, indicating that the addition of Na can decrease the reduction temperature of Ni2P, which is about 200 °C lower than that of the conventional temperature-programmed reduction (TPR) method (650–1000 °C).19 This result is in accordance with the H2-TPR analysis (Fig. 2). With increasing the temperature from 450 °C to 600 °C, the Ni2P phase peaks become more intense and sharpen, showing that more Ni2P particles were formed and the crystal sizes of Ni2P phase were increased with increasing the reduction temperature formation of the active Rh2P phase. The crystallite sizes (Dc) of Ni2P phase were calculated from Scherrer's equation20 and listed in column 5 of Table 1. Dc increased with increasing the reduction temperature from 450 to 600 °C, and it will be demonstrated again in the next analysis.| Sample | SBET (m2 g−1) | Vp (cm3 g−1) | d (nm) | Dc (nm) | CO uptake (μmol g−1) | Conversion (%) 280 °C | Selectivity (%) | TOF (10−3·s−1) | |
|---|---|---|---|---|---|---|---|---|---|
| CHB | BP | ||||||||
| M41 | 911 | 0.962 | 4.2 | — | — | — | — | — | — |
| Na-M41 | 858 | 0.874 | 4.1 | — | — | — | — | — | — |
| Ni2P/Na-M41-450 | 315 | 0.349 | 4.5 | 8.8 | 27 | 40.2 | 11.1 | 88.9 | 3.2 |
| Ni2P/Na-M41-500 | 287 | 0.316 | 4.4 | 9.6 | 40 | 59.1 | 12.2 | 87.8 | 3.4 |
| Ni2P/Na-M41-550 | 135 | 0.160 | 7.7 | 19.7 | 48 | 65.9 | 12.4 | 87.6 | 3.8 |
| Ni2P/Na-M41-600 | 122 | 0.144 | 9.7 | 20.9 | 51 | 69.3 | 15.4 | 84.6 | 3.9 |
3.3. Transmission electron microscope examinations
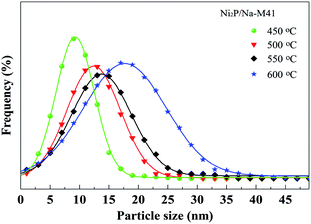
Transmission electron microscope (TEM) images and the particle size distribution of the Ni2P/Na-M41-T catalysts are shown in Fig. 3 and 4. In order to measure the size of the catalyst more accurately, the size of about 400 Ni2P particles in TEM image were measured by ImageJ software. The average Ni2P particle size in the Ni2P/Na-M41-450 and Ni2P/Na-M41-600 catalyst was 8 nm and 16.2 nm respectively. These results reveal that an increase in reduction temperature leads to sintering of the catalyst and the formation of larger particles. Moreover, unlike the typical stacked morphologies of Mo and W sulfides, Ni2P are not layered and form spherical particles that can be well dispersed on supports.21 With increasing the reduction temperature, the average Ni2P particle size increased, which was consistent with observation from XRD analysis.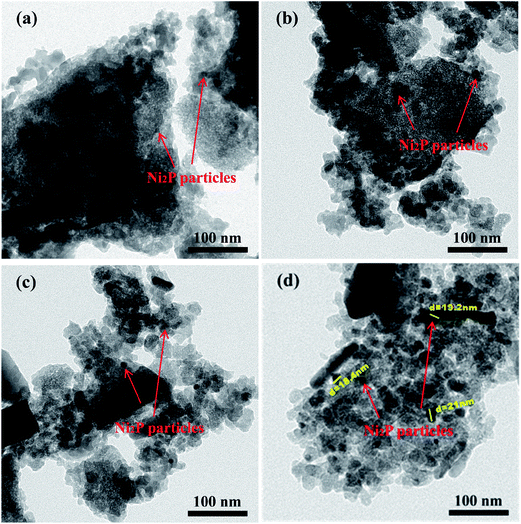 | ||
| Fig. 3 TEM spectra of (a) Ni2P/Na-M41-450, (b) Ni2P/Na-M41-500, (c) Ni2P/Na-M41-550, and (d) Ni2P/Na-M41-600. | ||
3.4. Textural properties
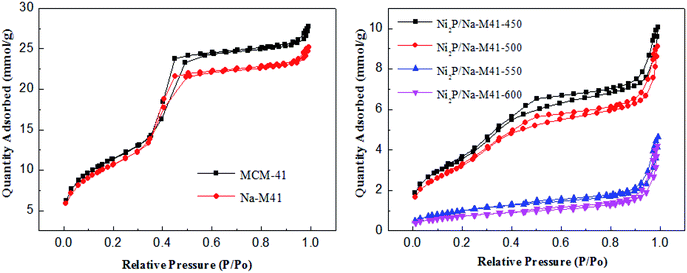
All the results of the textural properties of the Na-M41 support and the various catalysts prepared using different reduction temperatures are listed in Table 1. In general, the BET surface areas of the Na doped support M41-41 (858 m2 g−1) were lower than that of bare support (911 m2 g−1), a similar trend was observed with the pore volumes and the average pore size of the support, which can be attributed to the incorporation of Na onto the support material. Moreover, there is a noticeable difference in the magnitude of the specific surface area of the catalysts depending on the applied reduction temperature. The surface area of the catalysts decreased from 315 to 122 m2 g−1 when the reduction temperature increased from 450 to 600 °C. However, Ni2P/Na-M41-600 has the largest average pore diameter of 9.7 nm compared with the others, this is possibly because the higher reduction temperature may destroy the pore of catalysts. As shown in Fig. 5, the shapes of the adsorption–desorption isotherms of Ni2P/Na-M41-T are type of IV isotherm and a standard H4 type hysteresis loop according to the IUPAC classification, which showed that some mesopores are presented for all samples.3.5. CO uptake analysis
The CO uptakes was used to estimate the surface density of exposed Ni sites on the catalysts.22 The CO uptakes at room temperature of the Ni2P/Na-M41-T catalysts are listed in column 6 of Table 1. As common sense, CO molecules may also be adsorbed on P sites, the amount of CO molecules may be very small and can be ignored.23 As shown in Table 1, the CO adsorption of the Ni2P/Na-M41-450 catalyst was 27 μmol g−1. Upon increasing the reduction temperature of the catalysts, the CO uptakes of the Ni2P/Na-M41-T samples were significantly increased, which showed that increasing the reduction temperature can lead to an increase in the amount of exposed nickel atoms on the surface. This may be ascribed to the formation of more Ni2P particles (XRD analysis) and suppression of the P enrichment on the surface (XPS analysis) with increasing the reduction temperature. This will be discussed further with the XPS analysis.3.6. The X-ray photoelectron spectroscopy spectra
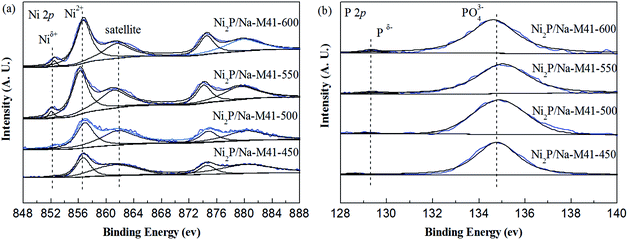
In order to gain further insight into the surface composition of the samples and the valence states of the active components, the XPS spectra technique of samples was performed. The XPS spectra of the Ni2P/Na-M41-T samples in the Ni (2p) and P (2p) regions are shown in Fig. 6, and the binding energies for all samples are listed in Table 2. As shown in Fig. 6(a), all spectra were decomposed, taking into account the spin-orbital splitting of the Ni 2p3/2 and Ni 2p1/2 lines (about 17 eV) and the presence of satellite peaks at about 5 eV higher than the binding energy of the parent signal.24 As is well know that Ni 2p3/2 core-level spectrum consists of three components. The bands centered at 852.1–852.5 eV can be ascribed to Niδ+ in the Ni2P phase, and the second at 856.2–856.8 eV corresponds to the Ni2+ species interacting with phosphate species as a consequence of superficial passivation, accompany with the broad satellite at approximately 5.0 eV higher than that of the Ni2+ species and this shake-up peak is assigned to divalent species25 Meanwhile, other broad peaks on the high binding energy side can be ascribed to the Ni 2p1/2 signal from oxidized Ni species.26 P 2p binding energy involves the peaks at 128.9–129.3 eV can be assigned to Pδ− species on the metal phosphides24 and the peak at 134.6–135.0 eV due to phosphate (P5+) arising from superficial oxidation of nickel phosphide particles.27 As can be seen from Fig. 6(a) and Table 2, the XPS spectra for the as prepared Ni2P/Na-M41-450 exhibited Ni 2p peaks at 852.6 and 856.7 eV, which can be attributed to the Niδ+ band forming Ni2P phase and Ni2+ species, respectively. No obvious change can be seen for the binding energy of Ni species among the Ni2P/Na-M41-T. In addition, the intensity of Niδ+ species bands of the Ni2P/Na-M41-T catalyst become more intense with increasing the reduction temperature. Fig. 6(b) shows the peaks of Ni2P/Na-M41-450 centered at 134.8 eV for PO43− was observed, together with a low intensity peak at 128.9 eV that can be attributed to the Pδ− band forming Ni2P. The intensity of Pδ+ species bands over the Ni2P/Na-M41-T catalyst became more intense with increasing the reduction temperature, which showed the similar tendency with the Niδ+ species in Ni 2p. Therefore, it can be concluded that increasing the reduction temperature of the precursors can promote the formation of more Ni2P particles. The binding energy of Pδ− is increased with increasing the reduction temperature. This special effect is beneficial to the reduction PO34− into Ni2P.| Sample | Binding energy (eV) | Superficial atomic ratio | |||||||
|---|---|---|---|---|---|---|---|---|---|
| Ni 2p3/2 | P 2p3/2 | ||||||||
| Ni2+ | Satellite | Niδ+ | P5+ | Pδ− | P/Ni | Na (%) | Ni (%) | Na/Ni | |
| Ni2P/Na-M41-450 | 856.7 | 861.8 | 852.4 | 134.8 | 128.9 | 1.99 | 0.89 | 4.72 | 0.19 |
| Ni2P/Na-M41-500 | 856.8 | 861.7 | 852.5 | 134.9 | 129.1 | 1.96 | 0.73 | 3.58 | 0.21 |
| Ni2P/Na-M41-550 | 856.2 | 861.0 | 852.1 | 135.0 | 129.3 | 1.34 | 0.5 | 2.02 | 0.24 |
| Ni2P/Na-M41-600 | 856.7 | 861.4 | 852.4 | 134.6 | 129.3 | 1.33 | 0.49 | 1.87 | 0.26 |
3.7. Hydrodesulfurization activity
Fig. 7 depicts the variation of DBT conversion with time on stream during DBT HDS catalyzed by Ni2P/Na-M41-T catalysts. As can be seen from Fig. 7, the HDS activities for all samples gradually increased with time on stream initially, and 99.2% DBT conversion was observed for Ni2P/Na-M41-600 after 8 h, during which more active intermediate phase gradually formed, and then tended to stable, showing the active intermediate phase had completely formed. The active intermediate phase is regarded as a superficial phosphosulfide with a stoichiometry represented by NiPxSy, which is more active than Ni2P phase.27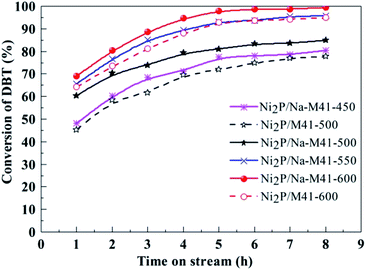 | ||
| Fig. 7 The HDS activity of the Ni2P/Na-M41-T catalysts. Temperature, 340 °C; pressure, 3.0 MPa; H2/oil ratio, 550 (v/v); WHSV, 2.5 h−1. | ||
As seen from Fig. 7, the DBT conversion of Ni2P/Na-M41-500 catalyst reduced at 500 °C was 84.7% after 8 h, which was 7.2% higher as compared to that of Ni2P/M41-500 prepared at the same reduction temperature. This reveals that the benefit of the addition of Na is that a higher HDS activity can be achieved at lower reduction temperature. Furthermore, it is worth noting that the DBT conversions of Ni2P/Na-M41-T catalyst increased upon increasing the reduction temperature and nearly 100% DBT conversion (99.2%) was observed for Ni2P/Na-M41-600. While for the Ni2P/M41-600 the DBT conversion is only 95.0%, which is low. The CO uptakes can be used to evaluate the TOF of the catalyst (Table 1). The HDS TOF of Ni2P/Na-M41-T increased with increasing reduction temperature. And the TOF of Ni2P/Na-M41-600 reached 3.69 × 10⁻³ s−1, indicating more effective Ni2P phase was formed at higher reduction temperature. Therefore, the boosted HDS activity observed in the Ni2P/Na-M41-T catalysts could be attributed to the highly dispersed active Ni2P phase, as well as lower coverage of phosphorus on the surfaces of these catalysts (Table 1, XPS analysis).
To investigate the effect of reduction temperature on the HDS catalytic selectivities, the selectivities to BP and CHB over Ni2P/Na-M41-T catalysts are presented in Table 1. For all the samples, BP is formed in greater proportions, indicating that DBT primarily removed by the DDS pathway over all the catalysts. The Ni2P/Na-M41-450 has a BP selectivity of 88.9%, and the BP selectivities of catalysts show a slightly decreased with increasing the reduction temperature, which indicates the lower reduction temperature favored the DDS route.
4. Conclusions
In this research the Ni2P/Na-M41-T catalysts with Na loading of 0.7 wt%, Ni loading of 9.73 wt% and an initial Ni/P molar ratios of 1/2 were successfully prepared. The effect of reduction temperature (450–600 °C) on the structure and HDS performance of Ni2P/MCM-41 catalyst was studied. TPR result indicates the reduction temperature of Ni2P/Na-M41 is decreased at least 170 °C as compared to that of Ni2P/M41 owing to the incorporation of Na, which would save energy consumption during preparation of catalyst. The decreased reduction temperature can be attributed to the formation of polyphosphate with highly stable P–O–P bond could be prevented by the addition of Na. The XRD analysis exhibited that the Ni2P/Na-M41 catalyst can be obtained at reduction temperature of 450 °C, which is about 200 °C lower than that of the conventional TPR method (650–1000 °C). Increasing the reduction temperature lead to an increase in the Ni2P particle size and decrease the enrichment of P on the surface, and therefore give rise to more exposed nickel sites.The DBT conversions of Ni2P/Na-M41-T catalyst increased upon increasing the reduction temperature and nearly 100% DBT conversion (99.2%) was observed for Ni2P/Na-M41-600, which is higher than that of the Ni2P/M41-600 (95.0%) prepared by conventional TPR method. This can be attributed to the highly dispersed active Ni2P phase, as well as lower coverage of phosphorus on the surfaces of these catalysts. The DBT primarily removed by the DDS pathway over all the catalysts and the lower reduction temperature favored the DDS route.
Conflicts of interest
There are no conflicts to declare.Acknowledgements
The authors acknowledge the financial supports from the National Natural Science Foundation of China (21276048).References
- C. A. Umar, R. A. Khalid and A. Sagir, J. Cleaner Prod., 2019, 211, 1567–1575 CrossRef.
- J. G. Jang, Y. K. Lee and P. Y. Wu, Appl. Catal., B, 2019, 250, 181–188 CrossRef CAS.
- H. Y. Zhao, S. T. Oyama, H. J. Freund, R. Włodarczyk and M. Sierka, Appl. Catal., 2015, 164, 204–216 CrossRef CAS.
- J. L. Liang and M. M. Wu, J. Catal., 2018, 358, 155–167 CrossRef CAS.
- S. T. Oyama, H. Zhao, H. J. Freund, K. Asakura and R. Włodarczyk, J. Catal., 2012, 285, 1–5 CrossRef.
- S. Tian, X. Li, A. Wang and R. Prins, Angew. Chem., Int. Ed., 2016, 55, 4030–4034 CrossRef CAS PubMed.
- C. P. Jiménez-Gómez, J. A. Cecilia and R. Moreno-Tost, ChemCatChem, 2017, 9, 2881–2889 CrossRef.
- P. J. Hsu and Y. C. Lin, J. Taiwan Inst. Chem. Eng., 2017, 79, 80–87 CrossRef CAS.
- Z. Q. Yu, A. J. Wang and S. Liu, Catal. Today, 2019, 319, 48–56 CrossRef CAS.
- F. J. Mendeza, Appl. Catal., B, 2017, 219, 479–491 CrossRef.
- A. Rodrigo and R. A. Ortega-Domínguez, J. Catal., 2015, 329, 457–470 CrossRef.
- A. Sawada and Y. Kanda, Catal. Commun., 2014, 56, 60–64 CrossRef CAS.
- C. Dong and X. Li, Catal. Today, 2017, 297, 124–130 CrossRef CAS.
- H. I. Meléndez-Ortiz, L. A. García-Cerda, Y. Olivares-Maldonado, G. Castruita and J. A. Mercado-Silva, Ceram. Int., 2012, 38, 6353–6358 CrossRef.
- H. Song, M. Dai, H. L. Song, X. Wan, X. W. Xu and Z. S. Jin, J. Mol. Catal. A: Chem., 2014, 385, 149–159 CrossRef CAS.
- H. Song, F. Y. Zhang, N. Jiang, M. S. Chen, F. Li and Z. J. Yan, Res. Chem. Intermed., 2018, 44(9), 5285–5299 CrossRef CAS.
- J. R. Parks and J. R. Van Wazer, J. Am. Chem. Soc., 1957, 79, 4890–4897 CrossRef CAS.
- R. John and J. R. Van Wazer, Chem. Rev., 1958, 58, 1011–1046 CrossRef.
- H. Song, M. Dai, H. L. Song, X. Wan and X. Xu, Appl. Catal., A, 2013, 462–463, 247–255 CrossRef CAS.
- S. T. Oyama, X. Wang, Y. K. Lee and W. J. Chun, J. Catal., 2004, 221, 263–273 CrossRef CAS.
- H. Song, M. Dai, H. L. Song, X. Wan and X. Xu, Appl. Catal., A, 2013, 247–255 CrossRef CAS.
- V. O. O. Goncalvesa and P. M. D. Souza, Appl. Catal., B, 2017, 219, 619–628 CrossRef.
- Q. X. Guan, F. F. Wan, F. Han, Z. H. Liu and W. Li, Catal. Today, 2016, 259, 467–473 CrossRef CAS.
- G. X. Yun, Q. X. Guan and W. Li, J. Catal., 2018, 361, 12–22 CrossRef CAS.
- H. Song, J. Gong, H. L. Song and F. Li, Appl. Catal., A, 2015, 505, 267–275 CrossRef CAS.
- L. Song, S. Zhang and Q. Wei, Catal. Commun., 2011, 12, 1157–1160 CrossRef CAS.
- H. Song, M. Dai and Y. T. Guo, Fuel Process. Technol., 2012, 96, 228–236 CrossRef CAS.
| This journal is © The Royal Society of Chemistry 2019 |

