 Open Access Article
A hybrid nanocomposite of CeO2–ZnO–chitosan as an enhanced sensing platform for highly sensitive voltammetric determination of paracetamol and its degradation product p-aminophenol†
Noor B. Almandil a,
Mohamed Ibrahim
 *a,
Hossieny Ibrahim
 *b,
Abdel-Nasser Kawde
 c,
Ibrahim Shehatta
 d and
Sultan Akhtar
 e
e
aDepartment of Clinical Pharmacy Research, Institute for Research and Medical Consultations, Imam Abdulrahman Bin Faisal University, P. O. Box 1982, Dammam 31441, Saudi Arabia. E-mail: msmibrahim@iau.edu.sa
bChemistry Department, Faculty of Science, Assiut University, Assiut, Egypt. E-mail: Hossieny.Ibrahim@aun.edu.eg
cChemistry Department, College of Sciences, King Fahd University of Petroleum and Minerals, Dhahran 31261, Saudi Arabia
dBasic and Applied Scientific Research Center (BASRC), Imam Abdulrahman Bin Faisal University, P. O. Box 1982, Dammam 31441, Saudi Arabia
eElectron Microscopy Unit, Institute for Research and Medical Consultations, Imam Abdulrahman Bin Faisal University, P. O. Box 1982, Dammam 31441, Saudi Arabia
First published on 21st May 2019
Abstract
For the determination of paracetamol (PAR) and its primary degradation product (p-aminophenol, PAP) a highly selective electrochemical sensor was fabricated. A glassy carbon microspheres paste electrode (GCMPE) was modified with a CeO2–ZnO–chitosan hybrid nanocomposite (CeO2–ZnO–CS) which was characterized by X-ray diffraction and transmission electron microscopy. The CeO2–ZnO–CS/GCMPE was characterized by scanning electron microscopy, and cyclic voltammetry. The modified GCMPE exhibits excellent electrocatalytic activity for the determination of PAR and PAP separately or simultaneously, typically at working potentials of 0.38 and 0.09 V vs. Ag/AgCl. The square wave voltammetric response in solutions of near-neutral pH value increases linearly in the 20 nM to 1.8 μM PAR concentration range, and the lower LOD is 0.86 nM. The sensor is shown to enable the determination of PAR even in the presence of a 180-fold excess of PAP. PAR and PAP can also be simultaneously determined, and the LODs for PAR and PAP are 0.98 nM and 9.5 nM, respectively. The results agreed well with data obtained using other electrodes. The sensor is reproducible and stable over eight weeks, and interference by biologically essential compounds is negligible. The method was applied to the determination of PAR in pharmaceutical formulations and in spiked blood serum and urine samples. The relative standard deviations ranged from 97.5 to 102.0%.
1. Introduction
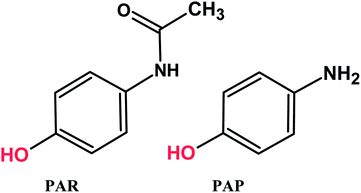
Paracetamol (PAR, N-acetyl-p-aminophenol or acetaminophen) is one of the most extensively used analgesic and antipyretic drugs, but it has no anti-inflammatory activity.1–5 Generally, paracetamol does not exhibit any harmful side effects. However, under improper storage situations, such as acidic or basic media and high temperatures, paracetamol hydrolyzed to p-aminophenol (PAP) (Scheme 1). PAP can be detected in pharmaceutical products as a degradation product of PAR or as a synthetic intermediate and has been reported to have significant nephrotoxic and teratogenic effects.6,7 Therefore, the maximum content of PAP in medicines is limited to 50 ppm by the European8 and United States9 pharmacopeias. Hence, it is very important to develop a simple, fast, economically advantageous, selective and sensitive analytical technique for the determination of PAR and PAP in pharmaceutical products and biological samples to avoid side effects. Various analytical methods have been proposed for the determination of PAR and PAP that include HPLC, LC-MS, UV-Vis spectrometry, spectrophotometry.10–18 Many of these methods are highly sophisticated, time consuming, costly and needs expensive materials and equipment. Among all the reported techniques, electrochemical determination of the present analytes is favorable due to its simplicity, excellent sensitivity, good selectivity, compact size, rapid analysis time and low cost.19–25 Notably, the appearance of various advanced electrode modified nanomaterials significantly enhanced the sensing performance.26–31Due to their attractive potential, nanostructured materials such as nanocomposites have been incorporated into electrochemical sensors for biological and pharmaceutical analyses.29–35 Nanocomposites of a variety of sizes, shapes, and compositions are changing nowadays bioanalytical measurement. Chitosan along with metal oxide nanoparticles has much interest for the fabrication of electrochemical sensor.36–39 Chitosan (CS) is a natural biopolymer which composed of glucosamine and N-acetylglucosamine units and it has a hydrophilic nature compatible with the biomolecules due to its amino and hydroxyl groups. Because of its excellent membrane-forming ability, biocompatibility, and non-toxicity that exhibits high permeability towards the water, CS has been widely used as a modifier, mainly in constructing sensors.40–44 In order to enhance the performance of electrochemical sensor, various metal oxide nanoparticles have been used for electrode fabrication. Compared to other metal oxide nanoparticles, CeO2 nanoparticles have considerable importance because of their unique properties, such as the high oxygen storage capability, low cost, inherent Ce3+/Ce4+ redox cyclic and high catalytic activity.45,46 Also, ZnO nanoparticles have advantages such as efficient surface modification, narrow size distribution, and desirable biocompatibility. In this context, efforts have been made to improve the electrical properties of CeO2 and ZnO nanoparticles by dispersing in CS to fabricate nanocomposite for desired biosensing applications.47–49
To the best of our knowledge, there is no report based on CeO2–ZnO–CS hybrid nanocomposite modified glassy carbon microspheres paste electrode (CeO2–ZnO–CS/GCMPE) for determination of PAR and PAP. In this study, we have developed an effective approach for the fabrication of CeO2–ZnO–CS/GCMPE and applied it as a sensitive sensing interface for electrochemical determination of PAR and PAP. The sensor exhibited excellent electrocatalytic activity for the determination of PAR and PAP separately or simultaneously, attributing to the synergistic effect derived from the unique properties of CeO2, ZnO and CS. Accordingly, an analytical method with high performances, wide linear range, low detection, and excellent selectivity was developed. The method was applied for the determination of PAR in commercial tablet samples and human biological fluids.
2. Experimental
2.1. Reagents and solutions
Paracetamol, chitosan and cerium nitrate (Ce(NO3)3·6H2O) were obtained from Sigma-Aldrich Chemicals (St. Louis, Mo, USA). Zinc acetate (Zn(C2H3O2)2·2H2O), glassy carbon microspheres (GCMs, particle size 0.4–12 micron), 4-aminophenol and paraffin oil were obtained from Alfa Aesar (Ward Hill, MA). Standard stock solutions were prepared separately by dissolving paracetamol and p-aminophenol in anhydrous ethanol and kept in darkness at 4 °C. Phosphate buffer solutions (PBS, 0.2 M) of pH 2.0–8.0 were prepared from orthophosphoric acid and its salts and used as a supporting electrolyte in the current study. All aqueous solutions were freshly prepared with doubly-distilled water from a Millipore system (Milli-pore Inc., 18.2 MΩ cm).2.2. Instrumentation
All voltammetric measurements were carried out using a three-electrode cell (PAR Model 303A) with an Ag/AgCl (saturated KCl) as a reference electrode, CeO2–ZnO–CS/GCMPE as a working electrode and platinum wire as an auxiliary one. Cyclic voltammetry (CV) and square wave voltammetry (SWV) were done using a polarographic analyzer (EG&G Princeton Applied Research, model 384-B) controlled by 394 software (Oak Ridge, TN, USA). A digital radiometer pH meter (Jenway 3310, accurate to ± 0.02 unit) was used for pH measurements. Powder X-ray diffraction (XRD) studies of the prepared CeO2–ZnO nanocomposite were performed on a PW1729 Philips XRD diffractometer using the copper source (2θ between 4° and 80°). Scanning electron microscopy (SEM) was examined using a FEI, INSPECT S50 machine (Czech Republic) with an accelerating voltage of 15 kV. Transmission electron microscopy (TEM) micrographs were obtained using a FEI, TEM (Czech Republic) operating at 80 kV.2.3. Preparation of CeO2–ZnO nanocomposite
CeO2–ZnO nanocomposite was prepared by using a hydrothermal process. In brief, 4.0 g of Ce(NO3)3·6H2O and 1.0 g Zn(C2H3O2)2·2H2O were dissolved in 35 mL of diethanolamine (DEA). The resulting solution was stirred for 5 h followed by hydrothermal treatment at 180 °C for 24 h in a Teflon-lined stainless-steel autoclave. After cooling, the product was collected by centrifugation, washed extensively with ultrapure water and ethanol, and dried in an oven at 60 °C for 20 h. The resultant powder was ground and heat at 450 °C for 3 h. CeO2 and ZnO nanoparticles were also prepared using the same procedure.2.4. Preparation of CeO2–ZnO–CS hybrid nanocomposite
In a typical synthesis process, 10 mg of chitosan (CS) flakes was dispersed in the aqueous acetic acid (2%, v/v) using ultra-sonication for 2 h at room temperature. Subsequently, 0.5 g CeO2–ZnO nanocomposite was added, and the reaction mixture was again sonicated for 1 h. The resulting viscous mixture was cast in a circular glass dish and the solvent allowed evaporating at room temperature. Finally, the solidified hybrid was kept in a constant temperature oven at 60 °C for 3 h. Thus, the achieved hybrid nanocomposite was named CeO2–ZnO–CS.2.5. Fabrication of CeO2–ZnO–CS/GCMPE
The glassy carbon microspheres paste electrode modified with CeO2–ZnO–CS was prepared by hand mixing 72% GCMs, 20% paraffin oil and 8% of CeO2–ZnO–CS in an agate mortar for about 40 min to get homogeneous glassy carbon microspheres paste. The paste was then pressed firmly into the cavity of a Teflon tube (3 mm diameter) to a depth of 6 mm, and the new surface was smoothed against clean paper. A copper wire inserted into the center of the electrode body provided an electrical contact. The procedure for CeO2–ZnO–CS/GCMPE sensor fabrication is shown in Scheme 2.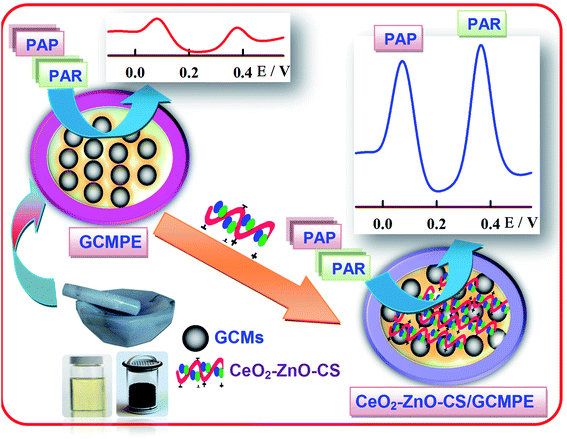 | ||
| Scheme 2 Schematic representation of CeO2–ZnO–CS/GCMPE fabrication and its electrochemical application. | ||
2.6. Experimental procedures
A certain volume of PAR stock solution and 5 mL of PBS (0.2 M) were added into an electrochemical cell, and then the three-electrode system was installed. CV was carried out from 0.0 to 0.8 V with scan rate of 100 mV s−1. The SWV was recorded from −0.2 to 0.8 V for PAR determination for simultaneous determination of PAR and PAP. The parameters for SWV were as follows: frequency, 120 Hz; pulse height, 35 mV; accumulation time, 60 s and accumulation potential, −0.2 V.2.7. Real samples assay procedure
The proposed procedure was applied for the detection of PAR in human urine samples which were collected from patients after 4 h of intake of Paracetamol® tablet (500 mg). The urine samples were diluted 10 times with phosphate buffer (pH 7.0) to reduce the matrix effects and then analyzed without any further pretreatment. Drug-free human serum samples were collected from healthy volunteers at the Hospital of Assiut University. The samples were centrifuged for 10 min at 3000 rpm and treated with acetonitrile as a precipitating agent to dispose of protein residues, and then the supernatant was taken care. The diluted serum (five times with phosphate buffer pH 7.0) sample was spiked with different amounts of PAR. The recovery tests were carried out using SWV for the determination of PAR in human serum samples.2.8. Validation in pharmaceutical samples
Six tablets of the commercial pharmaceuticals Calmalgine®, Paramol® (Misr Phar. Co, Egypt), Panadol®, Abimol® (GlaxoSmithKline), Paracetamol (Adco) and Novaldol® (Sanofi) were powdered in a mortar. Then, tablets were dissolved in anhydrous ethanol. After sonication for 20 min, these solutions were filtered into a 100 mL volume calibrated flask, and the residue washed several times with the appropriate solvent. An aliquot of the solution was then analyzed according to the proposed voltammetric procedure.3. Results and discussion
3.1. Characterization of CeO2–ZnO nanocomposite
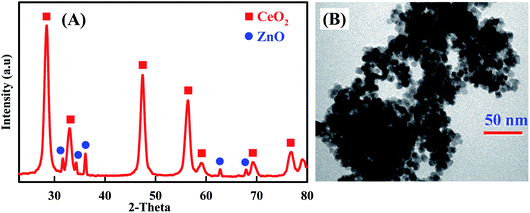
Additional evidences supporting the preparation of CeO2–ZnO nanocomposite are supplied by XRD and TEM. As shown in Fig. 1A, XRD pattern of CeO2–ZnO showed the presence of diffraction peaks are attributed to (111), (200), (220) and (311) lattice planes of CeO2.45,46 The observed diffraction peaks are consistent with the JCPDS card no. 04-015-2674, demonstrating it has cubic fluorite structure. Similarly, XRD patterns of ZnO detected the presence of hexagonal wurtzite phase of ZnO, with peaks matching to (100), (002), (101), (103) and (112), lattice planes (JCPDS card no. 04-007-9805).50,51 Moreover, the pattern displayed sharp and well-defined diffraction reflections which confirmed that the prepared nanocomposite is well crystalline. These results are well matched with the reported literature.52,53 On the other hand, the morphology of the prepared CeO2–ZnO nanocomposite was further characterized by TEM (Fig. 1B). The morphology of the CeO2–ZnO nanocomposite was uniform with well-distributed elliptical/spherical particles with an average particle size of about 14.23 nm.3.2. The surface morphology of CeO2–ZnO–CS/GCMPE
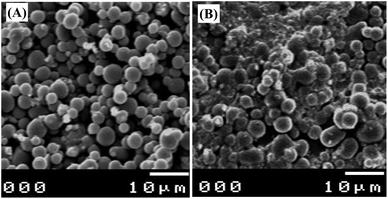
The surface morphologies of bare GCMPE and CeO2–ZnO–CS/GCMPE were also characterized using SEM. Fig. 2 displays a significant change in the surface structure of the bare and the modified electrode. The obtained SEM images of the GCMPE was characterized by a surface of non-porous spherically shaped glassy carbon powder (Fig. 2A). However, Fig. 2B shows that CeO2–ZnO–CS coated a layer uniformly on the surface of glassy carbon microspheres. Moreover, CeO2–ZnO–CS possesses a large surface area, numerous active sites, and good electric conductivity. Therefore, the oxidation current of PAR enhances at CeO2–ZnO–CS/GCMPE as compared to GCMPE.3.3. Electrochemical activities of modified electrodes
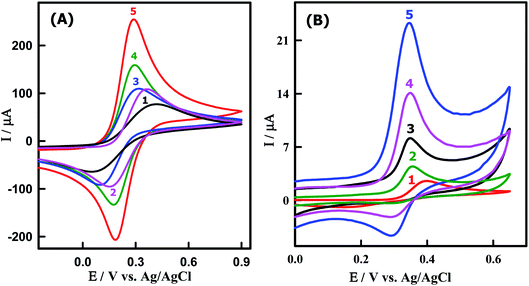
The redox couple of [Fe(CN)6]3−/4− was chosen to characterize the electrochemical performances of the working electrodes using CV in 0.1 M KCl solution. In this context, the electron transfer process of the [Fe(CN)6]3−/4− is strongly affected by the microstructure and the surface chemistry of the working electrode materials near the Fermi level.54 Fig. 3A illustrates the CVs of [Fe(CN)6]3−/4− on a bare GCMPE (curve 1) and modified electrodes as ZnONPs/GCMPE (curve 2), CeO2NPs/GCMPE (curve 3), CeO2–ZnO/GCMPE (curve 4) and CeO2–ZnO–CS/GCMPE (curve 5). It was evident that [Fe(CN)6]3−/4− exhibited a poor electrochemical behavior (IPa = 79.99 μA) on GCMPE (curve 1), with a large peak-to-peak potential separation (ΔEP = 345 mV), broadened wave shape and high capacitive background current. On the other hand, the modified GCMPEs such as ZnONPs/GCMPE, CeO2NPs/GCMPE, and CeO2–ZnO/GCMPE showed somewhat improved the electrochemical response of [Fe(CN)6]3−/4−. But, after modification of the bare GCMPE with CeO2–ZnO–CS hybrid nanocomposite, the current response of the [Fe(CN)6]3−/4− was significantly increased (IPa = 233.3 μA), and the ΔEP was decreased to 107 mV (curve 5), in compared to that of GCMPE. This may be due to the presence of CeO2–ZnO–CS which enhance the surface area and the electron transfer process of the modified electrode. Thus, CeO2–ZnO–CS hybrid nanocomposites have attracted much interest for the modification of a GCMPE sensor due to the synergistic effect between or among the different properties.3.4. Determination of surface area
The surface area of bare GCMPE and CeO2–ZnO–CS/GCMPE was calculated to determine the efficacy of the surface modification procedure. For this purpose, the influence of scan rate on the peak currents of CeO2–ZnO–CS/GCMPE is further studied using CV in 0.1 M KCl solution of 5 mM [Fe(CN)6]3−/4− (Fig. S1A†). As the scan rate increases from 50 to 450 mV s−1, the current response increased and the ratio between the anodic (IPa) and the cathodic (IPc) peak currents is near unity, characteristic of a reversible electrochemical reaction of the redox couple on the CeO2–ZnO–CS/GCMPE surface. Fig. S1B† shows that the peak currents were increased linearly with the square root of the scan rates, suggesting that the reaction is diffusion controlled.According to the Randles–Sevcik equation, the effective surface areas of the CeO2–ZnO–CS/GCMPE and bare GCMPE were calculated from CV using [Fe(CN)6]3−/4− redox system:55 IPa = 2.69 × 10⁵n3/2AD1/2ν1/2C, where n is the number of electron (n = 1), IPa (A) is the anodic peak current, D is diffusion coefficient (D = 7.6 × 10⁻⁶ cms−1), A (cm2) is the surface area of the electrode, ν (V s−1) is the scan rate, C is the concentration of [Fe(CN)6]3−/4− (mol cm−3). Subsequently from the slope of IP − ν½, the values of A can be estimated to be 0.070 cm2 and 0.826 cm2 for bare GCMPE and CeO2–ZnO–CS/GCMPE, respectively (Table S1†). These results indicate that the effective surface area of CeO2–ZnO–CS/GCMPE increased significantly, ≈12 times greater than that of the bare GCMPE.
3.5. Cyclic voltammetric response of PAR at the modified electrodes
To evaluate the electrocatalytic activity of the CeO2–ZnO–CS/GCMPE toward the oxidation of PAR, CVs were obtained in comparison with ZnONPs/GCMPE, CeO2NPs/GCMPE, CeO2–ZnO/GCMPE and bare GCMPE in the presence of 3.85 μM PAR, as shown in Fig. 3B. At the bare GCMPE, only a very small oxidation peak current is observed at about 398 mV and the current of 2.33 μA (curve 1). As the result shows, the partially modified electrodes ZnONPs/GCMPE, CeO2NPs/GCMPE and CeO2–ZnO/GCMPE have some catalytic character on PAR, respectively, to some extent (curves 2–4), though the current response increased than that at bare GCMPE. However, at a completely modified CeO2–ZnO–CS/GCMPE in the presence of PAR, a sharper and more well-defined oxidation peak appeared (curve 5) and the electrocatalytic oxidation peak potential of PAR decreased even lower to 345 mV and about 8-fold enhancement of peak current (18.41 μA) of that at GCMPE. These indicate that CeO2–ZnO–CS/GCMPE sensor has a stronger electrocatalytic activity on PAR than either modified GCMPE which was attributed to the excellent conductivity and large surface area of CeO2–ZnO–CS/GCMPE. It is clearly shown that the presence of CeO2–ZnO nanocomposite and CS improve the characteristics of PAR oxidation. Hence, the CeO2–ZnO–CS nanocomposite yields a substantially higher sensitivity for the electrochemical sensing of PAR.3.6. Optimization of effective parameters on the sensitivity of the electrochemical sensor
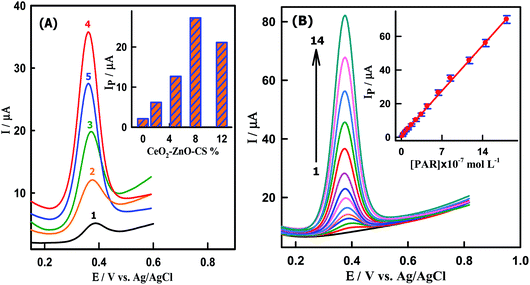
The effect of solution pH on the redox reaction of PAR at the CeO2–ZnO–CS/GCMPE was examined in the pH range of 3.0–8.0 using SWV (Fig. S2†). The oxidation peak current increased gradually with an increasing pH value from 3.0 to 7.0, but a decrease in the response is observed after pH 7.0 due to electrochemical inactivity of the hydroxylated mediator at higher pH.56 Thus, pH 7.0 was chosen for the subsequent analytical experiments for sensitivity determination. As shown in Fig. S2A,† a negative shift of the redox peaks potentials is observed when the pH value is increased. A linear relationship between the peak potential (EP) and solution pH was established with the linear regression equation as: EP (V) = 0.719 − 0.054 pH (R2 = 0.9994) (Fig. S2B†). The slope value of −54.0 mV pH−1 is close to the theoretical value (−59.0 mV pH−1), suggesting equal numbers of proton and electron are involved in the redox reaction of PAR. Based on the equation dEP/dpH = 0.059x/αn, the proton number (x) was estimated to be 2. Thus, the oxidation reaction of PAR on the CeO2–ZnO–CS/GCMPE is a two-protons and two-electrons process, which is in good agreement with the literature reports.21,22The amount of CeO2–ZnO–CS nanocomposite can change the properties and functions of the electrode surface. As shown in Fig. 4A, the electrochemical oxidation of PAR on the CeO2–ZnO–CS/GCMPE was performed by using five modified electrodes containing different quantities of nanocomposite (2 to 12% CeO2–ZnO–CS) by SWV. The oxidation peak current increased from 2.1 to 27.28 μA with increased amounts of CeO2–ZnO–CS from 2 to 8%, respectively, confirming that CeO2–ZnO–CS increase the active surface area of GCMPE (Fig. 4A, inset). The oxidation peak current reached the maximum when the concentration of CeO2–ZnO–CS was 8%. When the concentration of CeO2–ZnO–CS exceeded 8% a decrease in the oxidation peak current of PAR is observed (21.14 μA). This is presumably due to the reduction of the conductivity of the sensor as a result of a decrease in the GCMs content in the paste. Consequently, 8% of CeO2–ZnO–CS was chosen as an optimal concentration in the modification of the GCMPE surface.
Investigation of the effect of scan rate (ν) on the redox process of PAR at the CeO2–ZnO–CS/GCMPE using CV exhibited the anodic peak currents of PAR increased linearly with the scan rates in the range of 100–500 mV s−1 (Fig. S3A†). A straight line is observed from the relationship of log![[thin space (1/6-em)]](https://www.rsc.org/images/entities/char_2009.gif) Ip vs. log
Ip vs. log![[thin space (1/6-em)]](https://www.rsc.org/images/entities/char_2009.gif) ν (Fig. S3B†), with a linear regression equation: log
ν (Fig. S3B†), with a linear regression equation: log![[thin space (1/6-em)]](https://www.rsc.org/images/entities/char_2009.gif) IP (μA) = 0.984
IP (μA) = 0.984![[thin space (1/6-em)]](https://www.rsc.org/images/entities/char_2009.gif) log
log![[thin space (1/6-em)]](https://www.rsc.org/images/entities/char_2009.gif) ν (mV s−1) – 0.818 (R2 = 0.9947). The slope value of 0.984 is higher than the theoretical value of 0.5 for a typical diffusion-controlled process.57 This result indicates that the electrochemical reaction of PAR on the CeO2–ZnO–CS/GCMPE is a surface-controlled process. On the other hand, the oxidation peak potential of PAR shifted towards more positive values with increasing the scan rate which confirms the irreversibility of the electrode process.58 The adsorbed amount of electroactive PAR (ΓPAR, mol cm−2) on the surface of CeO2–ZnO–CS/GCMPE and bare GCMPE was further calculated by the following equation:59 IP = n2F2νAΓPAR/4RT. Based on the relationship of IP with ν, the surface concentration of PAR (ΓPAR) on the CeO2–ZnO–CS/GCMPE was obtained to be 5.45 × 10⁻¹⁰ mol cm−2, which was larger than 6.90 × 10⁻¹¹ mol cm−2 on GCMPE, indicating good adsorptivity and large surface area of the CeO2–ZnO–CS/GCMPE.
ν (mV s−1) – 0.818 (R2 = 0.9947). The slope value of 0.984 is higher than the theoretical value of 0.5 for a typical diffusion-controlled process.57 This result indicates that the electrochemical reaction of PAR on the CeO2–ZnO–CS/GCMPE is a surface-controlled process. On the other hand, the oxidation peak potential of PAR shifted towards more positive values with increasing the scan rate which confirms the irreversibility of the electrode process.58 The adsorbed amount of electroactive PAR (ΓPAR, mol cm−2) on the surface of CeO2–ZnO–CS/GCMPE and bare GCMPE was further calculated by the following equation:59 IP = n2F2νAΓPAR/4RT. Based on the relationship of IP with ν, the surface concentration of PAR (ΓPAR) on the CeO2–ZnO–CS/GCMPE was obtained to be 5.45 × 10⁻¹⁰ mol cm−2, which was larger than 6.90 × 10⁻¹¹ mol cm−2 on GCMPE, indicating good adsorptivity and large surface area of the CeO2–ZnO–CS/GCMPE.
3.7. Optimization of the experimental conditions
The dependence of peak current on square wave scan increment (Es), frequency (f), pulse height (Ea), accumulation time (tacc) and accumulation potential for the response of PAR in phosphate buffer of pH 7.0 at the CeO2–ZnO–CS/GCMPE were studied. Thus, SW voltammograms of PAR at the CeO2–ZnO–CS/GCMPE were recorded at various parameters. Ea was varied from 5 to 40 mV by fixing the f at 120 Hz, Es at 8 mV and tacc at 30 s, maximum enhancement of the peak current was achieved at 35 mV (Fig. S4†). Hence, 35 mV was chosen as the optimum pulse height. The influence of frequency on the current response was also optimized which reveals that the anodic peak current increased linearly with the frequency in the range of 20–120 Hz (Fig. S4†). Thus, frequency (120 Hz) was chosen to enhance the sensitivity without any deformation of the peak or the background. The optimized conditions were f = 120 Hz, Es = 8 mV, Ea = 35 mV, accumulation time 60 s and accumulation potential −0.2 V.3.8. Analytical determination of PAR individually
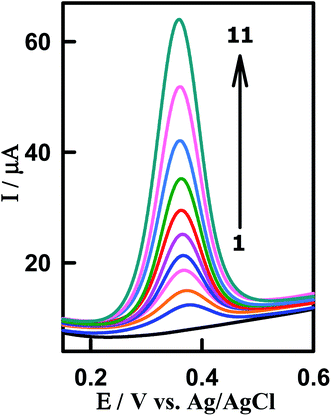
To investigate the relationship between the oxidation peak current and concentration of PAR, the sensitive SWV measurements at various concentrations of PAR were performed on the CeO2–ZnO–CS/GCMPE. As shown in Fig. 4B, under the optimal conditions, the oxidation peak current is found to increase with increasing PAR concentration. The calibration plot exhibited a linear response ranged from 1.99 × 10⁻⁸ M to 1.82 × 10⁻⁶ M as shown in Fig. 4B (inset) and Table 1. The detection limit was estimated to be 8.57 × 10⁻¹⁰ M at signal/noise ratio of 3, which is the lowest LOD reported for the electroanalytical detection of PAR to date using an electrochemical technique. The detection limit, linear range and solution pH used for detection of PAR were compared with published PAR electrochemical sensors (Table S2†). Obviously, the CeO2–ZnO–CS/GCMPE offers rapid electrode preparation, economic electrode materials, reproducible and stable electrode compared to other modified electrodes that involve tedious immobilization techniques and expensive materials for the preparation of the modified electrode. Moreover, this sensor can be applied to the determination of PAR at physiological pH values.| Parameters | Individual | Simultaneous | |
|---|---|---|---|
| PAR | PAR | PAP | |
| Linearity range | 1.99 × 10⁻⁸ to 1.82 × 10⁻⁶ | 2.0 × 10⁻⁸ to 1.94 × 10⁻⁶ | 1.99 × 10⁻⁷ to 1.47 × 10⁻⁵ |
| Slope (μA M−1) | 3.85 × 10⁷ | 2.44 × 10⁷ | 2.52 × 10⁶ |
| SE of slope | 0.04 | 0.017 | 0.019 |
| Intercept (μA) | 0.66 | - 0.16 | 0.38 |
| SE of intercept | 0.32 | 0.15 | 0.13 |
| Coefficient of determination (R2) | 0.9988 | 0.9994 | 0.9993 |
| LOD (M) | 8.57 × 10⁻¹⁰ | 9.84 × 10⁻¹⁰ | 9.52 × 10⁻⁹ |
| Repeatability of peak current (RSD%) | 1.76 | 1.91 | 1.65 |
| Reproducibility of peak current (RSD%) | 1.84 | 1.75 | 1.32 |
3.9. Electrochemical behavior of PAR and PAP on the modified electrodes
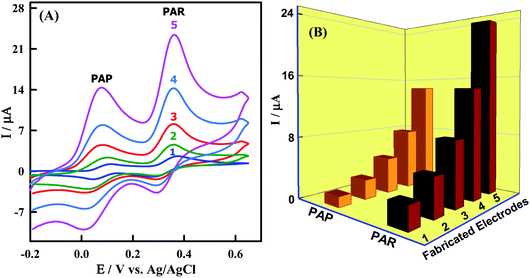
The electrochemical behaviors of PAR and PAP at bare GCMPE and different modified GCMPE were investigated by using CV. Fig. 5A shows CVs of 3.85 μM PAR and 12.24 μM PAP on a bare GCMPE (curve 1) and modified electrodes as ZnONPs/GCMPE (curve 2), CeO2NPs/GCMPE (curve 3), CeO2–ZnO/GCMPE (curve 4) and CeO2–ZnO–CS/GCMPE (curve 5) in phosphate buffer (pH 7). The peak to peak separation (ΔEP) values for PAR and PAP were found to be 91 mV and 60 mV at the bare GCMPE (curve 1) and 63 mV and 60 mV at CeO2–ZnO–CS/GCMPE (curve 5) respectively, indicating that CeO2–ZnO–CS/GCMPE exhibited better ΔEP, on other words lower the ΔEP value higher will be the electron transfer rate. Furthermore, the electrochemical oxidation of PAR and PAP at CeO2–ZnO–CS/GCMPE (curve 5) showed a significant increase in redox peak current with reducing the ΔEP as compared to the bare GCMPE (curve 1), this indicates the fast electron transfer process of PAR and PAP at the CeO2–ZnO–CS/GCMPE. The voltammetric response of PAR and PAP was found to greatly improve at the CeO2–ZnO–CS/GCMPE (Fig. 5B). The separation between the two anodic peaks at CeO2–ZnO–CS/GCMPE was large enough for the simultaneous determination of PAR and PAP. It definitely reveals that the CeO2–ZnO–CS/GCMPE shows an efficient electrocatalytic activity, high selectivity and better sensitivity for PAR and PAP, which due to the large active surface area of the proposed working electrode.3.10. Simultaneous determination of PAR and PAP
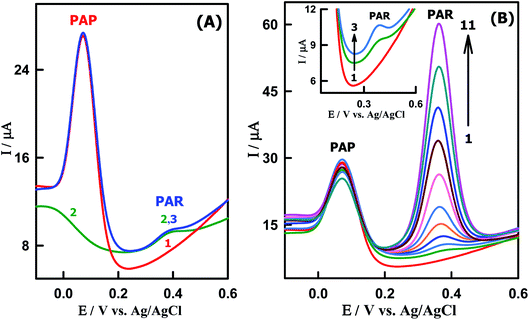
Since PAP is the primary hydrolytic degradation product of PAR which can cause teratogenic effect and nephrotoxicity, it is necessary for an electrochemical sensor to detect PAR in the presence of PAP. Under the optimized conditions, SWVs of low concentration of PAR (39.4 nM) was studied in the presence of a large excess of PAP (7.05 μM) at the CeO2–ZnO–CS/GCMPE in the potential range of −0.2 V to +0.6 V at pH 7.0 (Fig. 6A). Two well defined separate oxidation peaks corresponding to PAR and PAP were appeared at the same potentials equal to that without the other species. This indicates that the presence of higher concentration of PAP did not interfere with the electrochemical response of PAR and the sensitivity of CeO2–ZnO–CS/GCMPE towards PAR remained almost the same without any change.The SW voltammograms of PAR in the presence of a constant concentration of 7.05 μM PAP were also investigated as shown in Fig. 6B. In this context, the oxidation peak current of PAR increased linearly with its concentration, while the response of PAP remained almost constant and corresponding calibration plot have been displayed in Fig. S5.† The slope of the linear regression line for the calibration graph of PAR was found to be 2.78 × 10⁷ μA M−1 (R2 = 0.9997), which is very close to the value attained in the absence of PAP (3.85 × 10⁷ μA M−1), suggesting that the electrochemical responses of these compounds at the CeO2–ZnO–CS/GCMPE are independent. So, this proposed electrode can be applied for the detection of PAR in the presence of PAP without significant interferences.
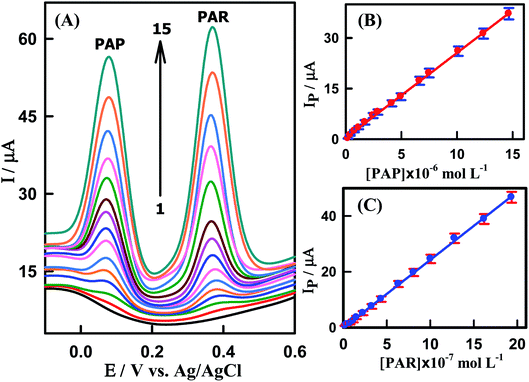
After this previous study, simultaneous determination of various concentrations of PAP and PAR was also carried out at CeO2–ZnO–CS/GCMPE in phosphate buffer of pH 7.0 using SWV. As illustrated in Fig. 7A, the SWV response of CeO2–ZnO–CS/GCMPE shows two peaks corresponding to the oxidation of PAR and PAP appeared at 380 mV and 71 mV, respectively, with the potential difference of 309 mV. This anodic peak-to-peak potential separation on CeO2–ZnO–CS/GCMPE; enough for their simultaneous determination in samples containing these two compounds. The calibration plots for PAR and PAP (Fig. 7B and C) display excellent linearity over a wide concentration ranges of 2.0 × 10⁻⁸ to 1.94 × 10⁻⁶ M and 1.99 × 10⁻⁷ to 1.47 × 10⁻⁵ M, respectively. The calculated LODs were determined to be 9.84 × 10⁻¹⁰ M and 9.52 × 10⁻⁹ M (calculated by 3σ) for PAR and PAP respectively, which are lower than these of the previous reports (Table S2†). The SWV method validation parameters for the standard linearity of the determination of PAR individually and simultaneously at CeO2–ZnO–CS/GCMPE have been calculated and reported in Table 1. These results indicate the excellent selectivity of the CeO2–ZnO–CS/GCMPE based electrochemical sensing interface.
3.11. Repeatability, reproducibility, and stability of CeO2–ZnO–CS/GCMPE
Repeatability, reproducibility, and stability are three important characteristics for the modified electrode. As shown in Table 1, the obtained RSD values of peak current (RSD% < 1.91) represent satisfactory precision and accuracy of the proposed method, indicating excellent repeatability and reproducibility of CeO2–ZnO–CS/GCMPE. Additionally, the long-term stability of CeO2–ZnO–CS/GCMPE was also explored by measuring the decrease in the peak current during repetitive SWV measurements of 3.85 × 10⁻⁶ M PAR when the modified electrode was stored at room temperature throughout 8 weeks (Fig. S6†). As shown inset of Fig. S6,† the calibrated CV response indicated a good stability, where, the electrode retained 97.87% of its original intensity, indicating the reliable stability of the sensor.3.12. Interferences
In biological samples, PAR generally suffers from the interferences of some biologically essential compounds such as ascorbic acid, salicylic acid, glutamic acid, aspartic acid, tyrosine, tryptophan, alanine, phenylalanine, cysteine, glucose, citric acid, cytosine, urea and serine. Thus, SWV experiments were carried out for a solution containing 1.20 × 10⁻⁷ M PAR in the presence of different amounts of these interferents to test the selectivity of the CeO2–ZnO–CS/GCMPE sensing platform. The results are compiled in Table S3† and show that the coexistence of higher concentration of these interferents have no interference on the PAR response and mean recoveries in the range from 97.69 to 102.25% were obtained. Therefore, the proposed electrode CeO2–ZnO–CS/GCMPE has a good selectivity towards PAR detection in the presence of several interfering substances.3.13. Robustness
The robustness was examined by evaluating the resistivity of analytical results to the small change of operational parameters such as pulse height, accumulation potential, and pH on recovery and the standard deviation of the determination of 1.20 × 10⁻⁷ M PAR. The obtained results (Table S4†) of high percentage recoveries (close to 100%) with low values of RSD% were not significantly affected within the studied range of variations of some experimental conditions revealing that the reliability of the proposed SWV procedure using CeO2–ZnO–CS/GCMPE for the assay of PAR, is considered robust.3.14. Analytical applications of the proposed method
To evaluate the validity of the CeO2–ZnO–CS/GCMPE, the proposed voltammetric method was utilized for the determination of PAR in six different commercial pharmaceutical samples (tablets). Preparation of sample solution was as same as mentioned in the experimental part so that the concentration of PAR was in the working range and then SWV studies were performed using CeO2–ZnO–CS/GCMPE (Fig. S7†). Under the optimum condition, the concentration of PAR in the six pharmaceutical formulations was determined with the help of the calibration plot. The results are in good agreement with the manufacturers' stated contents of PAR (Table S5†), confirming that the drug excipients do not significantly interfere with the proposed method, as well as the CeO2–ZnO–CS/GCMPE is very reliable and sensitive enough for the determination of PAR in real samples.To investigate the applicability and reliability of the modified sensor CeO2–ZnO–CS/GCMPE for the electrocatalytic assay of PAR in spiked human biological fluids, we used urine and blood serum samples. The technique was applied for the detection of PAR in human urine samples which were collected from patients after 4 h of the intake of Paracetamol® tablet (500 mg). The urine samples were diluted 10 times with phosphate buffer (pH 7.0) to reduce the matrix effects. A typical SWVs of urine sample 1 at CeO2–ZnO–CS/GCMPE is represented in Fig. 8. A well-defined peak of PAR is noticed at EP = 377 mV. Standard addition method was used to the detection of PAR in the urine sample of the patient and carried out by spiking a certain amount of the PAR standard solution to urine samples. The electrochemical signal (peak at EP = 377 mV) increases significantly after standard solutions were added, which confirming that it corresponds to the oxidation of PAR (Fig. 8). The results, before and after spiking, were tabulated in Table 2, with a satisfactory recovery in the range of 98.48 to 101.96%.
| Sample | Spiked (1 × 10⁻⁷ M) | Detected (1 × 10⁻⁷ M) | RSD% | Recovery (%) |
|---|---|---|---|---|
| Urine 1 | 0.0 | 2.75 | 1.47 | — |
| 2.0 | 4.81 | 1.86 | 101.26 | |
| 4.0 | 6.69 | 1.37 | 99.11 | |
| 6.0 | 8.90 | 2.10 | 101.71 | |
| Urine 2 | 0.0 | 2.59 | 1.59 | — |
| 2.0 | 4.68 | 1.78 | 101.96 | |
| 4.0 | 6.49 | 2.21 | 98.48 | |
| 6.0 | 8.51 | 1.93 | 99.10 |
Furthermore, the performance of the proposed sensor (CeO2–ZnO–CS/GCMPE) for the determination of PAR in human blood serum sample was also examined. The determination of PAR concentration was analyzed according to the analytical procedure (as described in the experimental section) using SWV and no PAR was detected in the serum sample. So, different amounts of the PAR standard solution were spiked into, and the calibration plot is shown in Fig. S8.† A linear dynamic range of 1.99 × 10⁻⁸ to 1.57 × 10⁻⁶ M PAR is obtained at CeO2–ZnO–CS/GCMPE with a coefficient of determination of R2 = 0.9994 (Table S6†). The results display also that the modified sensor gives satisfactory recoveries for the determination of PAR in a serum sample (from 97.46% to 100.77%) as cited in Table S7.† The obtained RSD% and the recovery values of the spiked samples were acceptable and confirmed the high sensitivity and selectivity of the modified electrode (CeO2–ZnO–CS/GCMPE) for the determination PAR in biological samples.
4. Conclusion
In this study, a novel electrochemical sensor for the highly sensitive determination of PAR and PAP was fabricated based on CeO2–ZnO–CS hybrid nanocomposite modified glassy carbon microspheres paste electrode (CeO2–ZnO–CS/GCMPE). The constructed CeO2–ZnO–CS/GCMPE exhibited a strongly electrocatalytic activity toward the oxidation of PAR and PAP compared to the bare GCMPE. The developed method was effectively applied for the determination of PAR and PAP separately or simultaneously, which is more significant in the quality control of the synthetic process of PAR. Based on the excellent properties of CeO2–ZnO–CS/GCMPE, the fabricated electrode had long-term stability, good reproducibility, high sensitivity, good selectivity, easy surface regeneration, and fabrication and low in cost compared to the literature methods. This modified electrode was effectively applied for the electrochemical determination of PAR in real pharmaceutical preparations and human serum and urine samples with satisfactory results. Superior characteristics like sensitivity, selectivity, low cost, practical utility recommend that the CeO2–ZnO–CS/GCMPE is a potent promising tool for the determination of another drug.Live subject statement
All experiments were performed in compliance with the relevant laws and Assiut University's guidelines. The analysis of PAR in real samples such as human serum, human urine were approved by the ethics committees of Assiut Medical University – Joint Institutional Review Board. All of the subjects signed an informed consent form before examination.Conflicts of interest
There are no conflicts to declare.Acknowledgements
The authors gratefully acknowledge the financial support of the Imam Abdulrahman Bin Faisal University, Saudi Arabia (Project No. 2018-086-IRMC).References
- J. E. F. Reynolds and K. Parfitt, Martindale, the extra pharmacopoeia, thirty, London, Royal Pharmaceutical Society xxi, 1996 Search PubMed.
- S. P. Clissold, Drugs, 1986, 32, 46–59 CrossRef PubMed.
- C. J. Nikles, M. Yelland, C. Del Mar and D. Wilkinson, Am. J. Ther., 2005, 12, 80–91 CrossRef.
- K. Brandt, Drugs, 2003, 63, 23–41 CrossRef CAS.
- Q. Wan, X. Wang, F. Yu, X. Wang and N. Yang, J. Appl. Electrochem., 2009, 39, 785–790 CrossRef CAS.
- J. Forshed, F. O. Andersson and S. P. Jacobsson, J. Pharm. Biomed. Anal., 2002, 29, 495–505 CrossRef CAS PubMed.
- A. Yesilada, H. Erdogan and M. Ertan, Anal. Lett., 1991, 24, 129–138 CrossRef CAS.
- European Pharmacopoeia (Ph. Eur.), 9th edition|EDQM, (n.d.),https://www.edqm.eu/en/european-pharmacopoeia-ph-eur-9th-edition, accessed October 4, 2018.
- United States Pharmacopeia 39th edition National Formulary 34: USB, (n.d.),https://tsoshop.co.uk/Medicine/Pharmacopoeia/United-States-Pharmacopeia/?DI=644572, accessed November 15, 2018.
- A. Marın, E. Garcıa, A. Garcıa and C. Barbas, J. Pharm. Biomed. Anal., 2002, 29, 701–714 CrossRef.
- A. R. Khaskheli, A. Shah, M. I. Bhanger, A. Niaz and S. Mahesar, Spectrochim. Acta, Part A, 2007, 68, 747–751 CrossRef PubMed.
- T. Németh, P. Jankovics, J. Németh-Palotás and H. K. Hoszegi-Szalai, J. Pharm. Biomed. Anal., 2008, 47, 746–749 CrossRef PubMed.
- L. H. Santos, P. Paíga, A. N. Araújo, A. Pena, C. Delerue-Matos and M. C. B. Montenegro, J. Chromatogr. B: Anal. Technol. Biomed. Life Sci., 2013, 930, 75–81 CrossRef CAS PubMed.
- L. Monser and F. Darghouth, J. Pharm. Biomed. Anal., 2002, 27, 851–860 CrossRef CAS PubMed.
- R. M. de Carvalho, R. S. Freire, S. Rath and L. T. Kubota, J. Pharm. Biomed. Anal., 2004, 34, 871–878 CrossRef CAS PubMed.
- F. A. Mohamed, M. A. AbdAllah and S. M. Shammat, Talanta, 1997, 44, 61–68 CrossRef CAS PubMed.
- A. Safavi and O. Moradlou, Anal. Lett., 2004, 37, 2337–2349 CrossRef CAS.
- H. Montaseri and P. B. Forbes, TrAC, Trends Anal. Chem., 2018, 108, 122–134 CrossRef CAS.
- A. R. Khaskheli, J. Fischer, J. Barek, V. Vyskočil and M. I. Bhanger, Electrochim. Acta, 2013, 101, 238–242 CrossRef CAS.
- B. Habibi, M. Jahanbakhshi and M. Abazari, J. Iran. Chem. Soc., 2014, 11, 511–521 CrossRef CAS.
- A. U. Alam, Y. Qin, M. M. Howlader, N.-X. Hu and M. J. Deen, Sens. Actuators, B, 2018, 254, 896–909 CrossRef CAS.
- L. Ruiyi, Z. Haiyan, L. Zaijun and L. Junkang, Microchim. Acta, 2018, 185, 145 CrossRef PubMed.
- S. Mehretie, S. Admassie, T. Hunde, M. Tessema and T. Solomon, Talanta, 2011, 85, 1376–1382 CrossRef CAS PubMed.
- S. P. Kumar, K. Giribabu, R. Manigandan, S. Munusamy, S. Muthamizh, A. Padmanaban, T. Dhanasekaran, R. Suresh and V. Narayanan, Electrochim. Acta, 2016, 194, 116–126 CrossRef CAS.
- H. Wang, S. Zhang, S. Li and J. Qu, Talanta, 2018, 178, 188–194 CrossRef CAS PubMed.
- C.-J. Gu, F.-Y. Kong, Z.-D. Chen, D.-H. Fan, H.-L. Fang and W. Wang, Biosens. Bioelectron., 2016, 78, 300–307 CrossRef CAS PubMed.
- R. N. Goyal, V. K. Gupta, M. Oyama and N. Bachheti, Talanta, 2007, 72, 976–983 CrossRef CAS PubMed.
- A. Maaref, H. Barhoumi, M. Rammah, C. Martelet, N. Jaffrezic-Renault, C. Mousty and S. Cosnier, Sens. Actuators, B, 2007, 123, 671–679 CrossRef CAS.
- X. Zhuang, D. Chen, S. Zhang, F. Luan and L. Chen, Microchim. Acta, 2018, 185, 166 CrossRef PubMed.
- Y. Teng, L. Fan, Y. Dai, M. Zhong, X. Lu and X. Kan, Biosens. Bioelectron., 2015, 71, 137–142 CrossRef CAS PubMed.
- M. Rizwan, N. F. Mohd-Naim and M. U. Ahmed, Sensors, 2018, 18, 166 CrossRef PubMed.
- M. Ibrahim, H. Ibrahim, N. Almandil and A.-N. Kawde, Sens. Actuators, B, 2018, 274, 123–132 CrossRef CAS.
- M. Ibrahim, H. Ibrahim, N. B. Almandil and A.-N. Kawde, J. Electroanal. Chem., 2018, 824, 22–31 CrossRef CAS.
- S. A. Limab and M. U. Ahmed, RSC Adv., 2016, 6, 24995–25014 RSC.
- M. U. Ahmed, I. Saaem, P. C. Wu and A. S. Brown, Crit. Rev. Biotechnol., 2014, 34, 180–196 CrossRef PubMed.
- C. Shan, H. Yang, D. Han, Q. Zhang, A. Ivaska and L. Niu, Biosens. Bioelectron., 2010, 25, 1070–1074 CrossRef CAS PubMed.
- A. Kaushik, P. R. Solanki, A. A. Ansari, G. Sumana, S. Ahmad and B. D. Malhotra, Sens. Actuators, B, 2009, 138, 572–580 CrossRef CAS.
- B. D. Malhotra and A. Kaushik, Thin Solid Films, 2009, 518, 614–620 CrossRef CAS.
- F. M. M. Tchieno, E. Njanja, L. A. Tapondjou and I. K. Tonle, Am. J. Anal. Chem., 2014, 5, 424–432 CrossRef CAS.
- A. Kaushik, R. Khan, P. R. Solanki, P. Pandey, J. Alam, S. Ahmad and B. D. Malhotra, Biosens. Bioelectron., 2008, 24, 676–683 CrossRef CAS PubMed.
- G. Bolat and S. Abaci, Sensors, 2018, 18, 773 CrossRef PubMed.
- Y. Shen, D. Rao, Q. Sheng and J. Zheng, Microchim. Acta, 2017, 184, 3591–3601 CrossRef CAS.
- R. K. Mendes, B. S. Arruda, E. F. de Souza, A. B. Nogueira, O. Teschke, L. O. Bonugli and A. Etchegaray, J. Braz. Chem. Soc., 2017, 28, 1212–1219 CAS.
- H. Thakur, N. Kaur, P. Sabherwa, D. Sareen and N. Prabhakar, Microchim. Acta, 2017, 184, 1915–1922 CrossRef CAS.
- C. Hu, Z. Zhang, H. Liu, P. Gao and Z. L. Wang, Nanotechnology, 2006, 17, 5983–5987 CrossRef CAS.
- A. Vantomme, Z.-Y. Yuan, G. Du and B.-L. Su, Langmuir, 2005, 21, 1132–1135 CrossRef CAS PubMed.
- R. Khan, A. Kaushik, P. R. Solanki, A. A. Ansari, M. K. Pandey and B. D. Malhotra, Anal. Chim. Acta, 2008, 616, 207–213 CrossRef CAS PubMed.
- P. R. Solanki, A. Kaushik, A. A. Ansari, G. Sumana and B. D. Malhotra, Appl. Phys. Lett., 2008, 93, 163903 CrossRef.
- K.-J. Feng, Y.-H. Yang, Z.-J. Wang, J.-H. Jiang, G.-L. Shen and R.-Q. Yu, Talanta, 2006, 70, 561–565 CrossRef CAS PubMed.
- P. B. Taunk, R. Das, D. P. Bisen and R. K. Tamrakar, J. Radiat. Res. Appl. Sci., 2015, 8, 433–438 CrossRef.
- F. Molaei, F. Bigdeli, A. Morsali, S. W. Joo, G. Bruno and H. A. Rudbari, J. Mol. Struct., 2015, 1095, 8–14 CrossRef CAS.
- Y. He, X. Yu, T. Li, L. Yan and B. Yang, Powder Technol., 2006, 166, 72–76 CrossRef CAS.
- B. G. Mishra and G. R. Rao, J. Mol. Catal. A: Chem., 2006, 243, 204–213 CrossRef CAS.
- N. G. Shang, P. Papakonstantinou, M. McMullan, M. Chu, A. Stamboulis, A. Potenza, S. S. Dhesi and H. Marchetto, Adv. Funct. Mater., 2008, 18, 3506–3514 CrossRef CAS.
- A. J. Bard and L. R. Faulkner, Electrochemical Methods, 2001, vol. 2, p. 482 Search PubMed.
- S. Mehretie, S. Admassie, M. Tessema and T. Solomon, Anal. Bioanal. Electrochem., 2011, 3, 38–50 Search PubMed.
- D. K. Gosser, Cyclic voltammetry: simulation and analysis of reaction mechanisms, VCH, New York, 1993 Search PubMed.
- E. Er, H. Çelikkan, N. Erk and M. L. Aksu, Electrochim. Acta, 2015, 157, 252–257 CrossRef CAS.
- E. Laviron, J. Electroanal. Chem. Interfacial Electrochem., 1979, 101, 19–28 CrossRef CAS.
Footnote |
| † Electronic supplementary information (ESI) available. See DOI: 10.1039/c9ra01587f |
| This journal is © The Royal Society of Chemistry 2019 |

