 Open Access Article
In situ synthesis of C-doped BiVO4 with natural leaf as a template under different calcination temperatures†
Ruijie Yangab,
Rongshu Zhu *ab,
Yingying Fanab,
Longjun Huab and
Qianqian Chenab
aShenzhen Key Laboratory of Organic Pollution Prevention and Control, Environmental Science and Engineering Research Center, Harbin Institute of Technology (Shenzhen), Shenzhen 518055, P. R. China
bInternational Joint Research Center for Persistent Toxic Substances, Harbin Institute of Technology (Shenzhen), Shenzhen 518055, P. R. China. E-mail: rszhu@hit.edu.cn
First published on 7th May 2019
Abstract
In this work, a series of C-doped BiVO4 (BiVO4-T) with natural leaf structures were synthesized by a dipping-calcination method with the leaf of Chongyang wood seedling as a template under different calcination temperatures. The structures and morphologies of BiVO4-T were observed by FE-SEM observations. The doped carbon in BiVO4-T was formed in situ from the natural leaf during the calcination process and the amount of doping could be regulated from 0.51–1.16 wt% by controlling the calcination temperature. It was found that the sample calcined at 600 °C (BiVO4-600) with a C-doping content of 1.16 wt% showed the best photocatalytic degradation activity. After 120 min visible light irradiation, the photocatalytic decomposition efficiency of RhB for BiVO4-600 is 2.2 times higher than that of no template BiVO4. The enhanced photocatalytic performance is ascribed to the combined action of the unique morphology and doped-carbon. It is considered that the unique structures and carbon doping of BiVO4-600 are in favor of the enhancement of visible light absorption, which was supported by UV-vis DRS. Furthermore, the C-doping can enhance the efficient separation and transfer of the photo-generated electron–hole pairs, as proved by PL measurements. This study provides a simple dipping-calcination method and found the best calcination temperature to fabricate a high-performance BiVO4, which simultaneously achieves morphology and C-doping control in one step.
1. Introduction
Semiconductor photocatalytic technology has been considered to be an ideal candidate in solving the problem of environmental pollution, owing to its high-performance in degrading and mineralizing organic pollutants.1,2 Among various semiconductor photocatalysts, bismuth vanadate (BiVO4) has received much attention due to its narrow band gap for visible light absorption, low toxicity, low cost, and good stability.3–9 Nevertheless, the low charge transportation efficiency of pure BiVO4 leads to a very poor separation rate of electron–hole pairs, severely hindering its practical applications.5,8,10–12In recent years, researchers have made much effort to improve the charge transportation efficiency of BiVO4 and enhance its photocatalytic activity.4,13–17 Li et al. found that depositing noble metals and transition metal oxides on (010) and (110) facets of BiVO4 single crystals, respectively, can effectively promote the separation rate of photo-generated carriers.4 Besides, Shan et al. reported that the BiVO4/BiOI p–n heterojunction showed significantly enhanced photocatalytic activity for Rhodamine B (RhB) degradation18 and Zhang et al. reported Z-scheme CdS–Au–BiVO4 with enhanced photocatalytic activity for organic contaminant decomposition.5 There are also some efforts of optimizing the structure of BiVO4 to improve its photocatalytic activity. For example, Fan et al. reported an 3D micro/nanoarchitectures BiVO4, having enhancement of far red to near infrared solar photocatalysis, which was synthesized with butterfly wings as template.19 Our previous work (Published to Catal. Sci. Technol., https://doi.org/10.1039/c9cy00475k, attached to ESI†) synthesized an multi-level structure BiVO4 by a dipping-calcination method with the leaf of Chongyang wood seedling as template, with the enhancement of the degradation ratio of RhB. In addition, doping with a suitable element, such as C, N, Si, P, Mo etc., is another method to enhance the photocatalytic properties of BiVO4.20 For example, Xu et al. investigated carbon-doped BiVO4 with enhancement of photocatalytic degradation prepared by a two-step hydrothermal synthesis method using polyvinylpyrrolidone K-30 as a template and L-cysteine as the carbon source.21 Yin et al. fabricated C-doped BiVO4 with hierarchical structures by a novel sol–gel method to improve the photocatalytic activity for water oxidation and organic matter degradation.20 In order to simultaneously achieve the structure and C-doping control in one step, we design and fabricate C-doped BiVO4 with natural leaf as template by controlling the calcination temperature.
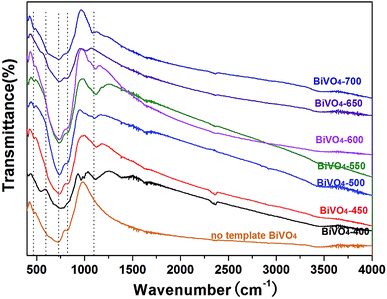
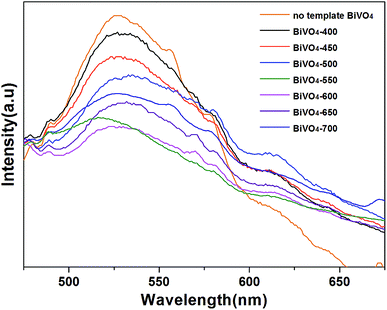
In this study, a series of C-doped BiVO4 (BiVO4-T) were synthesized by a dipping-calcination method with the leaf of Chongyang wood seedling as template under different calcination temperature. The field emission scanning electron microscopy (FESEM), X-ray diffraction (XRD), thermogravimetric and differential scanning calorimetry analyzer (TG-DSC) and fourier transform infrared spectroscopy (FTIR) were used to characterize the morphology, crystalline structure, the content of carbon doping and chemical composition of the photocatalysts. The UV-vis diffuse reflectance spectroscopy (DRS) and the photoluminescence (PL) spectra were analyzed to investigated the light absorption properties and separation rate of photo-generated carriers of the photocatalysts. Furthermore, the activities of the photocatalysts were evaluated by the RhB photocatalytic degradations under visible light irradiation.
2. Experimental section
2.1 Materials
All chemicals were of analytical grade and used without further purification. 37% hydrochloric acid, 25% glutaraldehyde, Bi(NO3)3·5H2O, NH4VO3, glycerol, ethanol and 65% nitric acid, were purchased from Sinopharm Chemical Reagent Co., Ltd., China. Tetramethylammonium hydroxide (TMAH) was purchased from Shanghai Jingchun Industrial Co. Ltd., China.2.2 Synthesis of photocatalysts
A series of C-doped BiVO4 were synthesized by a dipping-calcination method19,22 with the leaf of Chongyang wood seedling as template. In a typical procedure, the leaves were soaked in 2% glutaraldehyde phosphate buffer at 4 °C for 8 h, immersed in 5% hydrochloric acid for 3 h, and immersed in BiVO4 impregnation solution for 4 d (0.1 g leaf, 180 mL BiVO4 impregnation solution), successively. The BiVO4 impregnation solution was prepared as our previous work (Published to Catal. Sci. Technol., https://doi.org/10.1039/c9cy00475k, attached to ESI†). After that, the treated leaf was calcined in air for 6 hours at 400, 450, 500, 550, 600, 650 and 700 °C in a furnace, respectively. Then the obtained catalysts were assigned as BiVO4-T (BiVO4-400, BiVO4-450, BiVO4-500, BiVO4-550, BiVO4-600, BiVO4-650 and BiVO4-700).For comparison, no template BiVO4 was also synthesized. Put the BiVO4 impregnation solution (the same as above) into oven to dry at 60 °C for 48 h until the water evaporated completely. Then calcined the residue at 600 °C for 6 h. After that, no template BiVO4 was obtained.
2.3 Characterization
The morphologies of the prepared photocatalysts were investigated using a HITACHI SU1080 FE-SEM. The BET surface area was evaluated by a ASAP2020M+C constant volume adsorption apparatus with N2 adsorption. The XRD measurements were carried out on a Rigaku D/max 2550 VB/PC X-ray diffractometer with Cu Kα radiation. The TG-DSC of the samples were detected by a Netzsch STA 449F3 synchronous thermal analyzer. The FTIR spectra were recorded on a Thermo Scientific Nicolet IS50 spectrometer using a 360 nm LED laser as the light source and the detection wavelength was 540 nm. The UV-vis DRS were measured with a SHIMADZU UV-2450 spectrometer equipped with an integrating sphere assembly, using BaSO4 as the reference material. The PL spectra were recorded on a SHIMADZU RF5301PC by using the 380 nm line of a Xe lamp as the excitation source at room temperature.2.4 Photocatalytic activity measurements
The photocatalytic activities of the samples were evaluated by the degradations of RhB under visible light irradiation. Briefly, 10 mg catalyst was added in the RhB solution (150 mL, 10 mg L−1). A 350 W Xe lamp (Shenzhen Stone-lighting Opto Device Co., Ltd., China) was used as a simulated solar light source. Before turning on the light, the suspension was stirred for 60 min in the dark to obtain the adsorption–desorption equilibrium of the RhB on the surface of the photocatalyst. Then, the suspension was irradiated by the lamp under magnetic stirring. In the course of the reaction, withdrawing 2 mL suspension from the reaction vessel every 20 min. And then, removed the photocatalyst from the suspension by centrifugation. Finally, the concentration of RhB in the solution was monitored using a UV-vis spectrophotometer (SHIMADZU UV-2450).3. Results and discussion
3.1 Characterization of catalysts
 | ||
| Fig. 1 The macrophotograph of no template BiVO4, BiVO4-400, BiVO4-450, BiVO4-500, BiVO4-550, BiVO4-600, BiVO4-650 and BiVO4-700. | ||
| Catalyst | BiVO4-400 | BiVO4-450 | BiVO4-500 | BiVO4-550 | BiVO4-600 | BiVO4-650 | BiVO4-700 | No template BiVO4 |
| Carbon contents (wt%) | 0.51 | 0.64 | 0.72 | 0.89 | 1.16 | 1.01 | 0.84 | 0 |
| Specific surface area (m2 g−1) | 5.12 | 4.23 | 3.28 | 2.14 | 2.06 | 1.23 | 0.89 | 0.32 |
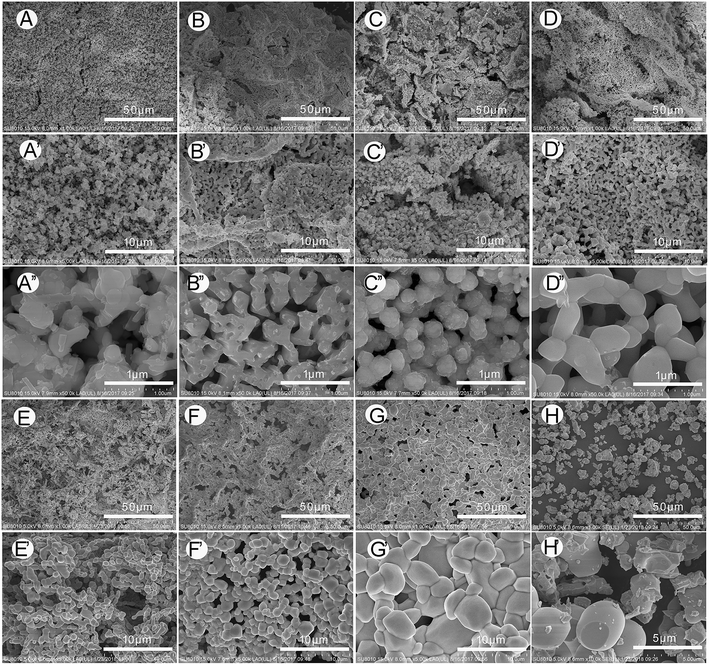
At the micro-level, the morphologies of C-doped BiVO4 and no template BiVO4 were observed by FE-SEM, shown in Fig. 2. In Fig. 2, compared with the cluttered distribution of BiVO4 grain crystal for no template BiVO4, the C-doped BiVO4-T show the regular porous structures, which inherited from natural leaf's structure (the more leaf-liked structures has been observed in our precious work which has been published to Catal. Sci. Technol., https://doi.org/10.1039/c9cy00475k, attached to ESI†). Moreover, from BiVO4-400 to BiVO4-700, the size of the crystallites gradually increase and the surface area (shown in Table 1) gradually decrease, illustrating that rising calcination temperature can make the grain size increase.
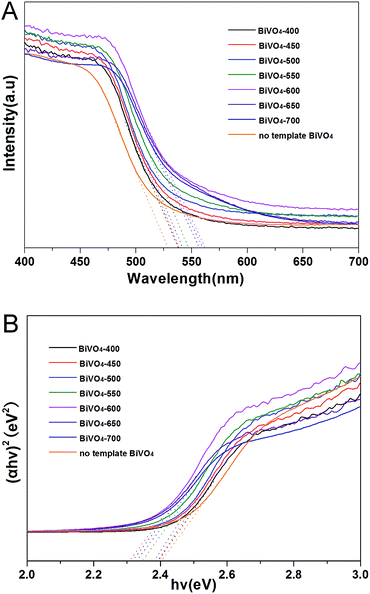
The optical band gap of a semiconductor can be estimated according to the following formula:29,30
| (αhν) = A(hν − Eg)n/2 |
3.2 Photocatalytic activity
The photocatalytic activities of the samples were evaluated in terms of the degradations of RhB under visible light irradiation and shown in Fig. 7. For comparison, the blank experiment (no catalyst) was also performed. This result can exclude the effects of self-degradation of RhB under visible-light irradiation. After visible light irradiation for 2 h, the degradation ratio of RhB gradually increase from BiVO4-400 at 47% to BiVO4-600 at 82%. While, as the temperature continues to increase from 650 to 700 °C, the degradation ratio of RhB decrease slightly. BiVO4-600 has the highest photocatalytic activity, suggesting that calcination temperature of 600 °C is optimized for the C-doped BiVO4 photocatalyst.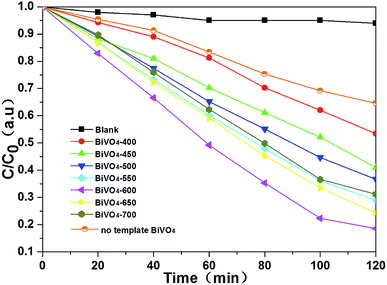 | ||
| Fig. 7 Photocatalytic degradations of RhB over blank, no template BiVO4, BiVO4-400, BiVO4-450, BiVO4-500, BiVO4-550, BiVO4-600, BiVO4-650 and BiVO4-700. | ||
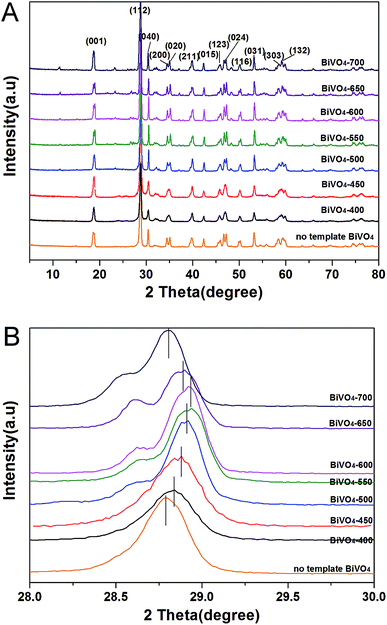
It is generally considered that the catalytic performance is affected by morphology, crystallographic structure, chemical composition, light absorption properties, and separation efficiency of the photo-generated electron–hole pairs of the semiconductor photocatalyst. However, in this work, with the increasing of calcining temperature, the morphology of the samples gradually deteriorate (the particle size gradually increase and the surface area gradually decrease), the crystallographic structures of all the samples were not changed (all the catalysts are monoclinic scheelite phase BiVO4). Obviously, neither morphology nor crystallographic structures of the samples influences the photocatalytic activity. Comprehensively analyzing the photocatalytic activities of the photocatalysts and the UV-vis DRS and PL results, we can get that it is coincident that the regularities of the change of photocatalytic activities, the absorption edge and the separation efficiency of the photo-generated electron–hole pairs. Furthermore, according to the UV-vis DRS and PL analysis, all of the influence factor can be attribute to carbon element doping. With the rising of calcining temperature, the amount of doped carbon element increases and reaches optimum at 600 °C, BiVO4-600 has the highest activity. While with the continually rise of calcining temperature, the amount of doped carbon element decreases, and the photocatalytic activity decreases with it. Therefore, The effect of calcination temperature on the catalytic activity of BiVO4-T is mainly due to the influence of carbon doping content in the catalyst.
4. Conclusions
In this work, a series of C-doped BiVO4 with natural leaf structures were synthesized by a dipping-calcination method with the leaf of Chongyang wood seedling as template under the calcination temperature of 400, 450, 500, 550, 600, 650 and 700 °C, respectively. The fine replication of natural leaf's macroscopic morphology and microstructure was confirmed directly by macrophotograph and FE-SEM. With the rise of calcination temperature, the carbon content of BiVO4-T increase from BiVO4-400 at 0.51 wt% to BiVO4-600 at 1.16 wt%, while when the temperature exceed 600 °C, the carbon content drops back a little. The carbon doped into BiVO4 crystal and induces lattice expansion. The measured photocatalytic activity results illustrate that BiVO4-600 with a C-doping content of 1.16 wt% showed the best photocatalytic degradation activity. After 120 min visible light irradiation, the photocatalytic decomposition efficiency of RhB for BiVO4-600 is 2.2 times higher than that of no template BiVO4. The improved photocatalytic performance is ascribed to not only the leaf-liked structures but also the in situ doped-carbon, enhancing the visible light absorption ability as well as improving the separation of photo-generated electron–hole pairs. This study provides a simple dipping-calcination method and found the best calcination temperature to fabricate a high-performance BiVO4, which simultaneously achieve the morphology and C-doping control in one step.Conflicts of interest
There are no conflicts to declare.Acknowledgements
All the authors gratefully acknowledge support from the Special Fund for the Development of Strategic and New Industry in Shenzhen (No. JCYJ20150731104949789) and the Fund for Knowledge Innovation in Shenzhen (No. JCYJ20180507183621817).Notes and references
- N. F. Moreira, J. M. Sousa, G. Macedo, A. R. Ribeiro, L. Barreiros, M. Pedrosa, J. L. Faria, M. F. Pereira, S. Castro-Silva, M. A. Segundo, C. M. Manaia, O. C. Nunes and A. M. Silva, Water Res., 2016, 94, 10–22 CrossRef CAS PubMed.
- J. Yu, P. Zhang, H. Yu and C. Trapalis, Int. J. Photoenergy, 2012, 2012, 1–4 Search PubMed.
- M. Niu, R. Zhu, F. Tian, K. Song, G. Cao and F. Ouyang, Catal. Today, 2015, 258, 585–594 CrossRef CAS.
- R. Li, H. Han, F. Zhang, D. Wang and C. Li, Energy Environ. Sci., 2014, 7, 1369–1376 RSC.
- S. Bao, Q. Wu, S. Chang, B. Tian and J. Zhang, Catal. Sci. Technol., 2017, 7, 124–132 RSC.
- Q. Wu, S. Bao, B. Tian, Y. Xiao and J. Zhang, Chem. Commun., 2016, 52, 7478–7481 RSC.
- M. Zhou, H. B. Wu, J. Bao, L. Liang, X. W. Lou and Y. Xie, Angew. Chem., Int. Ed. Engl., 2013, 52, 8579–8583 CrossRef CAS PubMed.
- J. Tang, B. Song, Q. Deng and H. Xin, Mater. Sci. Semicond. Process., 2015, 35, 90–95 CrossRef CAS.
- S. M. Thalluri, C. Martinez Suarez, M. Hussain, S. Hernandez, A. Virga, G. Saracco and N. Russo, Ind. Eng. Chem. Res., 2013, 52, 17414–17418 CrossRef CAS.
- F. Lin, D. Wang, Z. Jiang, Y. Ma, J. Li, R. Li and C. Li, Energy Environ. Sci., 2012, 5, 6400–6406 RSC.
- X. Gao, H. B. Wu, L. Zheng, Y. Zhong, Y. Hu and X. W. Lou, Angew. Chem., Int. Ed. Engl., 2014, 53, 5917–5921 CrossRef CAS PubMed.
- S. J. Hong, S. Lee, J. S. Jang and J. S. Lee, Energy Environ. Sci., 2011, 4, 1781 RSC.
- D. Wang, R. Li, J. Zhu, J. Shi, J. Han, X. Zong and C. Li, J. Phys. Chem. C, 2012, 116, 5082–5089 CrossRef CAS.
- J. Yang, D. Wang, X. Zhou and C. Li, Chemistry, 2013, 19, 1320–1326 CrossRef CAS PubMed.
- D. Tang, H. Zhang, H. Huang, R. Liu, Y. Han, Y. Liu, C. Tong and Z. Kang, Dalton Trans., 2013, 42, 6285–6289 RSC.
- W. Zhao, Y. Wang, Y. Yang, J. Tang and Y. Yang, Appl. Catal., B, 2012, 115–116, 90–99 CrossRef CAS.
- C. Li, P. Zhang, R. Lv, J. Lu, T. Wang, S. Wang, H. Wang and J. Gong, Small, 2013, 9, 3951–3956 CrossRef CAS PubMed , 3950.
- L. Shan, Y. Liu, J. Bi, J. Suriyaprakash and Z. Han, J. Alloys Compd., 2017, 721, 784–794 CrossRef CAS.
- R. Yan, M. Chen, H. Zhou, T. Liu, X. Tang, K. Zhang, H. Zhu, J. Ye, D. Zhang and T. Fan, Sci. Rep., 2016, 6, 20001 CrossRef CAS PubMed.
- C. Yin, S. Zhu, Z. Chen, W. Zhang, J. Gu and D. Zhang, J. Mater. Chem. A, 2013, 1, 8367 RSC.
- D. Zhao, W. Zong, Z. Fan, S. Xiong, M. Du, T. Wu, Y.-W. Fang, F. Ji and X. Xu, CrystEngComm, 2016, 18, 9007–9015 RSC.
- H. Zhou, J. Guo, P. Li, T. Fan, D. Zhang and J. Ye, Sci. Rep., 2013, 3, 1667 CrossRef PubMed.
- M. Zalfani, B. van der Schueren, Z.-Y. Hu, J. C. Rooke, R. Bourguiga, M. Wu, Y. Li, G. Van Tendeloo and B.-L. Su, J. Mater. Chem. A, 2015, 3, 21244–21256 RSC.
- C. Lv, G. Chen, J. Sun, C. Yan, H. Dong and C. Li, RSC Adv., 2015, 5, 3767–3773 RSC.
- Y. Shen, M. Huang, Y. Huang, J. Lin and J. Wu, J. Alloys Compd., 2010, 496, 287–292 CrossRef CAS.
- Q. Yun, A. Bai and S. Zhao, J. Rare Earths, 2014, 32, 884–889 CrossRef CAS.
- J. Liu, H. Wang, S. Wang and H. Yan, Mater. Sci. Eng., B, 2003, 104, 36–39 CrossRef.
- A. Zhang and J. Zhang, Spectrochim. Acta, Part A, 2009, 73, 336–341 CrossRef PubMed.
- X. Wu, J. Zhao, L. Wang, M. Han, M. Zhang, H. Wang, H. Huang, Y. Liu and Z. Kang, Appl. Catal., B, 2017, 206, 501–509 CrossRef CAS.
- B. Weng, S. Liu, N. Zhang, Z.-R. Tang and Y.-J. Xu, J. Catal., 2014, 309, 146–155 CrossRef CAS.
- J.-G. Choi, J. Catal., 1999, 182, 104–116 CrossRef CAS.
- J. E. Houston, G. E. Laramore and R. L. Park, Science, 1979, 185, 258–260 CrossRef PubMed.
- F. Tian, R. Zhu, J. Zhong, P. Wang, F. Ouyang and G. Cao, Int. J. Hydrogen Energy, 2016, 41, 20156–20171 CrossRef CAS.
- R. Zhu, F. Tian, S. Che, G. Cao and F. Ouyang, Renewable Energy, 2017, 113, 1503–1514 CrossRef CAS.
- F. Wang, G. Dukovic, L. E. Brus and T. F. Heinz, Phys. Rev. Lett., 2004, 92, 177401 CrossRef PubMed.
Footnote |
| † Electronic supplementary information (ESI) available. See DOI: 10.1039/c9ra01875a |
| This journal is © The Royal Society of Chemistry 2019 |

