 Open Access Article
A self-assembled graphene/polyurethane sponge for excellent electromagnetic interference shielding performance†
Zhikang Hu a,
Xinxin Jia,
Buyin Li*a and
Yuanzheng Luo
 *b
*b
aKey Laboratory of Electronic Information Functional Material of Electronic Information, Huazhong University of Science and Technology, Wuhan, Hubei 430074, China. E-mail: m201672054@hust.edu.cn; Tel: +86-27-87542994
bDepartment of physics and Optoelectronics Technolog, Guangdong Ocean University, Zhanjiang, Guangdong 524088, China
First published on 19th August 2019
Abstract
With the rapid development of personal computers and portable electronics, people have to get rid of a lot of unwanted electromagnetic pollution. The development of high performance electromagnetic interference (EMI) shielding materials is of critical importance to address ever-increasing military and civilian demand. Owing to its high electrical conductivity and flexible 3D structure, graphene sponge has great potential for excellent EMI shielding performance. However, its EMI shielding performance suffers from the material’s poor elasticity and durability. In this paper, we demonstrate the potential of a self-assembled graphene/polyurethane sponge composite, synthesized via a two-step hydrothermal method, for EMI shielding. This kind of material exhibits a high specific EMI shielding effectiveness of 969–1578 dB cm2 g−1 which is comparable or even superior to traditional graphene/polymer sponges. The excellent EMI shielding performance originates from the superconductivity of graphene and the highly porous structure of the graphene/polyurethane sponge. It is found that the polyurethane sponge works as a robust scaffold for graphene to shape its 3D structure. This work introduces a facile yet efficient two-step hydrothermal approach to prepare a graphene/polyurethane sponge with excellent EMI shielding performance and good durability.
1 Introduction
Nowadays, the increased application of electronic devices across a broad spectrum of sectors – military, industrial, commercial and consumer – has caused a lot pollution such as noise, radio frequency interference (RFI), electromagnetic radiation and even electromagnetic interference (EMI) which may have an adverse effect on precision instruments and machinery.1–6 EMI shielding is seen to have great value for several reasons, of which preventing electromagnetic interference from affecting sensitive and valuable devices is the most vital purpose. Therefore, there is an urgent and large demand for effective and multi-functional EMI shielding materials. The interest in EMI shielding makes the application of EMI shielding materials a necessity for the sake of human health and device safety. What is more, electronic devices such as mobile phones and laptops are widely used at high frequencies and bandwidths, especially at X-band frequencies (8.2–12.4 GHz).Many conductive materials which have been already used for the construction of EMI shielding enclosures generally have certain limitations. For example, metals and metallic composites are the most common materials used for EMI shielding; they possess high conductivity and electromagnetic reflection but at the same time, they also have many disadvantages. For example, aluminium based materials have low impact resistance, stainless steel has high density and iron is susceptible to corrosion.7–9 Many porous EMI shielding materials such as carbon powder, nanotubes, graphene and graphene aerogels suffer poor flexibility and durability.8–11 These materials are only limited in certain regards with respect to the disadvantages listed above, making it an opportunity to find some new materials with a wider range of applications.
To resolve this problem many materials, especially flexible and conductive materials such as carbon nanostructure-based composites, polymer/carbon composites and metal/polymer composites, have been studied in recent years.12–16 As reported in the literature, carbon nanostructure-based composite materials have been researched due to their light weight, excellent electrical conductivity, resistance to corrosion, good flexibility, ease of fabrication, and low cost.17,18 Many polymer/carbon and polymer/metal composites also possess high electrical conductivity, large specific surface area, and high content of conductive fillers, and therefore have the potential to show great EMI shielding effectiveness.8,11 Of all these EMI shielding materials, graphene-based EMI shielding materials have attracted a lot of attention because of their special porous structure and superconductivity.19–22 However, traditional graphene based EMI shielding materials generally possess poor flexibility and elasticity, making it difficult to be used in flexible, stable or repetitive applications. To get rid of these problems, we put forward an idea of using a polymer 3D structure to create a stable and flexible structure for graphene, which could combine both the superconductivity of graphene and the flexibility of the 3D structure. A lot of EMI shielding research has been undertaken to test 3D structured and graphene-based materials. The fabrication of conductive graphene 3D structured polymer composites for EMI shielding has also gained more and more attention due to their intrinsic superconductivity and the elasticity of their 3D structure.6,12,23–25
In this work, we manufactured a 3D graphene structure using a self-assembly method in a porous commercial PU sponge. Such an integrated product can make use of the benefits of both the graphene and PU sponge components. At the same time, a series of experiments were undertaken to investigate the best strategy to synthesise the graphene polymer composite. An excellent EMI shielding effect was proven by the experiments. Our sample was only 10 mm in thickness and it possesses good performance that similar products do not have. The experiments showed an EMI SE (shielding effectiveness) of 35 dB at the X-band region and a density of 0.11 mg cm−3, which were obtained with a graphene loading of 28.6 wt%. This material also shows a high specific EMI shielding effectiveness (dB cm2 g−1) of 969–1578 dB cm2 g−1, which is a remarkable EMI shielding effectiveness when taking density and thickness into consideration. The sample possesses a higher EMI SE density and can be changed to different thicknesses as it is a compressible and flexible material, which may give it the potential to be a popular product, suited to many military and civilian settings.
2 Experimental
2.1 Fabrication of PUG
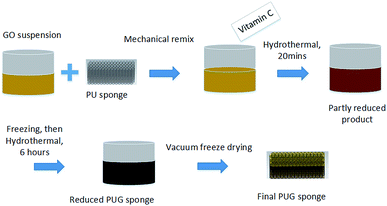
The PUG foams were fabricated using a two-step hydrothermal reduction process. Graphene oxide (GO) was prepared through a modified Hummer’s method26,27 and the GO solution was remixed by supersonic and mechanical stirring. Firstly, we cut the commercial PU sponge into a specific shape and immersed it in the as-prepared GO solution to get both in full contact. After squeezing frequently and ultrasonication, ascorbic acid was added and the suspension was then placed in boiled water at 95 °C for approximately 20 minutes, after which point the GO was just condensed into a sol–gel. A freeze casting process lasting 6 hours was carried out immediately when the test tube had cooled down to room temperature. In the second step, the initial sponge compound was put into a beaker to be reduced for a second time in 95 °C boiled water for 6 hours to ensure the compound was totally reduced and the oxygen-containing functional groups of the 3D graphene structure were removed. Thereafter, the beaker was placed in a vacuum freezing dryer to draw off ice crystals for over 48 hours until it was completely dry, and we then harvested the final 3D structured graphene product. The whole procedure is shown in Fig. 1.2.2 Characterization
X-ray photoelectron spectroscopy (XPS) was conducted using an ESCALAB 250XI made by Thermo Scientific company. Raman spectra were obtained using a DXR made by Thermo Scientific company. Scanning electron microscopy (SEM) measurements were carried out using a SUPRA 55 made by Zeiss. The electrical conductivity of the samples was measured using a four-point probe method with two copper electrodes. The scattering parameters (S11 and S21) were measured using a Rohde & Schwarz ZVA67 vector network analyser (VNA) using the waveguide method in the X-band region, and the samples with different thicknesses were cut into small pieces with dimensions of 22 × 10.0 × 10 mm to fit the waveguide holders well. The values of SE total, SE absorption, and SE reflection were determined on the basis of the measured S parameters as follows:28,29| R = |S11|2, T = |S21|2; |
| A = 1 − R − T; |
R is the reflection coefficient, T is the transmission coefficient, and A is the absorption coefficient. P1 is the incident power, and PT is the transmitted power.
3 Results and discussion
The PUG foams were fabricated using a two-step hydrothermal reduction method to reduce the graphene oxide suspension and rebuild the graphene nanostructure. After the two-step chemical reduction, the graphene was reshaped on the surface of the framework by a self-assembly procedure, then the reduced graphene sheets were supposed to be the “clothes” of the PU sponge framework so that the PU sponge and the graphene sheets was supposed to be an suited coalition. In terms of appearance, the resulting PUG sponges are a metallic black in appearance while the original sponges are faint yellow, suggesting that the graphene oxide was reduced to graphene. The density of the resulting PU sponge could be easily changed through choosing a different PU sponge and a different content of GO aqueous solution due to this facile method. Concerning both the EMI testing and the absorption ability of PU sponge for GO solvent, we choose PU sponges with dimensions of 22 mm × 10 mm × 5 mm and 22 mm × 10 mm × 10 mm, which were torn from the large sponge using scissors and a ruler. In Fig. 2(A–D), the different sizes of PUG and PU sponges is shown; the products could be supported by a leaf. An interesting compression test was conducted, as shown in Fig. 2(E–I) it has wonderful flexibility, confirming that it would be a type of multi-functional material with a bright future.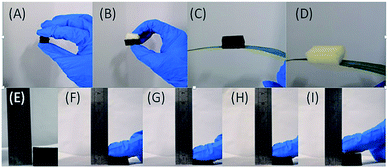 | ||
| Fig. 2 (A–D) Optical images of different types of the PUG sponge and a comparison of PU and PUG sponges. (E–I) Presentation of compression and release processes of the 10 mm PUG sponge. | ||
The microstructural and morphological evolution of the PUG foams was investigated using SEM measurements. We saw that the porous structure given by the PU sponge was neat and regular. Fig. 3(A–D) show that the framework was honeycomb and regular, the holes were filled by the surrounding graphene. As the picture becomes clearer, we can see that the graphene was combined in a self-assembled way, that is, not only was it linked to the PU framework, but the strong binding force between the two components also retains their integrity after the reduction method. Furthermore, the graphene oxide would be converted to a graphene aerogel if there was not a PU sponge.34,35 As shown in Fig. 3(E–H), there are smaller holes at the junctions of the structure, and so it retains many of the features of graphene aerogels mentioned in the literature above, such as high conductivity and good flexibility.
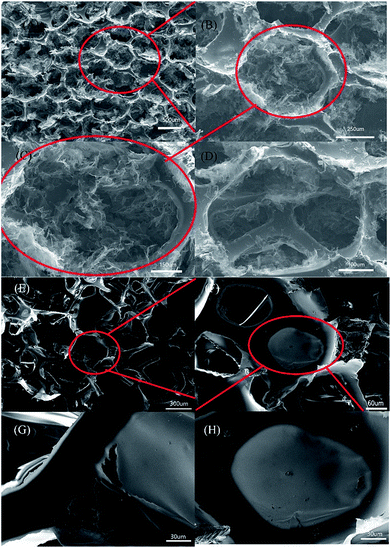 | ||
| Fig. 3 (A–H) A series of SEM images of the 10 mm PUG sponge. The scale bars are 500 μm (A), 250 μm (B), 150 μm (C), 100 μm (D), 300 μm (E), 60 μm (F) and 30 μm (G and H). | ||
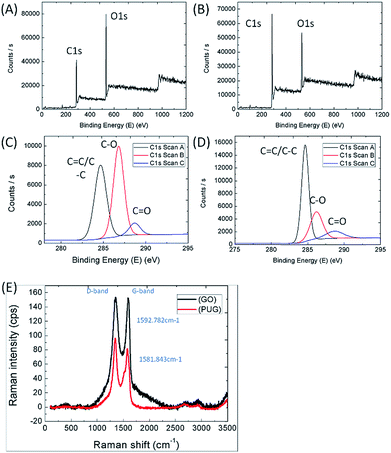
Functional group and elemental composition in composites can be studied using XPS peak analysis, thus characterizing the self-assembly process of the graphene oxide sheets. From the photoelectron spectrum of C ls, we can clearly see two peaks at 285 eV and 533 eV corresponding to carbon and oxygen, shown in Fig. 4(A) and (B). The ratio of C/O was changed from 0.518 to 1.243, indicating that the oxygen in GO was almost reduced to graphene after the reduction process, which is similar to the reported literature.19,25,30 Fig. 4(C) and (D) show the convolution of the photoelectron spectrum; three different peaks at 284.65 eV, 286.20 eV and 288.75 eV were obtained. From the reported literature, we can deduce that the peak at 284.65 eV corresponds to C![[double bond, length as m-dash]](https://www.rsc.org/images/entities/char_e001.gif) C/C–C in the aromatic ring, the peak at 286.20 eV corresponds to C–O in the alkoxy and epoxy groups, and the peak at 288.75 eV corresponds to C
C/C–C in the aromatic ring, the peak at 286.20 eV corresponds to C–O in the alkoxy and epoxy groups, and the peak at 288.75 eV corresponds to C![[double bond, length as m-dash]](https://www.rsc.org/images/entities/char_e001.gif) O in the carbonyl group. The C–O band decreased a lot from around 10
O in the carbonyl group. The C–O band decreased a lot from around 10![[thin space (1/6-em)]](https://www.rsc.org/images/entities/char_2009.gif) 000 counts per second to 5000 counts per second, in contrast, the C
000 counts per second to 5000 counts per second, in contrast, the C![[double bond, length as m-dash]](https://www.rsc.org/images/entities/char_e001.gif) C/C–C band increased from around 8000 counts per second to 15
C/C–C band increased from around 8000 counts per second to 15![[thin space (1/6-em)]](https://www.rsc.org/images/entities/char_2009.gif) 200 counts per second. The above results show that GO is highly reducible in the PUG sponge. The removal of oxygen-containing functional groups facilitates an increase in electrical properties.
200 counts per second. The above results show that GO is highly reducible in the PUG sponge. The removal of oxygen-containing functional groups facilitates an increase in electrical properties.
Raman spectroscopy was used to confirm that the GO sheets were fully converted to the graphene aerogel coating on the PU framework. From the literature,31 the peaks at around ∼1341 to 1342 cm−1 are called D-bands and the peaks at around ∼1581 to 1592 cm−1 are called G-bands, which are associated with the breathing modes in carbon rings and the in-plane vibrations of sp2 atoms. The intensity ratio between ID/IG that is determined by the integration of their peak areas could reveal the disorder degree of the sp2 carbon domain state of the PU/graphene composite. Comparing the Raman spectra of GO and the PUG sponge shown in Fig. 4(E), the ratio of IG/ID intensity ratio increases from 0.849 for PUG to 1.011 for GO, showing the same trend as the reported literature concerning PU/GO.22,31,32 A lower G-band intensity for PUG indicates that additional, smaller sp2-bonded carbon structures were formed after the hydrothermal reduction. Next, both the D band and G band peaks decreased a lot when GO was transformed to PUG. Meanwhile, the small red-shift of the G band from 1592.782 cm−1 to 1581.843 cm−1 confirms that GO was successfully reduced to an rGO covering on the PU sponge.
The thermogravimetric analysis results for the PU frameworks at 1000 °C are shown in Fig. S1 and S2.† As time passed by, the PUG and PU sponges almost lost their weight after 35 to 40 minutes, but for the PUG sponge the graphene network structure still remained after the PU structure disappeared on heating. The graphene sponge composite could be completely removed by nitrogen pyrolysis, confirming the fact that graphene was not just easily coated on the PU sponge but also suggesting that the PUG sponge consists of two parts which are ingeniously connected. As for the electrical conductivity, a four-probe method was used to obtain exact values, and we then used a 6500B Agilent Impedance Analysis Tester to investigate the changes of impedance versus different frequencies in Fig. S3.† Here, the excellent conductivity was attributed to reduced GO, due to its unique structure. The large aspect ratio of graphene was the dominant reason accounting for its excellent conductivity. The EMI shielding correlates most to the conductivity of the materials; the higher conductivity the materials possess, the higher the EMI shielding effect that they present.
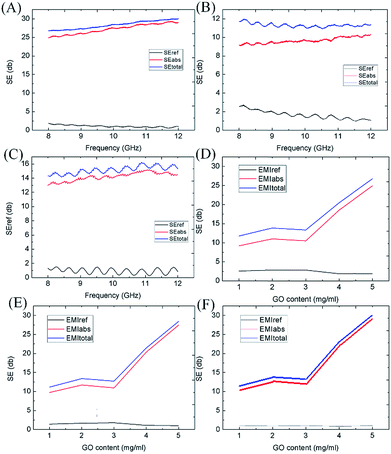
The PUG sponge of 10 mm thickness containing 5 mg mL−1 GO has a graphene content of 28.2%. Results analysing the relationship between the absorption shielding effectiveness (SE), reflection SE and total SE of the material in the X-band region are shown in Fig. 5(A). Specific numerical values were also determined based on material thickness. In this section, the relation between EMI SE and sample thickness is described. We mainly test two different thicknesses, 5 mm and 10 mm. In Fig. 5(A) and (B), it can be clearly seen that the 10 mm thick PUG sponge presents an excellent EMI SE of 30 dB every sample, whereas for the 5 mm PUG, the EMI SE is only 12 dB. Furthermore, we directly put two 5 mm PUG sponges together to the waveguide to test its properties; as a result it shows an EMI SE of 16 dB while for one sponge it is just 10 to 12 dB, as shown in Fig. 5(C). The EMI SE was nearly positively related to thickness. There are many reasons accounting for this phenomenon. The thickness of the PUG sponge changes the effectiveness of EM wave absorption through increasing the effective path of EM transmission. From the literature,5,22,33 EM wave transition distance consists of two parts; the thickness of the PU sponge and the pores of the structure. As a result, to gain better SE absorption, we can increase the thickness of the PU sponge and the content of graphene. When it comes to the content of the reactant, it can be seen in Fig. 5(D–F) that no matter whether at 8 GHz, 10 GHz or 12 GHz, the absorption SE and total SE increased when the graphene content of solution did, and the reflection SE increased slightly. As can be calculated, the content of reduced graphene was 8.13%, 10.33%, 12.34%, 15.02% and 18.71% when the GO solution concentration was 1, 2, 3, 4 and 5 mg mL−1, respectively. The content of reduced graphene plays a large role in EMI shielding.
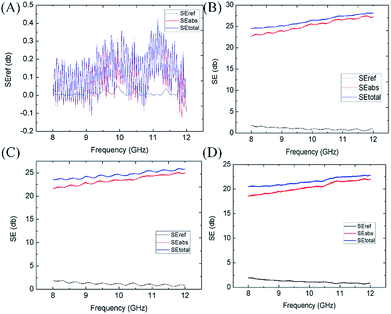
The PU sponge contributed very little to the EMI shielding as shown in Fig. 6(A), so it does not matter when we discuss EMI shielding properties. In this work, graphene oxide was used as a basic conductive filler as it was self-assembled into the host cellular architecture of the PUG sponge and then was transformed to a highly conductive graphene aerogel coating on the framework. An ice template was introduced to this two-step hydrothermal process, after the first reduction method, the blended solution was subsequently frozen to produce a new porous structure in the original PU sponge. When the GO was aggregated together, we collected it and cooled the gel-like compound below the freezing point; with the ice growing, the reduced GO sheets were expelled to form a phase separation. Another hydrothermal reduction was applied to the intermediate product to make sure that it was fully reduced. One benefit of this low-cost wet shaping technique is that various porous structures can be easily obtained by adjusting the precursor concentrations and thermodynamic parameters. Interconnected 3D networks of graphene aerogel formed among the void spaces of the polyurethane scaffold, just like a small porous structure born from a large hole structure. This two-step reduction method was used to gain various porous-structured and compressive conductive graphene networks. In spite of the fact that the one-step method PUG sponge also performed slightly weaker at EMI shielding compared to the two-step method PUG sponge as shown in Fig. 6(B), it did not have the flexibility and durability that the two-step PUG sponge possessed because of the loss of graphene. Our two-step PUG sponge still had an EMI SE of 23–26 dB after 200 compression cycles, as shown in Fig. 6(C) and 18–23 dB after 1000 cycles, as shown in Fig. 6(D). The wonderful durability comes from the special structure given by the graphene sponge and PU framework. We have sufficient evidence to support that the two-step hydrothermal 3D graphene structure could not only interact with incoming EM waves but also enhance the internal multiple reflection and scattering of EM waves at the large cell–matrix interfaces with impedance mismatch.34–37 Thereby the attenuation of EM energy was realized by both conductive dissipation and multiple reflections and scattering during EMI shielding. Our two-step hydrothermal method prepared an absorption-dominant EMI shielding 3D conductive graphene network for PUG foams. As for the EMI shielding mechanism, the highly porous structure between the 3D conductive graphene networks adhered to the PU conductive structure enhances the absorption of electromagnetic interference, as the highly porous structure can decrease the impedance mismatch at the interface between the foam and air. Back reflection was weakening but on the contrary, the absorption of EM waves was strengthening through extending the practical transmission distance, converting more EM waves, more EM energy being dissipated and further improving the absorption performance. The porous structure and unwanted disturbance of defects and oxygen groups both strengthen the multiple EM wave absorption and the dissipated EM energy. From Fig. 4(A–H), we can learn that the absorption of EM waves was obviously higher than the reflection of EM waves, which should be attributed to the fact that absorption SE mainly relies on the sample’s thickness, the effective transmission distance, but the reflection SE is almost dependent on the interfacial states of the sample. It is acknowledged that being light weight and smaller thickness are primary issues concerning the design of EMI shielding materials. The amount of EMI shielding depends heavily upon the material used, its thickness, the size of the shielded volume, the frequency of the fields of interest, and the size, shape and orientation of apertures in an electromagnetic field shield.
To compare different materials using the same fashion or parameter, we introduce the concept of a specific SE (dB cm2 g−1) value which has been used in the literature for the sake of both density and thickness. What is more, a table was prepared to list recently reported materials that exhibit good EMI shielding performance. As the Table 1 shows, this work presents a relatively lightweight and a distinctly higher graphene content, which would bring the PUG sponge better performance. The PUG sponge also shows a higher specific EMI SE value compared to some graphene sponges and carbon foams. This characteristic is comparable or even superior to most graphene/polymer sponges reported yet. The special two-step hydrothermal method will fabricate a better 3D graphene network coating on the PU framework, which gives this kind of product the gift of advanced electrical conductivity and abundant surface area. In addition, the PUG sponge can change its thickness to fit different places, thus the EMI shielding effectiveness and even more the specific SE could be adjusted by changing its thickness. So we have sufficient reason to hold the opinion that this two-step hydrothermal method product could generalize the use of graphene/polymer composites in EMI shielding.
| Name | Graphene content | Density (g cm−3) | Thickness (mm) | EMI SE (dB) | Specific SE value (dB cm2 g−1) | Ref. |
|---|---|---|---|---|---|---|
| Graphene film | — | 400 cm2 | 8.4 × 10⁻³ | 20 | — | 19 |
| Electrophoretic deposition RGO | 0.66 vol% | — | 20 | 6.37 | — | 20 |
| Dip-coating PUG foam | ∼10.0 wt% | 0.030 | 20–60 | ∼14.2 to ∼39.4 | >180 | 22 |
| Graphene foam/conductive polymer composites | — | 18.2 × 10⁻³ | 1.5 | ∼91.9 | 8040–20![[thin space (1/6-em)]](https://www.rsc.org/images/entities/char_2009.gif) 800 800 |
6 |
| Non-woven fabrics covered by rGO | — | 0.094 | 0.15 | ∼32 | ∼12![[thin space (1/6-em)]](https://www.rsc.org/images/entities/char_2009.gif) 608.4 608.4 |
4 |
| PMMA foam | ∼5.0 wt% | 0.79 | ∼2.4 | ∼19 | ∼100 | 34 |
| Graphene and nano magnetic multilayered composites | — | — | 5 × 10⁻³ | ∼24.0 | — | 38 |
| Graphene/epoxy composites | 15 wt% (8.8 vol%) | — | — | ∼21 | — | 16 |
| Ag@FRGO/WPU composite | 5 wt% | — | — | ∼35 | — | 12 |
| GF/CNT/PDMS composites | 2.7 wt% GF, 2 wt% CNT | — | 2.5 | ∼75 | ∼333 | 25 |
| Epoxy | 12 wt% | — | — | ∼21 | — | 16 |
| WPU | ∼5.0 vol% | 1.43 | ∼2.0 | ∼32 | ∼112 | 39 |
| PDMS foam | ∼0.8 wt% | 0.06 | ∼1.0 | ∼20 | ∼3333 | 40 |
| PEI foam | ∼10 wt% | 0.29 | ∼2.3 | ∼11 | ∼165 | 31 |
| This two-step synthesis PUG | ∼18.7 wt% | 0.038 | 9 | 30–35 | 969–1578 | This work |
4 Conclusions
In summary, we have used a facile and easy method to produce a PUG sponge through a two-step hydrothermal reductive chemical reaction with precision control. After freeze-drying, this final PUG product presented a lightweight of 38 mg cm−3, an excellent EMI shielding effectiveness of 33 dB and a unit density electromagnetic shielding effect of 969–1578 dB cm2 g−1. Owing to the unique structure of a 3D PU sponge framework and the self-assembly combination of graphene, this final product combined with an absorption-dominant shielding mechanism showed a comparable or even superior EMI shielding performance to traditional graphene/polymer sponges. Finally, by taking advantage of the high EMI shielding effectiveness, changeable conductivity, light weight and good durability, this PUG sponge could be considered as a new and effective material for EMI shielding in many military and civilian settings.Conflicts of interest
There are no conflicts to declare.Acknowledgements
Luo Y, and Li B. contributed equally to this work. This work was financially supported by the Fundamental Research Funds for the Central Universities (HUST: No. 2016YXMS205), the Creative Technology Project of Hubei Province: No. 2016AAA048, and the scientific research start-up funds of Guangdong Ocean University.References
- D. X. Yan, et al., Structured Reduced Graphene Oxide/Polymer Composites for Ultra-Efficient Electromagnetic Interference Shielding, Adv. Funct. Mater., 2015, 25(4), 559–566 CrossRef CAS.
- N. Yousefi, et al., Highly aligned graphene/polymer nanocomposites with excellent dielectric properties for high-performance electromagnetic interference shielding, Adv. Mater., 2015, 26(31), 5480–5487 CrossRef PubMed.
- A. H. Frey, Headaches from cellular telephones: are they real and what are the implications?, Environ. Health Perspect., 1998, 106(3), 101–103 CrossRef CAS PubMed.
- Y. Yuan, et al., Lightweight, flexible and strong core–shell non-woven fabrics covered by reduced graphene oxide for high-performance electromagnetic interference shielding, Carbon, 2018 Search PubMed.
- F. Shahzad, et al., Electromagnetic interference shielding with 2D transition metal carbides (MXenes), Science, 2016, 353(6304), 1137–1140 CrossRef CAS PubMed.
- Y. Wu, et al., Ultralight Graphene Foam/Conductive Polymer Composites for Exceptional Electromagnetic Interference Shielding, ACS Appl. Mater. Interfaces, 2017, 9(10), 9059 CrossRef CAS PubMed.
- N. C. Das and S. Maiti, Electromagnetic interference shielding of carbon nanotube/ethylene vinyl acetate composites, J. Mater. Sci., 2008, 43(6), 1920–1925 CrossRef CAS.
- S. Geetha, et al., EMI shielding: Methods and materials—A review, J. Appl. Polym. Sci., 2009, 112(4), 2073–2086 CrossRef CAS.
- D. Micheli, et al., X-Band microwave characterization of carbon-based nanocomposite material, absorption capability comparison and RAS design simulation, Compos. Sci. Technol., 2010, 70(2), 400–409 CrossRef CAS.
- M. H. Alsaleh and U. Sundararaj, Electromagnetic interference shielding mechanisms of CNT/polymer composites, Carbon, 2009, 47(7), 1738–1746 CrossRef CAS.
- S. Geetha, et al., EMI shielding: Methods and materials—A review, J. Appl. Polym. Sci., 2010, 112(4), 2073–2086 CrossRef.
- S. H. Lin, et al., Electromagnetic interference shielding performance of waterborne polyurethane composites filled with silver nanoparticles deposited on functionalized graphene, Appl. Surf. Sci., 2016, 385, 436–444 CrossRef CAS.
- F. Ren, D. Song and Z. Li, et al., Synergistic effect of graphene nanosheets and carbonyl iron nickel alloy hybrid fillers on electromagnetic interference shielding and thermal conductivity of cyanate ester composites, J. Mater. Chem. C, 2018, 6(6), 1476–1486 RSC.
- X. Sun, et al., Graphene foam/carbon nanotube/poly(dimethyl siloxane) composites for exceptional microwave shielding, Composites, Part A, 2016, 85(85), 199–206 CrossRef CAS.
- H. M. Kim, et al., Electrical conductivity and electromagnetic interference shielding of multiwalled carbon nanotube composites containing Fe catalyst, Appl. Phys. Lett., 2004, 84(4), 589–591 CrossRef CAS.
- J. Liang, et al., Electromagnetic interference shielding of graphene/epoxy composites, Carbon, 2009, 47(3), 922–925 CrossRef CAS.
- A. K. Geim, Graphene: status and prospects, Science, 2009, 324(5934), 1530–1534 CrossRef CAS PubMed.
- A. K. Geim and K. S. Novoselov, The rise of graphene, Nat. Mater., 2007, 6(3), 183–191 CrossRef CAS PubMed.
- B. Shen, W. Zhai and W. Zheng, Ultrathin Flexible Graphene Film: An Excellent Thermal Conducting Material with Efficient EMI Shielding, Adv. Funct. Mater., 2014, 24(28), 4542–4548 CrossRef CAS.
- S. Kim, et al., Electromagnetic Interference (EMI) Transparent Shielding of Reduced Graphene Oxide (RGO) Interleaved Structure Fabricated by Electrophoretic Deposition, ACS Appl. Mater. Interfaces, 2014, 6(20), 17647 CrossRef CAS PubMed.
- K. Zhang, et al., Ultralow percolation threshold and enhanced electromagnetic interference shielding in poly(L-lactide)/multi-walled carbon nanotube nanocomposites with electrically conductive segregated networks, J. Mater. Chem. C, 2017, 5(36), 9359–9369 RSC.
- B. Shen, et al., Compressible Graphene-Coated Polymer Foams with Ultralow Density for Adjustable Electromagnetic Interference (EMI) Shielding, ACS Appl. Mater. Interfaces, 2016, 8(12), 8050 CrossRef CAS PubMed.
- V. Eswaraiah, V. Sankaranarayanan and S. Ramaprabhu, Functionalized Graphene–PVDF Foam Composites for EMI Shielding, Macromol. Mater. Eng., 2011, 296(10), 894–898 CrossRef CAS.
- Z. Chen, et al., Lightweight and Flexible Graphene Foam Composites for High-Performance Electromagnetic Interference Shielding, Adv. Mater., 2013, 25(9), 1296–1300 CrossRef CAS PubMed.
- X. Sun, et al., Graphene foam/carbon nanotube/poly(dimethyl siloxane) composites for exceptional microwave shielding, Composites, Part A, 2016, 85, 199–206 CrossRef CAS.
- W. S. Hummers Jr. and R. E. Offeman, Preparation of Graphitic Oxide, J. Am. Chem. Soc., 1958, 80(6), 1339 CrossRef.
- M. Ciszewski, et al., Preparation and electrochemical properties of sodium-reduced graphene oxide, J. Mater. Sci.: Mater. Electron., 2013, 24(9), 3382–3386 CrossRef CAS.
- M. Cao, et al., The effects of temperature and frequency on the dielectric properties, electromagnetic interference shielding and microwave-absorption of short carbon fiber/silica composites, Carbon, 2010, 48(3), 788–796 CrossRef CAS.
- T. Gupta, et al., Improved nanoindentation and microwave shielding properties of modified MWCNT reinforced polyurethane composites, J. Mater. Chem. A, 2013, 1(32), 9138–9149 RSC.
- W. L. Song, et al., Flexible graphene/polymer composite films in sandwich structures for effective electromagnetic interference shielding, Carbon, 2014, 66(1), 67–76 CrossRef CAS.
- L. Jianqiang, et al., Facile preparation of lightweight microcellular polyetherimide/graphene composite foams for electromagnetic interference shielding, ACS Appl. Mater. Interfaces, 2013, 5(7), 2677–2684 CrossRef PubMed.
- Y. Luo, et al., Highly reusable and superhydrophobic spongy graphene aerogels for efficient oil/water separation, Sci. Rep., 2017, 7(1), 7162 CrossRef PubMed.
- L. Qiu, et al., Ultrafast Dynamic Piezoresistive Response of Graphene-Based Cellular Elastomers, Adv. Mater., 2016, 28(1), 194–200 CrossRef CAS PubMed.
- H. B. Zhang, et al., Tough graphene-polymer microcellular foams for electromagnetic interference shielding, ACS Appl. Mater. Interfaces, 2011, 3(3), 918 CrossRef CAS PubMed.
- Q. Song, F. Ye and X. Yin, et al., Carbon Nanotube-Multilayered Graphene Edge Plane Core–Shell Hybrid Foams for Ultrahigh-Performance Electromagnetic-Interference Shielding, Adv. Mater., 2017, 29(31), 1701583 CrossRef PubMed.
- Y. J. Wan, P. L. Zhu and S. H. Yu, et al., Anticorrosive, Ultralight, and Flexible Carbon-Wrapped Metallic Nanowire Hybrid Sponges for Highly Efficient Electromagnetic Interference Shielding, Small, 2018, 1800534 CrossRef PubMed.
- Y. J. Wan, P. L. Zhu and S. H. Yu, et al., Ultralight, super-elastic and volume-preserving cellulose fiber/graphene aerogel for high-performance electromagneticinterference shielding, Carbon, 2017, 115, 629–639 CrossRef CAS.
- A. O. Watanabe, et al., Highly-Effective Integrated EMI Shields with Graphene and Nanomagnetic Multilayered Composites, in Electronic Components & Technology Conference, 2016 Search PubMed.
- S. T. Hsiao, et al., Using a non-covalent modification to prepare a high electromagnetic interference shielding performance graphene nanosheet/water-borne polyurethane composite, Carbon, 2013, 60(14), 57–66 CrossRef CAS.
- C. Zongping, et al., Lightweight and flexible graphene foam composites for high-performance electromagnetic interference shielding, Adv. Mater., 2013, 25(9), 1296–1300 CrossRef PubMed.
Footnote |
| † Electronic supplementary information (ESI) available. See DOI: 10.1039/c9ra02059d |
| This journal is © The Royal Society of Chemistry 2019 |

