 Open Access Article
Tuning the photoluminescence property of carbon dots by ultraviolet light irradiation†
Xiaoyu Li,
Lihe Yan *,
Jinhai Si,
Huanhuan Xu and
Yanmin Xu
Key Laboratory for Physical Electronics and Devices of the Ministry of Education & Shaanxi Key Lab of Information Photonic Technique, School of Electronics & Information Engineering, Xi'an Jiaotong University, Xi'an, 710049, China. E-mail: liheyan@mail.xjtu.edu.cn
First published on 24th April 2019
Abstract
Tuning of the photoluminescence property of carbon nanodots is realized by surface modification through ultraviolet light irradiation. The photoluminescence of the processed carbon nanodots in the visible region is weakened while that in the ultraviolet region increases significantly. Fourier transform infrared spectroscopy and X-ray photo-electron spectroscopy reveal that the number of surface functional groups decrease significantly after ultraviolet light processing. By examining the electron donating and accepting properties, we confirm that the surface of the carbon nanodots is photoreduced by ultraviolet light, causing a decrease in the number of functional groups as well as emission in the visible region. The temporal behavior of the photoluminescence reveals that the increase of the emission in the ultraviolet region originates from the increased intrinsic state emission of the carbon nanodots.
Introduction
Carbon nanodots (CDs) have attracted increasing attention since their first discovery in 2004 owing to their stable photoluminescence (PL),1,2 photostability, high water solubility, chemical stability, low toxicity, and excellent biocompatibility.3–6 Due to their unique properties, CDs have been demonstrated to be promising substitutes for the present fluorescent nanomaterials in various applications,7 such as biological imaging,8–10 drug delivery,11,12 sensors,13–15 light-emitting devices,16–18 and lasers.19,20 Generally, the CDs are constituted of a carbon core with a sub-10 nm size, and particle surface sites passivated via surface functionalization.21,22 The surface properties of the CDs could affect the PL property and the solubility critically, and could be tuned during the synthesis process or by post-treatment.23,24Surface modification has been demonstrated to be a powerful method to tune the surface properties and thereby the chemical and physical properties of CDs.24–26 Many approaches such as covalent bonding and sol–gel technology27 have been proposed to realize the surface functionalization of CDs. Photochemical modification based ultraviolet (UV) light irradiation could provide an alternative strategy to modify the chemical structure of nanomaterials. The advantages of this method over previously described chemical modification approaches are more time-saving and avoiding toxic reagents and harsh conditions. The photochemical modification method has been widely used in preparing metal nanoparticles, reduced graphene nanosheets and graphene quantum dots (GQDs).28–32 However, very few attentions have been paid to the modification of the chemical structure and the tuning of the PL of CDs using UV light photoreactions.33–35
In this work, effect of UV light (365 nm) irradiation on the chemical structure and the PL property of CDs is investigated. After being irradiated by UV light, the PL intensity of CDs is obviously increases and blue shifted in the UV region, while that in the visible region decreased. We propose that the anomalous behaviors of PL arise from the UV induced photochemical reduction which resulting in significant decrease of carbonyl groups. By examine the temporal behavior of the PL, we infer that the enhancement of the emission in UV region is originated from the increased intrinsic states emission of CDs.
Experimental section
Hydrothermal treatment of glucose and amino acid was used to prepare the CDs.36 In a typical experiment, 12 mmol of glucose and 3 mmol of glycine were dispersed in 30 ml of deionized water. After ultrasonication, 15 ml of suspension was put into a Teflon-lined autoclave and heated for 2 hours at 150 °C. When cooled down to ambient temperature, the mixture was centrifuged to remove larger particles, and the supernatant containing pristine CDs (p-CDs) was collected. After that, the p-CDs solution was diluted and irradiated by a UV LED with the wavelength of 365 nm and a power intensity of 0.5 W cm−2 for different time.Transmission electron microscopy (TEM) and high-resolution TEM (HRTEM) images of the C-dots were obtained by a JEM-ARM200F microscope. The measurements of fluorescence spectra were recorded on a FLS920 spectrometer (Edinburgh). A UV-2600 spectrophotometer was employed to measure the absorption spectra of the samples. The Fourier transform infrared (FTIR) spectroscopy was performed on VERTEX 70 (Bruker). X-ray photo-electron spectroscopy (XPS) data for was measured by an AXIS ULtrabld XPS system. For the fluorescence lifetimes and time-resolved PL measurements, picosecond pulsed LEDs with central wavelength 343 nm and 400 nm were used as excitation sources.
Results and discussion
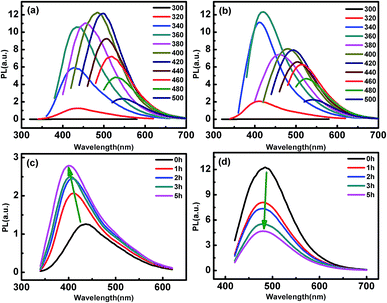
Firstly, we measured the PL intensity of the p-CDs and those irradiated by UV light for different time. Fig. 1(a) and (b) show the emission spectra of p-CDs and CDs after UV light irradiation for 1 hour (1h-CDs), respectively. It can be seen that p-CDs exhibit maximum excitation and emission wavelengths near 420 and 500 nm, respectively. After UV light treatment, the 1h-CDs show strong blue PL emission located at 425 nm with maximum excitation of 360 nm, while the PL emissions at 450 nm to 550 nm are greatly decreased. In order to obtain the details about the effect of UV light irradiation on the PL, emission spectra of the CDs after UV light irradiation for different time are recorded. Fig. 1(c) and (d) show the emission spectra excited by the 320 nm and 400 nm for different UV light irradiation time, respectively. The results indicate that the PL intensity is gradually increased and blue-shifted at the excitation of 320 nm with increasing the irradiation time of the UV light. For 400 nm excitation, the PL intensity decreases with increasing the irradiation time.Besides the PL behavior, we also examined the morphology changes of the CDs by UV light irradiation. The TEM images of the as prepared p-CDs is given in Fig. S1(a).† The crystal lattices with a lattice spacing of 0.21 nm according well with the {111} planes of cubic diamond is observed in the HRTEM given by Fig. S1(b).† The average size of the CDs is measured to be about 1.93 nm as shown by Fig. S1(c).† Fig. S2† shows the Raman spectra of p-CDs. Two characteristic peaks at 1350 cm−1 and 1570 cm−1 corresponding to the D and G bands are observed.37 Fig. S3(a)–(c)† show the TEM, HRTEM and size distribution of the prepared 1h-CDs. The lattice spacing of the 1h-CDs is measured to be the same with that of the p-CDs, and the size distribution is about 1.74 nm, being similar with that of the p-CDs. These results indicate that the photochemical process doesn't influence the size and morphology structures of the CDs. Hence, we speculate that the effect of UV light on the PL behavior is ascribed to the chemical structure modification of CDs, and UV-Vis absorption spectra, FTIR spectroscopy and XPS are further used to study the chemical characteristics of the CDs.
As shown by Fig. 2(a), the UV-Vis absorption spectra of C-dots show an strong absorption peaks at 280 nm, which is attributed to the π–π* transition of aromatic sp2 domains.38 There is also a broad absorption band around 340 nm corresponding to the n–π* transition of C![[double bond, length as m-dash]](https://www.rsc.org/images/entities/char_e001.gif) O bond.39 After UV light irradiation, the absorption above 300 nm is significantly decreased, indicating the reduction of the C
O bond.39 After UV light irradiation, the absorption above 300 nm is significantly decreased, indicating the reduction of the C![[double bond, length as m-dash]](https://www.rsc.org/images/entities/char_e001.gif) O bonds. The FTIR spectra also reflect the same feature. As shown by Fig. 2(b), all C-dots show the same characteristic bonds including the stretching vibration of O–H bond at 3420 cm−1,40 C–H at 2920, and 2855 cm−1,41 vibration of C
O bonds. The FTIR spectra also reflect the same feature. As shown by Fig. 2(b), all C-dots show the same characteristic bonds including the stretching vibration of O–H bond at 3420 cm−1,40 C–H at 2920, and 2855 cm−1,41 vibration of C![[double bond, length as m-dash]](https://www.rsc.org/images/entities/char_e001.gif) O at 1630 cm−1,40 bending vibration of CH2 at 1350–1460 cm−1,42 and vibration of C–O around 1000–1200 cm−1.41 By prolonging the irradiation time, the O–H bond, C
O at 1630 cm−1,40 bending vibration of CH2 at 1350–1460 cm−1,42 and vibration of C–O around 1000–1200 cm−1.41 By prolonging the irradiation time, the O–H bond, C![[double bond, length as m-dash]](https://www.rsc.org/images/entities/char_e001.gif) O bond and C–O bond is significantly reduced. More information about the differences in surface functional groups of CDs before and after UV light irradiation is further obtained by XPS analysis. The high-resolution C 1s spectrum of pristine C-dots (Fig. 2(c)) shows three peaks: a strong peak at 284.5 eV corresponding to C
O bond and C–O bond is significantly reduced. More information about the differences in surface functional groups of CDs before and after UV light irradiation is further obtained by XPS analysis. The high-resolution C 1s spectrum of pristine C-dots (Fig. 2(c)) shows three peaks: a strong peak at 284.5 eV corresponding to C![[double bond, length as m-dash]](https://www.rsc.org/images/entities/char_e001.gif) C bond, a peak at 286.0 eV ascribed to C–O bond, and a peak at 287.9 eV ascribed to C
C bond, a peak at 286.0 eV ascribed to C–O bond, and a peak at 287.9 eV ascribed to C![[double bond, length as m-dash]](https://www.rsc.org/images/entities/char_e001.gif) O bond.40 The content of C
O bond.40 The content of C![[double bond, length as m-dash]](https://www.rsc.org/images/entities/char_e001.gif) C, C–O and C
C, C–O and C![[double bond, length as m-dash]](https://www.rsc.org/images/entities/char_e001.gif) O bonds calculated to be about 66.6%, 26.4% and 7%. After 1 hour UV light irradiation, the ratio of C
O bonds calculated to be about 66.6%, 26.4% and 7%. After 1 hour UV light irradiation, the ratio of C![[double bond, length as m-dash]](https://www.rsc.org/images/entities/char_e001.gif) C, C–O and C
C, C–O and C![[double bond, length as m-dash]](https://www.rsc.org/images/entities/char_e001.gif) O bonds changed to be about 80.3%, 14.4% and 5.3%, respectively (Fig. 2(d)). The results indicate C–O and C
O bonds changed to be about 80.3%, 14.4% and 5.3%, respectively (Fig. 2(d)). The results indicate C–O and C![[double bond, length as m-dash]](https://www.rsc.org/images/entities/char_e001.gif) O groups are decreased after UV light irradiation, and we speculate that photoreduction reactions take place when the CDs are irradiated by UV light.
O groups are decreased after UV light irradiation, and we speculate that photoreduction reactions take place when the CDs are irradiated by UV light.
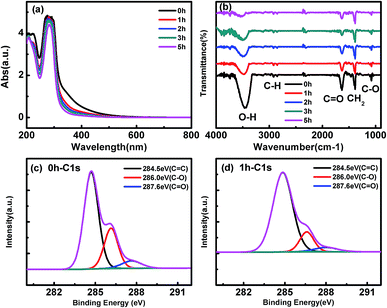 | ||
| Fig. 2 (a) UV-Vis absorption spectra (b) FTIR spectra of the CDs prepared by UV light irradiation for different time. High-resolution C 1s XPS spectra (c) p-CDs (d) 1h-CDs. | ||
In the previous report, D. Tan et al. have demonstrated the photooxidation effect of the UV light on the CDs prepared by laser ablation method, and the CDs exhibited red shifted and enhanced green emission.33 These results are contrary to our experiments in the CDs prepared using hydrothermal treatment. To exclude the effect of oxygen in the photochemical reactions, a comparative experiment was done in the atmosphere and nitrogen. As shown by Fig. S4,† the fluorescence spectra show the same change after irradiating the CDs with UV light for 1 hour in air and nitrogen. The results indicate that the PL change of the CDs is not due to the reactions with the oxygen in the air.
To verify our reference, the electron-donating and accepting properties of the CDs are tested by analyzing the PL quenching effect of CD by electron acceptor or donor molecules.43,44 Here, N,N-methylviologen (MV) and triethanolamine (TEOA) are used as the electron acceptors and electron donors, respectively.43 Fig. 3(d) summarizes the dependence of the quenching ratios of MV to the PL of CDs irradiated by UV light for different time. The quenching ratios are estimated to be about 28% and change very little between different CDs. The slight deviation of the quenching ratio of the CDs irradiated by different time could be due to the experimental errors induced in the PL measurements. These results proved that electron donating property, i.e. the oxidability of the CDs are not changed by UV light irradiation. When the CDs are mixed with 0.1 M TEOA, however, their PL are quenched with different degrees (as shown in Fig. 4). The longer the UV light irradiation time, the smaller the degree of PL quenching. This indicates that the electron accepting property of the CDs are weakened by UV light irradiation. Combining the above spectral and chemical analysis, we can conclude that the oxidizing functional groups on the CDs are photoreduced by the UV light. According to K. Mallik, when irradiated by UV light, the direct photolysis of H2O generates H˙ and OH˙, then the hydroxymethyl in glucose left over after the hydrothermal reaction are easily oxidized by H˙/OH˙ yields –(C˙–OH)–, which has strong reducing property as H atoms. The formed –(C˙–OH)– can reduce the oxidative groups on the CDs.30 Fig. S5(a) and (b)† show the PL change of the CDs irradiated by light with 395 nm and 425 nm, respectively. The PL excited by 320 nm of the CDs changes significantly after 395 nm light irradiation, while that of the CDs irradiated by 425 nm changes little. These results indicate that the photon energy of the irradiating light decides the tuning effect on the PL of CDs. Only when the wavelength of the irradiating light is short enough, the photoinduced reactions can take place, and the PL of the CDs can be changed.
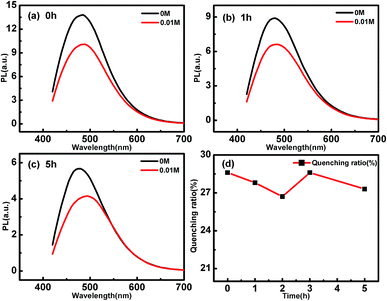 | ||
| Fig. 3 PL quenching of (a) p-CDs, (b) 1h-CDs and (c) 5h-CDs by 0.01 M MV molecules. (d) Quenching ratio of CDs after UV light for different time. | ||
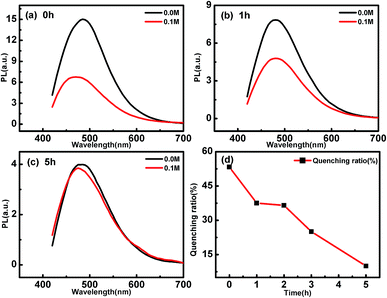 | ||
| Fig. 4 PL quenching of (a) p-CDs, (b) 1h-CDs and (c) 5h-CDs by 0.1 M TEOA molecules. (d) Quenching ratio of CDs after UV light for different time. | ||
According to the previous reports, both the intrinsic state emission of the carbonic core and the surface defects caused by functional groups could contribute to the PL of the CDs.34,41,45 To clarify the PL change of the CDs induced by the UV irradiation, the fluorescence dynamics of the p-CDs and 1h-CDs are monitored using TRPL spectroscopy with excitation wavelengths of 343 nm and 400 nm. Fig. 5(a) show the decay process of the 480 nm emission under the excitation of 400 nm. From the Fig. 5 we can see that, the 480 nm emission of p-CDs and 1h-CDs show all most the same temporal behavior, the decay process of which could be well fitted using double-exponential functions. A fast decay process ranging of 1.6–1.9 ns and a slow decay process of 6.3–6.9 ns are observed. The fast decay process is due to the direct excitation–recombination of carriers on the surface states, while the slow decay could be due to the relaxation of the carrier from the excited carbonic-core to the surface groups. For the 480 nm emissions, the reduction of the PL intensity by UV light irradiation only comes from the decrease of the surface functional groups, and the recombination paths are not changed.
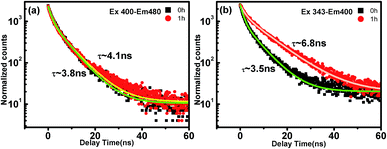 | ||
| Fig. 5 PL dynamics of (a) emission of 480 nm at 400 nm excitation and (b) emission of 400 nm at 343 nm excitation of p-CDs and 1h-CDs. | ||
For the 400 nm emission of 1h-CDs excited by 343 nm, however, the decay process is obviously prolonged compared with that of p-CDs. Table 1 summarizes the fitting parameters of the lifetime of the PL. From the fitting results, both the slow decay coefficient (∼10 ns) and its ratio (∼60%) are increased after UV irradiation. The decrease of the fast component is due to the reduction of direct excitation and recombination of the surface states. The changing PL decay time proves the transformation of surface state emission to intrinsic state emission from p-CDs to 1h-CDs. The lifetime of the emission becomes longer due to the suppression of non-radiative recombination process caused by functional groups.35,46
| λex (nm) | λem (nm) | τ1 (ns) | τ2 (ns) | τave (ns) | |
|---|---|---|---|---|---|
| 0 h | 343 | 400 | 1.4 (59%) | 6.5 (41%) | 3.5 |
| 1 h | 343 | 400 | 1.9 (40%) | 10.0 (60%) | 6.8 |
| 0 h | 400 | 480 | 1.6 (53%) | 6.3 (47%) | 3.8 |
| 1 h | 400 | 480 | 1.9 (56%) | 6.9 (54%) | 4.1 |
Conclusions
In summary, the effect of UV light irradiation on the photoluminescence CDs is investigated. The PL of CDs in the visible region is weakened while that in the UV region increases significantly as the irradiation time. The content of carbonyl groups decreases significantly with the increase of the irradiation time, resulting in decrease of the PL in the visible region. The temporal behavior of the PL indicate that emission enhancement in UV region is originated from the transformation of surface state emission to intrinsic state emission. Our findings will bring new insights into the tuning of the optical properties of CDs, as well as a deeper understanding on their PL mechanism.Conflicts of interest
There are no conflicts to declare.Acknowledgements
This work was supported by National R&D Program of China (2017YFA0207400), and the National Natural Science Foundation of China (Grant No. 11674260, and 61690221), the Key Research and Development Program of Shaanxi Province (Grant No. 2017ZDXM-GY-120), the Fundamental Research Funds for the Central Universities (No. xjj2017189), and the Collaborative Innovation Center of Suzhou Nano Science and Technology. The TEM work was performed at the International Center for Dielectric Research (ICDR), Xi'an Jiaotong University, Xi'an, China. The authors also thank Mr Ma and Ms Lu for their help in using TEM.References
- S. N. Baker and G. A. Baker, Angew. Chem., Int. Ed. Engl., 2010, 49, 6726–6744 CrossRef CAS PubMed.
- S. Y. Lim, W. Shen and Z. Gao, Chem. Soc. Rev., 2015, 44, 362–381 RSC.
- V. Kumar, G. Toffoli and F. Rizzolio, ACS Med. Chem. Lett., 2013, 4, 1012–1013 CrossRef CAS PubMed.
- P. Miao, K. Han, Y. Tang, B. Wang, T. Lin and W. Cheng, Nanoscale, 2015, 7, 1586–1595 RSC.
- J. Bartelmess, S. J. Quinn and S. Giordani, Chem. Soc. Rev., 2015, 44, 4672–4698 RSC.
- X. T. Zheng, A. Ananthanarayanan, K. Q. Luo and P. Chen, Small, 2015, 11, 1620–1636 CrossRef CAS PubMed.
- Q. Hao, J. Pang, Y. Zhang, J. Wang, L. Ma and O. G. Schmidt, Adv. Opt. Mater., 2018, 6, 1700984 CrossRef.
- S. Zhu, Q. Meng, L. Wang, J. Zhang, Y. Song, H. Jin, K. Zhang, H. Sun, H. Wang and B. Yang, Angew. Chem., Int. Ed. Engl., 2013, 52, 3953–3957 CrossRef CAS PubMed.
- J. Wang, F. Peng, Y. Lu, Y. Zhong, S. Wang, M. Xu, X. Ji, Y. Su, L. Liao and Y. He, Adv. Opt. Mater., 2015, 3, 103–111 CrossRef CAS.
- H. Wang, Y. Xie, X. Na, J. Bi, S. Liu, L. Zhang and M. Tan, Food Chem., 2019, 286, 405–412 CrossRef CAS PubMed.
- R. Mohammadinejad, A. Dadashzadeh, S. Moghassemi, M. Ashrafizadeh, A. Dehshahri, A. Pardakhty, H. Sassan, S. Sohrevardi and A. Mandegary, J. Adv. Res., 2019, 18, 81–93 CrossRef PubMed.
- J. Tang, B. Kong, H. Wu, M. Xu, Y. Wang, Y. Wang, D. Zhao and G. Zheng, Adv. Mater., 2013, 25, 6569–6574 CrossRef CAS PubMed.
- W. Shi, X. Li and H. Ma, Angew. Chem., Int. Ed. Engl., 2012, 51, 6432–6435 CrossRef CAS PubMed.
- V. Nguyen, L. Yan, J. Si and X. Hou, Opt. Mater. Express, 2016, 6, 312 CrossRef CAS.
- V. Nguyen, L. Yan, H. Xu and M. Yue, Appl. Surf. Sci., 2018, 427, 1118–1123 CrossRef CAS.
- X. He, Y. Gu, S. Ai, M. Xie, Q. Lu, Y. Wang and J. Wang, Appl. Surf. Sci., 2018, 462, 303–309 CrossRef CAS.
- X. Zhang, Y. Zhang, Y. Wang, S. Kalytchuk, S. V. Kershaw, Y. Wang, P. Wang, T. Zhang, Y. Zhao, H. Zhang, T. Cui, Y. Wang, J. Zhao, W. W. Yu and A. L. Rogach, ACS Nano, 2013, 7, 11234–11241 CrossRef CAS PubMed.
- W. Kwon, S. Do, J. H. Kim, J. M. Seok and S. W. Rhee, Sci. Rep., 2015, 5, 12604 CrossRef CAS PubMed.
- W. F. Zhang, H. Zhu, S. F. Yu and H. Y. Yang, Adv. Mater., 2012, 24, 2263–2267 CrossRef CAS PubMed.
- S. Qu, X. Liu, X. Guo, M. Chu, L. Zhang and D. Shen, Adv. Funct. Mater., 2014, 24, 2689–2695 CrossRef CAS.
- Y. P. Sun, B. Zhou, Y. Lin, W. Wang, K. A. Fernando, P. Pathak, M. J. Meziani, B. A. Harruff, X. Wang, H. Wang, P. G. Luo, H. Yang, M. E. Kose, B. Chen, L. M. Veca and S. Y. Xie, J. Am. Chem. Soc., 2006, 128, 7756–7757 CrossRef CAS PubMed.
- L. Cao, X. Wang, M. J. Meziani, F. Lu, H. Wang, P. G. Luo, Y. Lin, B. A. Harruff, L. M. Veca, D. Murray, S. Y. Xie and Y. P. Sun, J. Am. Chem. Soc., 2007, 129, 11318–11319 CrossRef CAS PubMed.
- J. Pang, A. Bachmatiuk, Y. Yin, B. Trzebicka, L. Zhao, L. Fu, R. G. Mendes, T. Gemming, Z. Liu and M. H. Rummeli, Adv. Energy Mater., 2018, 8, 1702093 CrossRef.
- K. Wang, J. Pang, L. Li, S. Zhou, Y. Li and T. Zhang, Front. Chem. Sci. Eng., 2018, 12, 376–395 CrossRef CAS.
- J. Pang, R. G. Mendes, P. S. Wrobel, M. D. Wlodarski, H. Q. Ta, L. Zhao, L. Giebeler, B. Trzebicka, T. Gemming, L. Fu, Z. Liu, J. Eckert, A. Bachmatiuk and M. H. Rümmeli, ACS Nano, 2017, 11, 1946–1956 CrossRef CAS PubMed.
- J. Pang, R. G. Mendes, A. Bachmatiuk, L. Zhao, H. Q. Ta, T. Gemming, H. Liu, Z. Liu and M. H. Rummeli, Chem. Soc. Rev., 2019, 48, 72–133 RSC.
- Y. Wang and A. Hu, J. Mater. Chem. C, 2014, 6921 RSC.
- H. Li, S. Pang, X. Feng, K. Mullen and C. Bubeck, Chem. Commun., 2010, 46, 6243–6245 RSC.
- H. Sun, L. Wu, N. Gao, J. Ren and X. Qu, ACS Appl. Mater. Interfaces, 2013, 5, 1174–1179 CrossRef CAS PubMed.
- K. Mallik, M. Mandal, N. Pradhan and T. Pal, Nano Lett., 2001, 1, 319–322 CrossRef CAS.
- C. M. Gonzalez, Y. Liu and J. C. Scaiano, J. Phys. Chem. Lett. C, 2009, 113, 11861–11867 CrossRef CAS.
- M. Sakamoto, T. Tachikawa, M. Fujitsuka and T. Majima, Adv. Funct. Mater., 2007, 17, 857–862 CrossRef CAS.
- D. Tan, S. Zhou, Y. Shimotsuma, K. Miura and J. Qiu, Opt. Mater. Express, 2014, 4, 213 CrossRef CAS.
- V. Nguyen, J. Si, L. Yan and X. Hou, Carbon, 2016, 108, 268–273 CrossRef CAS.
- L. Dong, Z. Xiong, X. Liu, D. Sheng, Y. Zhou and Y. Yang, J. Appl. Polym. Sci., 2019, 136, 47555 CrossRef.
- T. Lai, E. Zheng, L. Chen, X. Wang, L. Kong, C. You, Y. Ruan and X. Weng, Nanoscale, 2013, 5, 8015 RSC.
- C. J. Reckmeier, J. Schneider, A. S. Susha and A. L. Rogach, Opt. Express, 2016, 24, A312 CrossRef CAS PubMed.
- A. Prasannan and T. Imae, Ind. Eng. Chem. Res., 2013, 52, 15673–15678 CrossRef CAS.
- M. Chen, W. Wang and X. Wu, J. Mater. Chem. B, 2014, 2, 3937–3945 RSC.
- Z. Xu, L. Yang, X. Fan, J. Jin, J. Mei, W. Peng, F. Jiang, Q. Xiao and Y. Liu, Carbon, 2014, 66, 351–360 CrossRef CAS.
- D. Tan, S. Zhou, B. Xu, P. Chen, Y. Shimotsuma, K. Miura and J. Qiu, Carbon, 2013, 62, 374–381 CrossRef CAS.
- L. Wang, S. J. Zhu, H. Y. Wang, S. N. Qu, Y. L. Zhang, J. H. Zhang, Q. D. Chen, H. L. Xu, W. Han, B. Yang and H. B. Sun, ACS Nano, 2014, 8, 2541–2547 CrossRef CAS PubMed.
- V. Strauss, J. T. Margraf, C. Dolle, B. Butz, T. J. Nacken, J. Walter, W. Bauer, W. Peukert, E. Spiecker, T. Clark and D. M. Guldi, J. Am. Chem. Soc., 2014, 136, 17308–17316 CrossRef CAS PubMed.
- R. G. Mendes, J. Pang, A. Bachmatiuk, H. Q. Ta, L. Zhao, T. Gemming, L. Fu, Z. Liu and M. H. Rümmeli, ACS Nano, 2019, 2, 978–995 Search PubMed.
- S. Zhu, J. Zhang, S. Tang, C. Qiao, L. Wang, H. Wang, X. L. B. Liu, Y. Li, W. Yu, X. Wang, H. Sun and B. Yang, Adv. Funct. Mater., 2012, 22, 4732–4740 CrossRef CAS.
- K. Olszowska, J. Pang, P. S. Wrobel, L. Zhao, H. Q. Ta, Z. Liu, B. Trzebicka, A. Bachmatiuk and M. H. Rummeli, Synth. Met., 2017, 234, 53–85 CrossRef CAS.
Footnote |
| † Electronic supplementary information (ESI) available. See DOI: 10.1039/c9ra02080b |
| This journal is © The Royal Society of Chemistry 2019 |

