 Open Access Article
Phosphorescent immunosensor for simple and sensitive detection of microcystin-LR in water†
Jin Qin ,
Xiaojie Sun,
Dongxia Li and
Guiqin Yan
 *
*
Shanxi Normal University, Linfen, Shanxi 041000, China. E-mail: gqyan2013@163.com; Fax: +86-0357-2051249
First published on 25th April 2019
Abstract
A simple and sensitive Mn–ZnS quantum dot room-temperature phosphorescent immunosensor for detecting microcystin-LR was developed. This sensor adopted antigens and antibodies as recognition units and used Mn–ZnS RTP QDs as sensing materials to specifically bind with MC-LR. The structurally specific binding between the microcystin-LR antibody and MC-LR led to the aggregation of antibody-crosslinked QDs, and then the electrons of QDs would be transferred to the complex, leading to the phosphorescence quenching of QDs. The microcystin-LR antigen–antibody specific binding site was first analyzed. This phosphorescent immunosensor rapidly and sensitively detected microcystin-LR, with linear ranges of 0.2–1.5 μg L−1 and 1.5–20 μg L−1 and a detection limit of up to 0.024 μg L−1. Meanwhile, coexisting pollutants of microcystin-LR in water did not significantly interfere with microcystin-LR detection. The new sensor was applied to detect real water samples and showed high sensitivity and selectivity.
1 Introduction
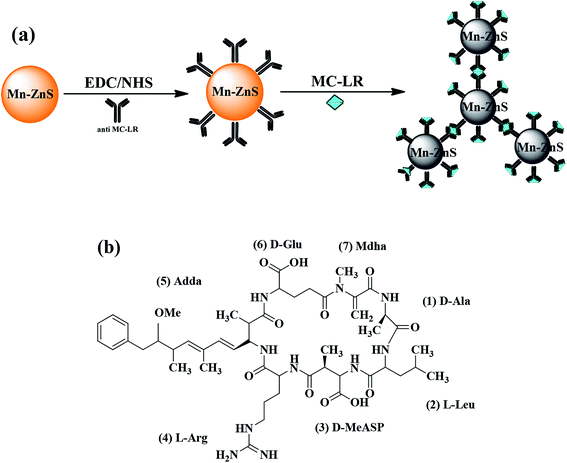
The aggravation of eutrophication has increased the occurrence frequency and amplitude of algal blooms, especially toxic algal blooms, which have caused harm to water environments and increased biological unsafety. Microcystin-LR (MC-LR) is one of the most toxic pollutants released by blue algae in eutrophicated waters. Even under low concentrations, MC-LR can severely inactivate protein phosphatases 1 (PP1) and 2A (PP2A).1 A low concentration of MC-LR in drinking water could cause liver damage to humans and contribute to liver cancer.2 However, MC-LR is a stable chemical that is nearly non-degradable in nature due to the presence of ring structures and double bonds (Fig. 1b).3 The World Health Organization set the maximum MC-LR concentration in drinking water to be 1 μg L−1 in 1998.4 Thus, the development of new methods for the detection of low-concentration MC-LR has become increasingly important in the field of environmental analysis.Numerous analytical methods, including high-performance liquid chromatography (HPLC),5 liquid chromatography-mass spectrometry (LC-MS),6 protein phosphatase inhibition assay (PPIA),7 and whole-cell bioassay,8 have been used to detect MC-LR. However, these methods all require complicated preparation, expensive heavy equipment, high professional skills, and considerable amount of time, and their selectivity and sensitivity are unsatisfactory. Therefore, immunoassays are of great significance for the qualitative and quantitative detection of MC-LR because of their highly specific molecular recognition and without complicated pretreatment. Various immunosensors based on fluorescence,9–11 colorimetry12–14 and electrochemistry15–17 have been developed. The best candidates of MC-LR are electrochemical immunosensors due to their high sensitivity and simplicity. However, in electrochemical immunoassays, antibodies are commonly immobilized on the electrode surface by physical adsorption, which may lead to irreversible protein denaturation, then inhibit the interaction between the antibody and the analytical device.18 Therefore, it is necessary to develop a method that is sensitive, reliable, and easy to operate.
Room-temperature phosphorescent (RTP) quantum dots (QDs) are characterized by the avoidance of deoxidization, long phosphorescence lifetime, and effective avoidance of interference from spontaneous fluorescence and scattering light.19–24 RTP QDs applied into analysis and detection of environmental pollutants can efficiently avoid interferences of background fluorescence or scattering light from other fluorescent substances in the environment, thus demonstrating the prospective application of these QDs. The 3-mercaptopropionic acid (MPA)-coated Mn-doped ZnS (Mn–ZnS) QDs synthesized from a water-phase method could improve the efficiency and reproducibility of Mn-doping and enhance the luminescent efficiency and biocompatibility of QDs. Moreover, the QDs have low toxicity and do not require complicated pretreatment.25 Thus, RTP QDs are more applicable than fluorescent QDs for detecting target molecules in complex environmental samples.
With the cross-linking agents 1-ethyl-3-(3-dimethylaminopropyl)carbodiimide/N-hydroxysuccinimide (EDC/NHS), the Mn–ZnS RTP QDs and microcystin-LR antibody (anti-MC-LR) were combined to form anti-MC-LR/QDs nanohybrids for MC-LR detection. The structurally specific binding between anti-MC-LR and MC-LR led to the aggregation between anti-MC-LR/QDs and MC-LR, resulting in the gradual quenching of RTP. Within a certain range, the quenched degree of the RTP was proportional to the concentration of MC-LR. On this basis, an efficient RTP biosensor for MC-LR detection was built. Fig. 1a shows the process of building a sensor.
2 Experimental
2.1 Materials and reagents
MPA (J&K China Chemical Ltd.); Mn(Ac)2·4H2O, Zn(Ac)2·2H2O, Na2S·9H2O (Tianjin Kemiou Chemical Co., China); EDC, NHS, MC-LR (Sigma, US) were used in the experiments. Malachite green (MG), microcystin-RR (MC-RR), and paraquat (PQ) were bought from Shanghai Sangon Biotechnology Co. Ltd. (China). All other reagents were of analytical purity.2.2 Instruments
The morphology of the QDs was characterized by using a JEM-2100 transmission electron microscope (TEM, JEOL Ltd. Japan). The crystal structures of QDs were analyzed on a Rigaku D/max-2500 X-ray diffractometer (XRD, Ricoh, Japan). Phosphorescence spectra were recorded on a Cary Eclipse fluorescence spectrophotometer (Varian Co. Ltd, US). The pH meter was bought from Shanghai (Lei-ci, China). Resonance light scattering (RLS) signals were measured on the Cary Eclipse fluorescence spectrophotometer (Δλ = 0) at 200–700 nm. Ultraviolet-visible light (UV-vis) spectra were detected on a UV-29100 UV/vis spectrophotometer (Shimadzu, Japan).2.3 Preparation of MPA-coated Mn–ZnS QDs
MPA-coated Mn–ZnS QDs were prepared as follows:26,27 under argon gas protection, 5 mL of 0.1 M Zn(Ac)2 solution and 2 mL of 0.01 M Mn(Ac)2 solution were added into 50 mL of a 0.02 M MPA solution in a 100 mL three-neck flask. The mixture was adjusted to pH 11 using 1 M NaOH solution and then magnetically stirred at room temperature for 30 min, which ensured the complete complexation of MPA with Zn2+ and Mn2+. Afterward, 5 mL of 0.1 M Na2S solution was added for 20 min of reaction at room temperature. The resulting reaction system was aged in air and at 50 °C for 2 h, which resulted in the formation of MPA-coated Mn–ZnS QDs. The QDs were precipitated in an equal volume of anhydrous ethanol, and then the supernatant was removed after high-speed centrifugation. The precipitates were vacuum-dried at room temperature for 24 h, which resulted in solid powder nanoparticles, namely, the QDs.2.4 Biological conjugation between anti-MC-LR and Mn–ZnS QDs
The biological conjugation between Mn–ZnS QDs and anti-MC-LR was conducted as reported.28,29 First, the anti-MC-LR was dissolved in a 10 mM phosphate buffer solution (PBS, pH 7.4) to form a 5.0 mg ml−1 solution, which was stored at 4 °C. Afterward, 2 mg of Mn–ZnS QDs, 2 mg of EDC, and 1 mg of NHS were dissolved in 0.5 mL of PBS (10 mM, pH 7.4). The mixture was then stirred for 30 min to ensure full activation of surface carboxyl groups of the QDs. The resulting solution was added with 0.5 mL of the MC antibody solution, stirred for 2 h, and stored overnight at 4 °C and in the dark, ensuring that the unreacted EDC was completely dissolved in water. The resulting anti-MC-LR/QDs nanohybrids were separated via ultrafiltration membrane centrifugation. The unreacted anti-MC-LR was removed, and the resulting solution was dissolved in 5 mL of PBS (10 mM, pH 7.4).2.5 Molecular docking method
The NCBI protein database was used to search the amino acid sequence of the human anti-MC-LR Fv antibody. The employed protein sequences of anti-MC-LR light and heavy chain single-chain Fv antibodies were AAN16433.1 and AAN16432.1, respectively, as reported by McElhiney. The BLAST server was used to search the templates for the chains. Human IgM (PDB ID: 2J6E) and human monoclonal bo2c11 fab heavy chain (PDB ID: 1IQD) were respectively applied as the templates for the light and heavy chains of the human anti-microcystin-LR Fv antibody, and the homology of amino acid sequences was aligned. Homology modeling of anti-MC-LR Fv antibody was conducted using Modeller 9.19 package. Molecular docking studies were performed to investigate the binding mode between the antigen microcystin and human anti-microcystin-LR Fv antibody using Autodock Vina 1.1.2.302.6 Detection methods
The nanohybrid solution was diluted to a 200 μg L−1 water solution to study the effects of MCs on the RTP intensity of the anti-MC-LR/QD nanohybrids. Then, 0.25 mL PBS (10 mM, pH 7.4) was added to each series of colorimetric tubes. Each tube was added with 100 μL of the nanohybrid solution and a certain amount of MC-LR (0–100 μg L−1). The tubes were shaken evenly, diluted to 5 mL and placed for 10 min, followed by RTP detection at 295 nm.2.7 Sample detection
Water samples were collected from tap, pond water and Yuxiu lake. The filter paper and the 0.22 μm film were then used continuously for sample purification, rotationally evaporated, and concentrated 30 times before analysis. Each experiment was conducted in triplicate. The detection performance of MC-LR in the actual samples was verified by a spike recovery test, and the experiment was repeated three times.3 Results and discussion
3.1 Characterization of MPA-coated Mn–ZnS QDs
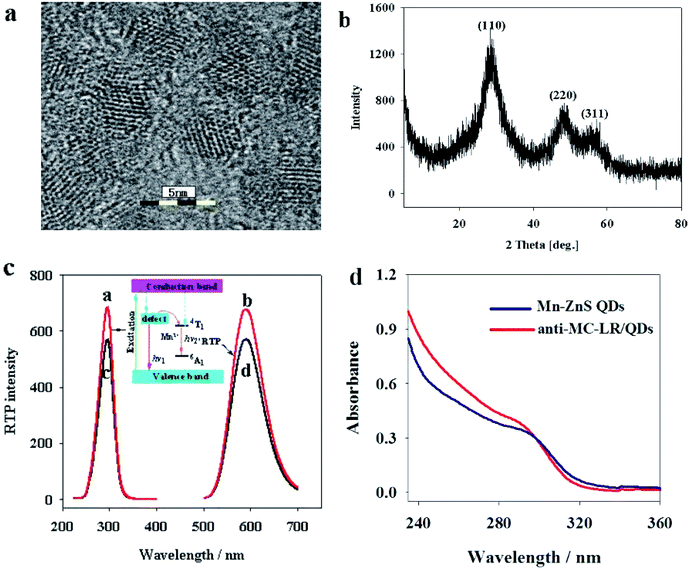
The Mn–ZnS QDs under high-resolution TEM were found to be 4.0 nm in uniform size (Fig. 2a), approximately spherical with evident crystal lattices, and well dispersed. X-ray diffraction spectra (Fig. 2b) indicated that the Mn–ZnS QDs have three evident diffraction peaks, which correspond to the (111), (220), and (311) planes, indicating the Mn–ZnS QDs have typical cubic structures. Moreover, phosphorescence scanning showed that the QDs had the largest excitation and emission peaks at 285 and 595 nm, respectively (Fig. 2c). After the absorption of excitation light, the holes of ZnS were captured by Mn2+, while the electrons and holes recombined on Mn2+ to cause the excitation of Mn, which induced the formation of RTP emission (590 nm).31 After conjugation with the anti-MC-LR, the excitation and emission peaks of the QDs remained unchanged, except for the slight reduction of intensity (Fig. 2c). This finding was probably because the conjugation with the MC antibody led to the formation of a few surface defects on the QDs, slightly reducing the spectral intensity. However, the luminescence center of Mn2+ in the ZnS crystal lattices was not changed; thus, the peak forms were also unchanged. UV-vis spectra showed (Fig. 2d) that the UV absorption spectra of QDs increased after cross-linking antibodies, indicating the coupling of the antibodies to QDs.3.2 Feasibility assay
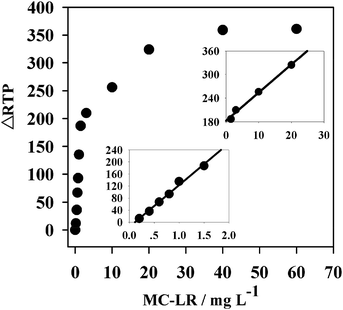
To verify the feasibility of the proposed anti-MC-LR/QDs phosphorescent immunosensor for MC-LR detection, we investigated the MC-LR concentrations would affect the RTP intensity of anti-MC-LR/QDs. Fig. 3a shows that the RTP intensity at 590 nm of anti-MC-LR/QDs is gradually quenched with the rise of MC-LR concentration. Fig. 3b shows at the MC-LR concentration of 40 μg L−1, the RTP intensity of anti-MC-LR/QDs basically stabilizes. This phenomenon suggests the MC-LR concentration largely affects the RTP intensity of anti-MC-LR/QDs. In this case, it is possible to build a sensitive MC-LR detection method.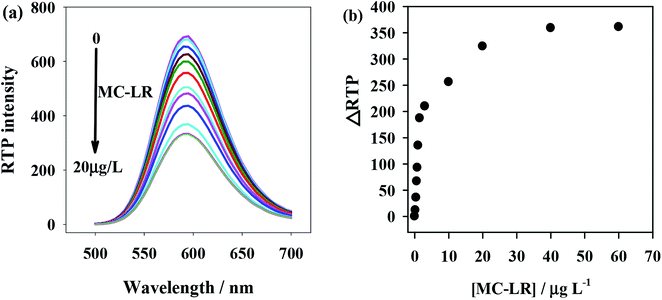 | ||
| Fig. 3 (a) MC-LR concentration-dependent RTP emission of the anti-MC-LR/QDs hybrids. (b) The relationship between ΔRTP and MC-LR concentration. | ||
3.3 Mechanism of anti-MC-LR/QD nanohybrids for MC-LR detection
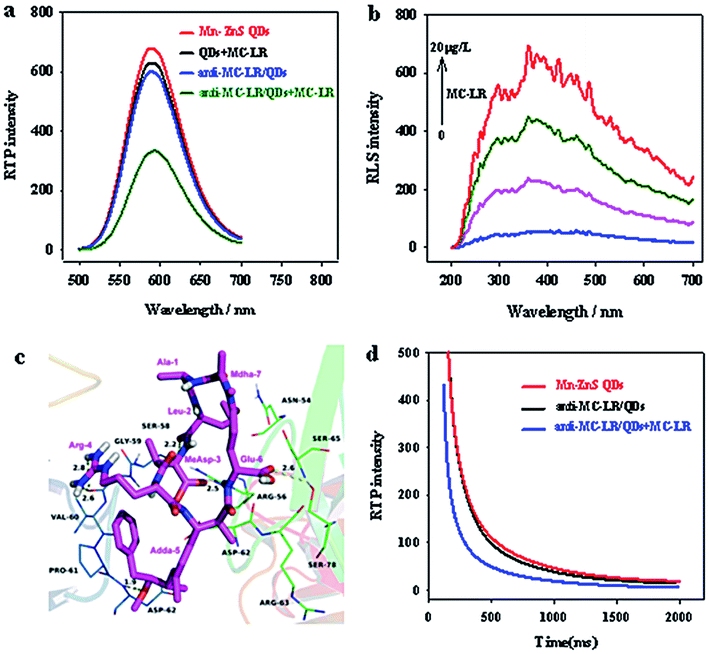
When MC-LR was added, the phosphorescence of Mn–ZnS QDs unconjugated antibody was not quenched (Fig. 4a). This finding indicates that the phosphorescence of QDs was not directly quenched by MC-LR but by the specific binding between MC-LR and anti-MC-LR/QD nanohybrids.Two substances that aggregate through interaction to produce scattering particles would generate remarkable RLS signals. The RLS changes after the interaction between anti-MC-LR/QD nanohybrids and MC-LR indicate that the newly added MC-LR and the QD nanohybrids have significantly aggregated (Fig. 4b). In the range 200–700 nm, after MC-LR was added into the anti-MC-LR/QD nanohybrids, the RLS intensity of the entire system was gradually enhanced, indicating the combination of QDs with multiple anti-MC-LR and the possibility of binding with additional MC-LR. Moreover, the anti-MC-LR/QD nanohybrids and MC-LR interacted to form large nanohybrid particles.
Furthermore, molecular docking studies have shown that the MC-LR was docked to the active pocket of anti-MC-LR to illustrate the binding mode between antigen MC-LR and anti-MC-LR from the molecular level. The MC-LR in the form of tight conformations clearly bound to the variable zone at the top of the anti-MC-LR (Fig. 4c). The residue Adda-5 of the MC-LR was located at the hydrophobic cavity pocket formed between the amino acid residues A/Val-60 and A/Pro-61 of the MC antibody, creating a stable hydrophobic interaction. Further analysis showed that the benzene ring side-chain on the residue Adda-5 could separately undergo anion–π interaction with the amino-acid residues A/Asp-62 and B/Asp-62. Importantly, the amino acid residues Leu-2, MeAsp-3, Adda-5, and Glu-6 of MC-LR could interact with the amino acid residues A/Ser-58, B/Arg-56, A/Asp-62, and B/Ser-78 of the MC antibody, respectively, forming 2.2, 2.5, 1.9, and 2.6 Å hydrogen bonds, respectively. Moreover, the amino acid residue Arg-4 of MCs could interact with the amino acid residue A/Gly-59 of anti-human MC-LR Fv antibody, forming double hydrogen bonds of 2.6 and 2.8 Å. Such a special binding facilitated the formation of stable hybrids by the antigen MC-LR and the anti-MC-LR.
Overall, the aforementioned molecular docking experiments could well explain the interaction between the MC and its antibody and underlie further research on the interaction between the MC-LR antibody and antigen MC-LR.
The quenching mechanism can be explained by molecular orbital theory. The electrons of QDs could evidently accept ultraviolet energy and then be excited from the ground state (valence band) to the conduction band. The electrons of the QDs are then excited and returned to the ground state. During the return process, QDs could emit orange phosphorescence. By contrast, with the existence of MC-LR, a hydrogen bond could be formed between the MC-LR and the primary amino group on the surface of the QDs. Strong interaction forces lead to electron transfer between the MC-LR and QDs. The UV absorption peak of MC-LR is close to the conduction band of QDs, and the excited electrons could directly jump to the LUMO level layer of the complex. The energy level of the complex was higher than that of QDs. Therefore, the excited electrons of QDs can return to the ground state without emitting phosphorescence, resulting in quenching of QD phosphorescence.17 Furthermore, with the addition of MC-LR, the phosphorescence lifetime of QDs was significantly shortened (Fig. 4d) because the large-size nanoparticles, as the energy receptor, provided multiple extra attenuation channels during the clustering of QDs.32,33
3.4 Influence factors on the anti-MC-LR/QDs nanohybrids
The influence factors of pH, reaction time, and salt concentration were selected to enhance the stability and selectivity of this system. The pH 6.5–7.5, which was close to the pI of the anti-MC-LR, contributed to the phosphorescence absorption of anti-MC-LR/QDs and thus maximized the phosphorescence intensity. However, when pH was extremely low, the bioconjugated system would carry excessive like charges, which were repelled statically and thereby weakened the phosphorescence. Thus, the optimal pH was set at 7.4 in the subsequent experiments to study the effects of ionic strength on the phosphorescence intensity of the bioconjugated system (Fig. S1a†). Appropriate ionic strength could reduce the static repulsion between anti-MC-LR/QDs molecules and thereby promoted phosphorescence absorption. However, excessive NaCl concentration would enhance the protein hydration and inhibit the affinity of absorption, thereby reducing the fluorescence absorption of the bioconjugated system. Thus, the NaCl concentration was set at 50–100 mM (Fig. S1b†). The RTP intensity of the anti-MC-LR/QD bioconjugated system was unchanged within 24 h, which also confirmed the stability of QDs after crosslinking with the anti-MC-LR (Fig. S1c†).3.5 Anti-MC-LR/QD nanohybrids for MC-LR detection
According to the preceding results, an RTP MC-LR detection sensor was designed based on anti-MC-LR/QDs nanohybrids. Under the optimal conditions, the RTP variation of the nanohybrids was linearly correlated to the MC-LR concentration within a certain range.The linear ranges of this sensor in MC-LR detection were 0.2–1.5 μg L−1 and 1.5–20 μg L−1 (Fig. 5), corresponding to the linear equations ΔRTP = 138.33CMC-LR − 15.078 (R2 = 0.9913) and ΔRTP = 7.1313CMC-LR + 182.74 (R2 = 0.9926), respectively. This sensor had a detection limit of (3σ) 0.024 μg L−1. The relative standard deviation (RSD) of 11 parallel detections over a solution without MC-LR and a 2 μg L−1 MC-LR solution was 3.4%. The detection limit of this sensor was lower than LC-MS, PPIA, aptamer-based colorimetric sensor, and FL chromatic immunosensor, but higher than electrochemiluminescent immunosensor (Table 1). However, in electrochemical immunosensors, the antibodies are commonly immobilized on the surface of the electrode by physical absorption, which might lead to non-reversible protein denaturation.18 This detection limit is also simpler and cheaper.
| Methods | Detection range | LOD | Reference |
|---|---|---|---|
| LC-MS | 2.3–18.1 μg g−1 | — | 6 |
| PPIA | — | 3.9 nM | 7 |
| Aptamer-based colorimetric sensor | 0.5 μg L−1 to 7.5 g L−1 | 0.37 μg L−1 | 34 |
| Electrochemiluminescent immunosensor | 0.01–50 μg L−1 | 0.0028 μg L−1 | 35 |
| Fluorescent immunosensor | 0.42–25 μg L−1 | 0.03 μg L−1 | 36 |
| Electrochemical aptasensor | 0.005–30 μg L−1 | 0.002 μg L−1 | 37 |
| Electrochemical immunosensor | 0.01–50 μg L−1 | 0.007 μg L−1 | 38 |
| PL immunosensor | 0.2–20 μg L−1 | 0.024 μg L−1 | This work |
3.6 Anti-interference detection
Given the prospects of using the anti-MC-LR/QDs sensor into the environment field, its selectivity over MC-LR was evaluated (Fig. S2†). Specifically, some coexisting substances of MC-LR, including anions (CO32−, PO43−), cations (Ca2+, Mg2+), amino acids (serine Ser, histidine His), malachite green (MG), microcystin-RR (MC-RR), and paraquat (PQ), were added. None of these substances significantly affected experimental selectivity.3.7 MC-LR detection in water samples
MC-LR was detected in real spiked and pond water through standard spiked experiments to evaluate the practical applicability of this sensor. The spiked water was added with MC-LR standard solution of one concentration, while the pond water was added with three MC-LR standard solutions with different concentrations. The results are presented in Table 2. The recovery rates of the phosphorescent immunosensor were 93.1% to 105%, and the standard deviations were 3.07% to 7.12%. Antigens and antibodies, which could bind with the selective, appetent, and specific MC-LR, were used as recognition units of the new immunosensor to further improve its sensitivity and precision. Moreover, the new sensor could be easily built, responded quickly and avoided interference.| Water samples | Original (μg L−1) | Spiked (μg L−1) | Measured (μg L−1) | RSD (%) | Recoveries (%) |
|---|---|---|---|---|---|
| a nd: not found. | |||||
| Tap water | nd | 0.2 | 0.21 | 5.32 | 105 |
| nd | 2 | 1.89 | 3.07 | 94.5 | |
| nd | 8 | 7.74 | 4.89 | 96.8 | |
| Pond water | nd | 0.2 | 0.19 | 6.34 | 95 |
| nd | 2 | 2.09 | 4.73 | 104.5 | |
| nd | 8 | 8.21 | 3.45 | 102.6 | |
| Yuxiu lake | 0.09 | 0.2 | 0.27 | 7.12 | 93.1 |
| 0.11 | 2 | 2.14 | 3.68 | 101.4 | |
| 0.82 | 8 | 8.62 | 5.2 | 97.7 | |
4 Conclusions
A simple and fast RTP sensor based on the specific antigen–antibody binding was designed for microcystin detection. This sensor did not need any complicated pretreatment and avoided interference from the background fluorescence or scattering light of other fluorescent substances. Moreover, the Mn–ZnS QDs did not cause any secondary environmental pollution and could be easily prepared. Owing to its high sensitivity and broad linear range, this sensor will be applied into the environmental field.Conflicts of interest
There are no conflicts to declare.Acknowledgements
This work was supported by the Research Fund for the Doctoral Program of Higher Education of China (No: 20111404110002). Fund for Construction Program of Chemical Advantage and Key Discipline of Shanxi Province of China (No: 912019).References
- F. Long, M. He, A. Zhu and H. Shi, Biosens. Bioelectron., 2009, 24, 2346–2351 CrossRef CAS PubMed.
- S. Singh, A. Srivastava, H. M. Oh, C. Y. Ahn, G. G. Choi and R. K. Asthana, Toxicon, 2012, 60, 878–894 CrossRef CAS PubMed.
- K. Chen, M. C. Liu and G. H. Zhao, Environ. Sci. Technol., 2012, 46, 11955–11961 CrossRef CAS PubMed.
- W.H.O., Geneva, 1998, addendum to vol. 2.
- E. C. Aguete, A. Gago-Martınez, J. M. Leao, J. A. Rodrıguez-Vázquez, C. Menàrd and J. F. Lawrence, Talanta, 2003, 59, 697–705 CrossRef CAS.
- V. Ríos, I. Moreno, A. I. Prieto, M. Puerto, D. Gutiérrez-Praena, M. E. Soria-Díaz and A. M. Cameán, Food Chem. Toxicol., 2013, 57, 170–178 CrossRef PubMed.
- R. Dawson, Toxicon, 1998, 36, 953–962 CrossRef CAS PubMed.
- L. N. Sangolkar, S. S. Maske and T. Chakrabarti, Water Res., 2006, 40, 3485–3496 CrossRef CAS PubMed.
- Y. M. Kim, S. W. Oh, S. Y. Jeong, D. J. Pyo and E. Y. Choi, Environ. Sci. Technol., 2003, 37, 1899–1904 CrossRef CAS PubMed.
- M. Campàs and J. L. Marty, Biosens. Bioelectron., 2007, 22, 1034–1040 CrossRef PubMed.
- S. M. Taghdisi, N. M. Danesh and M. Ramezani, et al., Talanta, 2017, 166, 187–192 CrossRef CAS PubMed.
- L. Reverte, D. Garibo, C. Flores, J. Diogene, J. Caixach and M. Campas, Environ. Sci. Technol., 2013, 47, 471–478 CrossRef CAS PubMed.
- X. Li, R. Cheng and H. Shi, et al., J. Hazard. Mater., 2016, 1, 474–480 CrossRef PubMed.
- F. Wang, S. Liu and M. Lin, et al., Biosens. Bioelectron., 2015, 68, 475–480 CrossRef CAS PubMed.
- S. Eissa, A. Ng and M. Siaj, et al., Anal. Chem., 2014, 15, 7551–7557 CrossRef PubMed.
- X. Du, D. Jiang and L. Dai, et al., Biosens. Bioelectron., 2016, 81, 242–248 CrossRef CAS PubMed.
- Z. Lin, H. Huang and Y. Xu, et al., Talanta, 2013, 21, 371–374 CrossRef PubMed.
- Y. Zhang, M. Chen, H. Li, F. Yan, P. Pang, H. Wang, Z. Wu and W. Yang, Sens. Actuators, B, 2017, 244, 606–615 CrossRef CAS.
- L. Tan, C. Huang, R. Peng, Y. Tang and W. Li, Biosens. Bioelectron., 2014, 61, 506–511 CrossRef CAS PubMed.
- H. Labiadh, T. B. Chaabane, D. Piatkowski, S. Mackowski, J. Lalevée, J. Ghanbaja, F. Aldeek and R. Schneider, Mater. Chem. Phys., 2013, 140, 674–682 CrossRef CAS.
- H. Yan and H. Wang, Anal. Chem., 2011, 83, 8589–8595 CrossRef CAS PubMed.
- L. Tan, C. Kang, S. Xu and Y. Tang, Biosens. Bioelectron., 2013, 48, 216–223 CrossRef CAS PubMed.
- E. Sotelo-Gonzalez, M. T. Fernandez-Arguelles, J. M. Costa-Fernandez and A. Sanz-Medel, Anal. Chim. Acta, 2012, 712, 120–126 CrossRef CAS PubMed.
- Z. Xu, B. Li, W. Tang, T. Chen, H. Zhang and Q. Wang, Colloids Surf., B, 2011, 88, 51–57 CrossRef CAS PubMed.
- Y. He, H. Wang and X. Yan, Anal. Chem., 2008, 80, 3832–3837 CrossRef CAS PubMed.
- Z. Zhang, J. Li, X. Wang, D. Shen and L. Chen, ACS Appl. Mater. Interfaces, 2015, 7, 9118–9127 CrossRef CAS PubMed.
- P. Wu, Y. He, H. Wang and X. Yan, Anal. Chem., 2010, 82, 1427–1433 CrossRef CAS PubMed.
- P. Wu, J. Zhang, S. Wang, A. Zhu and D. X. Hou, Chem.–Eur. J., 2014, 20, 952–956 CrossRef CAS PubMed.
- S. Wang, N. Mamedova, N. A. Kotov, W. Chen and J. Studer, Nano Lett., 2002, 2, 817–822 CrossRef CAS.
- O. Trott and A. J. Olson, J. Comput. Chem., 2010, 31, 455–461 CAS.
- J. Zhuang, X. Zhang, G. Wang, D. Li, W. Yang and T. Li, J. Mater. Chem., 2003, 32, 1853–1857 RSC.
- S. F. Wuister and I. Swart, Nano Lett., 2003, 3, 503–507 CrossRef CAS.
- S. Mayilo, J. Hilhorst, A. S. Susha, C. Höhl, T. Franzl, T. A. Klar, A. L. Rogach and J. Feldmann, J. Phys. Chem. C, 2008, 112, 14589–14594 CrossRef CAS.
- X. Li, R. Cheng, H. Shi, B. Tang and H. Xiao, J. Hazard. Mater., 2016, 304, 474–480 CrossRef CAS PubMed.
- J. Zhang, T. Kang, Y. Hao, L. Lu and S. Cheng, Sens. Actuators, B, 2015, 214, 117–123 CrossRef CAS.
- H. Yu, A. Jang, L. Kim, S. Kim and I. Kim, Environ. Sci. Technol., 2011, 45, 7804–7811 CrossRef CAS PubMed.
- X. Liu, Y. Tang, P. Liu, L. Yang, L. Li, Q. Zhang, Y. Zhou and Z. H. Khan, Analyst, 2019, 144, 1671–1678 RSC.
- Z. He, J. Wei, C. Gan, W. Liu and Y. Liu, RSC Adv., 2017, 7, 39906–39913 RSC.
Footnote |
| † Electronic supplementary information (ESI) available. See DOI: 10.1039/c9ra02141h |
| This journal is © The Royal Society of Chemistry 2019 |

