 Open Access Article
The dependence of oxygen sensitivity on the molecular structures of Ir(III) complexes and their application for photostable and reversible luminescent oxygen sensing†
Yang Xing a,
Chengfang Qiaob,
Xinmin Lic,
Chun Lia,
Honghao Wanga,
Fayun Lia,
Ling Di
 *ad and
Zhanxu Yang*a
aCollege of Chemistry, Chemical Engineering, and Environmental Engineering, Liaoning Shihua University, Fushun 113001, China. E-mail: diling@lnpu.edu.cn; zxyanglnpu@163.com
bCollege of Chemical Engineering and Modern Materials, Shangluo University, Shangluo 726000, China
cSchool of Pharmacy, Zunyi Medical University, Zunyi, 563000, China
dState Key Laboratory of Fine Chemicals, Dalian University of Technology, Linggong Road 2, Dalian 116024, China
First published on 16th May 2019
Abstract
Three Ir(III) complexes IrC1, IrC2, and IrC3 substituted with 4-(diphenylamino)phenyl (TPA), 4-(9H-carbazol-9-yl)phenyl (Cz1), and 9-phenyl-9H-carbazol-3-yl (Cz2) moieties were prepared and fully characterized as phosphorescent emitters. In comparison with Ir(ppy)3, introduction of TPA, Cz1, and Cz2 moieties strongly improved the oxygen sensitivities of IrC1–IrC3. Short-decayed IrC1 with I0/I100 of 168.6 and KappSV of 202.2 bar−1 in THF exhibited the highest sensitivity for oxygen. TPA and Cz moieties caused remarkable collision radius variations of the Ir(III) complexes with 2.13 ± 0.08 for σIrC1/σIr(ppy)3, 1.24 ± 0.06 for σIrC2/σIr(ppy)3, and 1.54 ± 0.08 for σIrC3/σIr(ppy)3. For demonstrating the dependence of oxygen sensitivity on the molecular structure of the oxygen-sensitive probes (OSPs), the delocalization of spin populations (DSPs) has been applied for the first time to confirm the collision radius variations of Ir(III) complexes. Remarkable DSPs were found on the TPA, Cz1, and Cz2 moieties with the spin population (percentage of the spin population) of 0.23210 (11.61%), 0.08862 (4.43%), and 0.13201 (6.60%), respectively. And strong linear correlations (R2 = 0.997) between the collision radius variations and spin population on TPA and Cz moieties were apparent. The DSPs could be used to describe the dependence of oxygen sensitivity on the molecular structure of the OSPs. For achieving real-time oxygen sensing, the photostability, oxygen sensing performance, and operational stability of IrC1–IrC3 and Ir(ppy)3 immobilized in ethyl cellulose (EC) were investigated. The IrC1-EC film demonstrated outstanding photostability after 60 min of irradiation and excellent operational stability for continuous oxygen monitoring with no attenuation of the original emission intensity in 4000 s. This study quantified and analyzed the dependence of oxygen sensitivity on the molecular structure of Ir(III) complexes for the first time and illustrated a feasible approach to achieve high-efficiency sensors for real-time monitoring of oxygen.
1. Introduction
Oxygen plays an essential role in evolution and reproduction, and is indispensable for all forms of living organisms.1 The determination of oxygen has attracted special attention in biomedicine and environmental monitoring.2,3 When compared with traditional methods of oxygen determination (Winkler titration4 and electroanalytical5), luminescent sensing has become extremely significant in the last two decades due to the overwhelming advantages of its nondestructive characteristics, sensitive luminescence response, excellent reversibility, and versatility of formats (film, fiber, nanoparticle, etc.).6 Such type of flexible approach depends on the dynamic (diffusion-controlled) luminescence (phosphorescence or fluorescence) quenching of oxygen-sensitive probes (OSPs).7,8 The transition metal complexes are OSPs of choice, including Ir(III),9–12 Pt(II),13,14 Ru(II)15,16 complexes, and Pd(II) porphyrins.17,18In general, the oxygen sensitivities of luminescence sensors are roughly proportional to luminescent decay times (τ) of OSPs.19,20 And state of the art luminescent sensors consisted of OSPs possessing luminescent decay times in a wide range of milliseconds to microseconds.21 Efforts have been made to design OSPs with long decay times.8,22,23 Matrices have been widely used to provide microenvironment for OSPs as encapsulation and regulate the determination range of oxygen.24,25 High oxygen permeability of matrices commonly provided high sensitivity and low limit of detection (LOD).21,26–28 Luminescent decay times and oxygen sensitivities of OSPs are sometimes not in direct proportion (short-decayed OSPs with high oxygen sensitivities or vice versa) in the same matrix with the same approach of preparation. Astoundingly, the abnormal phenomena occurred frequently in the related researches.9,10,29–31 For instance, Ir(III) complexes Ir(III)-a and Ir(III)-b were immobilized in a nano aluminum based matrix (Scheme 1A). In comparison to short-decayed Ir(III)-a, lower oxygen sensitivity of Ir(III)-b with long decay time was showed.9 A t-butyl substituted Ir(III) complex Ir(III)-d was prepared based on Ir(III)-c (Scheme 1B). The oxygen sensitivity of short-decayed Ir(III)-c was 6-fold higher than that of long-decayed Ir(III)-d.10 Zhao et al. conducted a research on the two Pt(II) complexes Pt(II)-a and Pt(II)-b with phenylthiazo and thiazo-coumarin ligands, respectively (Scheme 1C). And there was a similar phenomenon that short-decayed Pt(II)-a showed considerably high oxygen sensitivity than that of Pt(II)-b.29 Coincidentally, parallel results were obtained in our previous reports.32,33 Therefore, the molecular structure of OSPs has potential influence which should not be ignored on the oxygen sensitivity.
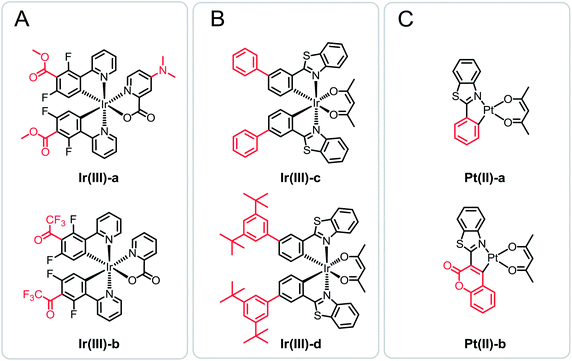 | ||
| Scheme 1 Chemical structures of referenced Ir(III) and Pt(II) OSPs. Structure variations is shown with red. | ||
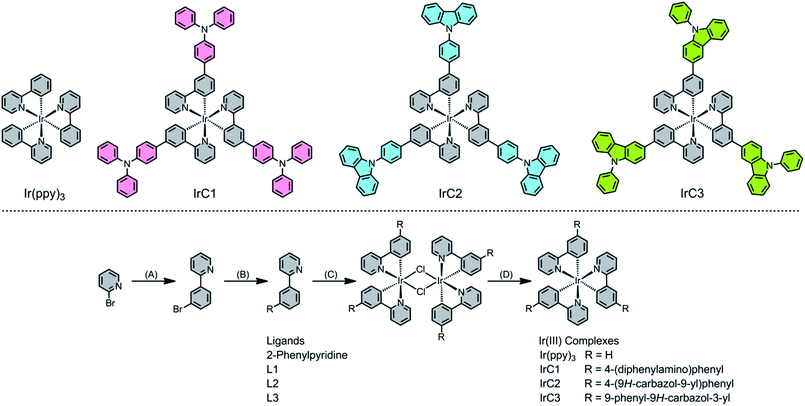
Carbazole and triphenylamine moieties have drawn a wide range of attention in organic light-emitting diodes (OLEDs)34–38 and dye-sensitized solar cells (DSSCs) due to intriguing properties of high light-to-electrical energy conversion efficiencies, strong electron-donating nature and good hole-transporting abilities.39–41 Herein, we report a systematic quantification and analysis of the dependence of oxygen sensitivity on the molecular structure of OSPs by the modification of traditional Ir(III) complex Ir(ppy)3 with 4-(diphenylamino)phenyl (TPA), 4-(9H-carbazol-9-yl)phenyl (Cz1), and 9-phenyl-9H-carbazol-3-yl (Cz2) moieties. Molecular structures and synthetic routes of IrC1, IrC2, IrC3 and Ir(ppy)3 were illustrated in Scheme 2.
2. Experimental
2.1. Materials and methods
The corresponding boronic acids, Pd(OAc)2, Pd(PPh3)4, and IrCl3·3H2O were purchased from Alfa Aesar. Other purified reagents were purchased from Greagent. 1H NMR and 13C NMR spectra were measured on a BRUKER AVANCE III HD spectrometer (400 MHz). High-resolution MS were measured with a 1290/6224 HPLC/MS spectrometer.20 The UV/Vis spectrometer (cary 5000) and fluorescence spectrophotometer (cary eclipse G9800A) of Agilent Technology were used to record absorption spectra and emission spectra. The excited-state lifetime curves were recorded on LP920 Laser Flash photolysis apparatus of Edinburgh Instruments Ltd (excitation wavelength: 355 nm, pulse width: 6.4 ns, frequency: 3 Hz, single pulse energy: 1 mJ). The 2273 electrochemical workstation of Princeton Applied Research was used for the cyclic voltammetry tests.2.2. Synthesis section
![[thin space (1/6-em)]](https://www.rsc.org/images/entities/char_2009.gif) :
:![[thin space (1/6-em)]](https://www.rsc.org/images/entities/char_2009.gif) 1 for L1, 20
1 for L1, 20![[thin space (1/6-em)]](https://www.rsc.org/images/entities/char_2009.gif) :
:![[thin space (1/6-em)]](https://www.rsc.org/images/entities/char_2009.gif) 1 for L2, and L3, v
1 for L2, and L3, v![[thin space (1/6-em)]](https://www.rsc.org/images/entities/char_2009.gif) :
:![[thin space (1/6-em)]](https://www.rsc.org/images/entities/char_2009.gif) v).
v).L1, N,N-Diphenyl-3′-(pyridin-2-yl)-[1,1′-biphenyl]-4-amine. Yield: 82.2%; white solid. 1H NMR (400 MHz, CDCl3) δ 8.72 (d, 1H), 8.22 (d, 1H), 7.93 (s, 1H), 7.79 (d, 2H), 7.63 (s, 1H), 7.60–7.50 (m, 3H), 7.27 (s, 5H), 7.17 (s, 3H), 7.15 (s, 3H), 7.05 (d, 2H).42
L2, 9-(3′-(Pyridin-2-yl)-[1,1′-biphenyl]-4-yl)-9H-carbazole. Yield: 79.1%; white solid. 1H NMR (400 MHz, CDCl3) δ 8.78 (d, 1H), 8.38 (s, 1H), 8.16 (d, 2H), 8.03 (d, 1H), 7.93 (d, 2H), 7.88 (s, 2H), 7.78 (d, 1H), 7.70–7.60 (m, 3H), 7.52–7.40 (m, 4H), 7.31 (t, 3H). 13C NMR (101 MHz, CDCl3) δ 157.1, 149.6, 140.9, 140.8, 140.1, 139.8, 137.1, 137.0, 129.4, 128.7, 127.8, 127.3, 126.2, 125.9, 123.4, 122.4, 120.8, 120.3, 119.9, 109.8. HRMS (ESI): calc. for C29H21N2: 397.1705 [M + H]+. Found: 397.1702 [M + H]+.
L3, 9-Phenyl-3-(3-(pyridin-2-yl)phenyl)-9H-carbazole. Yield: 77.2%; white solid. 1H NMR (400 MHz, CDCl3) δ 8.77 (d, 1H), 8.46 (s, 1H), 8.37 (s, 1H), 8.22 (d, 1H), 7.96 (d, 1H), 7.85 (t, 2H), 7.81–7.72 (m, 2H), 7.66–7.56 (m, 5H), 7.52–7.46 (m, 2H), 7.43 (d, 2H), 7.31 (dt, 2H). 13C NMR (101 MHz, CDCl3) δ 157.6, 149.6, 142.6, 141.3, 140.5, 139.8, 137.6, 136.9, 133.2, 129.9, 129.2, 128.0, 127.5, 127.1, 126.1, 126.0, 125.6, 125.2, 123.9, 123.5, 122.2, 120.9, 120.5, 120.1, 119.0, 110.0, 109.9. HRMS (ESI): calc. for C29H21N2: 397.1705 [M + H]+. Found: 397.1703 [M + H]+.
IrC1: yield: 77.4%; yellow powder. 1H NMR (400 MHz, CDCl3) δ 7.96 (s, 3H), 7.86 (s, 3H), 7.64–7.57 (m, 6H), 7.50 (s, 3H), 7.48 (d, 3H), 7.23 (s, 6H), 7.20 (s, 3H), 7.12 (s, 12H), 7.10–7.02 (m, 12H), 7.00 (s, 3H), 6.99–6.94 (m, 6H), 6.91–6.86 (m, 3H). 13C NMR (101 MHz, CDCl3) δ 169.7, 167.6, 146.9, 143.2, 142.9, 139.3, 136.8, 136.4, 136.1, 131.2, 130.1, 129.1, 128.4, 125.3, 123.9, 123.1, 121.2, 121.0, 118.5. HRMS (ESI) for C87H64IrN6, calc.: 1385.4822 [M + H]+. Found: 1385.4820 [M + H]+.42
IrC2: yield: 70.4%; yellow powder. 1H NMR (400 MHz, CDCl3) δ 8.14 (t, 9H), 8.05 (t, 6H), 7.88 (d, 6H), 7.68 (d, 6H), 7.63–7.57 (m, 6H), 7.49–7.39 (t, 18H), 7.30 (d, 6H). 13C NMR (101 MHz, CDCl3) δ 166.2, 150.2, 141.3, 141.1, 138.6, 137.8, 135.4, 135.0, 129.7, 129.2, 128.4, 127.9, 127.0, 125.3, 122.4, 121.3, 120.2, 119.6, 119.1, 108.4. HRMS (ESI) for C87H58IrN6, calc.: 1379.4352 [M + H]+. Found: 1379.4347 [M + H]+.
IrC3: yield: 75.2%; yellow powder. 1H NMR (400 MHz, CDCl3) δ 8.39 (s, 3H), 8.17 (d, 6H), 8.10 (d, 6H), 8.05 (s, 6H), 7.68 (d, 6H), 7.60 (d, 12H), 7.47–7.39 (m, 12H), 7.30 (d, 6H). 13C NMR (101 MHz, CDCl3) δ 167.5, 150.8, 143.3, 142.9, 140.1, 138.8, 136.7, 135.4, 134.4, 133.3, 130.0, 128.8, 127.7, 126.3, 125.9, 124.8, 124.2, 122.7, 122.5, 121.8, 121.3, 119.3, 118.8, 117.7, 117.1, 108.8, 108.7. HRMS (ESI) for C87H58IrN6, calc.: 1379.4352 [M + H]+. Found: 1379.4342 [M + H]+.
3. Result and discussion
3.1. Photophysical properties
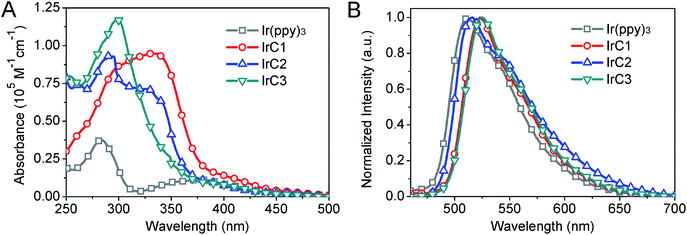
UV-visible absorption of IrC1–IrC3 and Ir(ppy)3 have been measured in THF at room temperature (Fig. 1A and Table 1). Strong bands up to 310 nm attributed to π–π* transitions of intraligands. Bands of lower-energy absorption at 350 nm were assigned to metal-to-ligand charge transfer transitions (MLCT). The spin-forbidden transitions of triplet states ascribed to weak bands at 400 nm with absorption coefficients of 2000 M−1 cm−1. The similar band positions and significant differences of absorption coefficients of IrC1–IrC3 and Ir(ppy)3 were observed. In comparison with Ir(ppy)3, intensity of the first band at 280 nm and the second band at 350 nm of IrC1–IrC3 were enhanced which was attributed to π–π* transition and MLCT of intraligands. It is probably due to the enhanced delocalization of the excited electron on TPA, Cz1, and Cz2 moieties which was confirmed by theoretical calculations (Fig. 2).43| Complexes | Absorption a | Emission b | ||||
|---|---|---|---|---|---|---|
| λabs (nm) (ε, 104 mol L−1 cm−1) | λem (nm) | τ (μs) c | Φp d | kr (105 s−1) e | knr (105 s−1) f | |
| a In THF at a concentration of 10−5 mol L−1.b In degassed THF.c λex = 355 nm.d Relative to Ir(ppy)2(acac) (Φp = 0.34).e kr = Φp/τ.f knr = (1/τ) − kr. | ||||||
| Ir(ppy)3 | 284 (3.75), 379 (1.12), 411 (0.71), 456 (0.27), 490 (0.12) | 511 | 2.38 | 0.40 | 1.68 | 2.52 |
| IrC1 | 332 (9.48), 404 (1.32), 472 (0.27) | 522 | 2.42 | 0.53 | 2.19 | 1.94 |
| IrC2 | 290 (9.31), 327 (7.15), 340 (6.34), 389 (0.95), 447 (0.25) | 516 | 2.76 | 0.50 | 1.81 | 1.81 |
| IrC3 | 299 (11.69), 349 (2.62), 397 (0.82), 421 (0.51) | 525 | 3.19 | 0.50 | 1.57 | 1.56 |
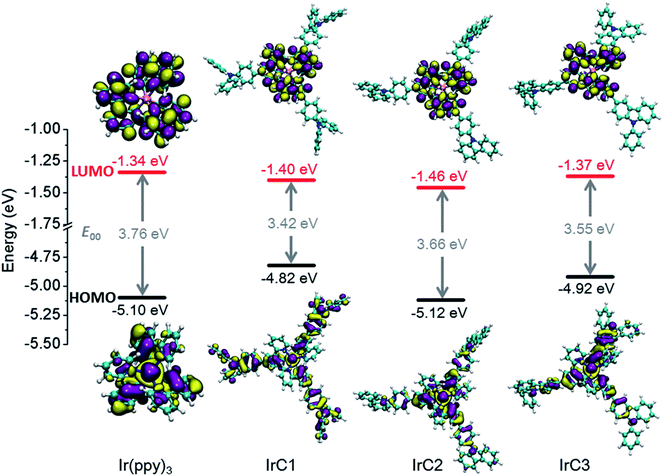 | ||
| Fig. 2 Electron density isosurfaces (0.02 a.u.) of frontier molecular orbitals of Ir(III) complexes. | ||
The emission maxima were in region from 511 to 525 nm which was excited in the MLCT bands (Fig. 1B and Table 1). In comparison to Ir(ppy)3 (511 nm), introduction of TPA and Cz moieties showed bathochromic shift of emission maxima of IrC1 (522 nm), IrC2 (516 nm), and IrC3 (525 nm). The emission maxima of IrC1 was shifted to a longer wavelength by TPA moieties. The phosphorescence quantum yields (Φp) of IrC1 (0.53), IrC2 (0.50), IrC3 (0.50) were enhanced compared to Ir(ppy)3 (0.40) (Table 1). The luminescent decay times (τ) were in the sequence of IrC3 (3.19 ± 0.02 μs) > IrC2 (2.76 ± 0.01 μs) > IrC1 (2.42 ± 0.03 μs) > Ir(ppy)3 (2.38 ± 0.02 μs). The τ in microseconds inferred that the emissions were phosphorescent (Table 1 and Fig. S1, see ESI†).44 Radiative (kr) and nonradiative (knr) decay rates were calculated by Φp and τ. And the radiative lifetimes τrad(1/kr) for IrC1–IrC3 and Ir(ppy)3 were 4.57 μs, 5.52 μs, 6.40 μs, and 5.95 μs, respectively (Table 1). Compared to IrC1, the extended τrad of IrC2 and IrC3 was possibly attributed to enhanced conjugation effects which was caused by Cz moieties.45 The changes in emission color were quantified with CIE coordinates of (0.2750, 0.6268) for Ir(ppy)3, (0.3164, 0.6341) for IrC1, (0.3286, 0.6090) for IrC2, and (0.3242, 0.6332) for IrC3 (Fig. S2, see ESI†).
3.2. Electrochemical properties
The electrochemical behaviors of IrC1–IrC3 and Ir(ppy)3 were studied by cyclic voltammetry (Table 2). The introduction of TPA moieties leaded to more negative oxidation potential (0.78 V) and higher HOMO energy level (−5.18 eV) of IrC1. And the introduction of Cz moieties showed more obvious cathodic shifts of oxidation potentials of IrC2 (0.72 V) and IrC3 (0.67 V) in comparison with Ir(ppy)3 (0.84 V). Ir(ppy)3 and IrC1 demonstrated quasi-reversible reduction waves, which exhibited electrochemical stability and relative difficulty of oxidation. While IrC2 and IrC3 showed irreversible reduction waves (Fig. S3, see ESI†). Therefore all the HOMO energy levels were calculated by the onset oxidation potentials (Eon setox) (Table 2). The data of zero–zero emission energy levels (E00) were calculated by the absorption edge data (λedge) of solid UV-vis spectra (Fig. S4, see ESI†). The data of E00 with order of Ir(ppy)3 (2.28 eV) > IrC2 (2.23 eV) > IrC1 (2.16 eV) > IrC3 (2.11 eV) were in accordance with the order of emission maxima in Fig. 1B.| Ir(III) complexes | Eon setoxa (V) | EHOMOb (eV) | ELUMOc (eV) | λedged (nm) | E00e (eV) | f |
|---|---|---|---|---|---|---|
a Onset oxidation potential. 0.1 mol L−1 [Bu4N]PF6 was dissolved in degassed THF. The standard electrode was SCE.b HOMO energy level, EHOMO (eV) = −e(4.4 + Eon setox).c LUMO energy level, ELUMO = EHOMO + E00.d Absorption edge data, which were measured from solid UV-vis spectra.e Zero–zero emission energy level. E00 = 1240/λedge.f Oxidation potential of excited state:  46 46 |
||||||
| Ir(ppy)3 | 0.84 | −5.24 | −2.96 | 544 | 2.28 | −1.44 |
| IrC1 | 0.78 | −5.18 | −3.02 | 574 | 2.16 | −1.38 |
| IrC2 | 0.72 | −5.12 | −2.89 | 556 | 2.23 | −1.51 |
| IrC3 | 0.67 | −5.07 | −2.96 | 587 | 2.11 | −1.44 |
3.3. Theoretical calculations
Density functional theory (DFT) calculations (B3LYP level, mixed basis sets of 6-31G* and LanL2DZ) based on the polarizable continuum model (PCM = THF) were applied to optimize the ground-state geometries of Ir(III) complexes20 (Fig. 2). TPA moieties of IrC1 take no-co-planar geometry. Contrastively, large π-conjugation were presented on Cz1 and Cz2 moieties of IrC2 and IrC3 just as expected. It was clear that 2-phenylpyridine moieties significantly contributed the LUMOs of IrC1–IrC3 and Ir(ppy)3. And none of electron population on Ir(III) atom, TPA, and Cz moieties of LUMOs. Ir(III) atoms and benzene rings of 2-phenylpyridines mainly contributed the HOMOs, while pyridine rings slightly contributed the HOMOs. The electron delocalization was increased on the propeller structures of IrC1. While the π-conjugation reduced the electron delocalization on Cz moieties of HOMOs of IrC2 and IrC3. These frontier molecular orbital energies in Fig. 2 and Table 2 were not over-interpreted because of acceptable differences between experimental and calculated data.473.4. Luminescence sensing of molecular oxygen
The Stern–Volmer relationship (eqn (1)) described the diffusion-controlled luminescent quenching process between OSPs and oxygen. I and τ are emission intensities and luminescent decay times of OSPs, respectively. I0 and τ0 are corresponding values in the absence of oxygen. kq means the bimolecular quenching constant and [O2] expresses the molar concentration of molecular oxygen. The Stern–Volmer plots (SVPs) are gotten with slopes of kqτ0 by linear fitting.
 | (1) |
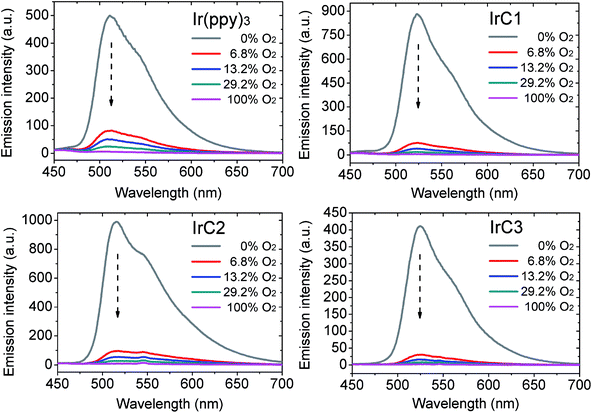
In order to drastically eliminate the influence of heterogeneity and accurately characterize original oxygen sensitivities, purified THF was used to disperse Ir(III) complexes. The emission intensities of IrC1–IrC3 and Ir(ppy)3 were obviously weaken with incremental concentration of O2 in the air volume of 0–100%. 6.8% of oxygen concentration could quench over 81% of original emission intensities. Noteworthily, above 90% of original emission intensity of IrC1 was quenched with 6.8% of oxygen which demonstrated high oxygen sensitivity (Fig. 3).
The two-site model48 was applied to fit the SVPs (eqn (2)). Where f1 and f2 are the quenchable and unquenchable fractions, respectively. And KSV1 and KSV2 are quenching rate constants for corresponding fractions. f1 + f2 = 1. pO2 means oxygen partial pressure. Oxygen sensitivities of OSPs are illustrated by the weighted constant KappSV (KappSV = f1KSV1 + f2KSV2).
 | (2) |
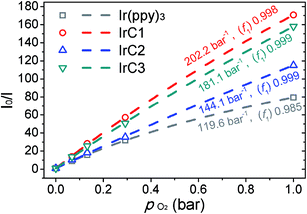
Decline ratios of emission intensity of IrC1–IrC3 and Ir(ppy)3 were fitted by the two-site model in Fig. 4 and Table S1 (see ESI†). The I0/I100 of IrC1–IrC3 and Ir(ppy)3 were 168.6, 115.1, 158.1, and 79.4, respectively. And KappSV of IrC1–IrC3 and Ir(ppy)3 were 202.2 bar−1, 144.1 bar−1, 181.1 bar−1, and 119.6 bar−1. IrC1 demonstrated the highest oxygen sensitivity than others. The oxygen sensitivities were in the order of IrC1 > IrC3 > IrC2 > Ir(ppy)3. Hence, introducing TPA and Cz moieties distinctly made Ir(III) complexes more sensitive to oxygen. Noticeably, large quenchable portions (f1) of IrC1 (0.998), IrC2 (0.999), and IrC3 (0.999) were improved compared with that of Ir(ppy)3 (0.985), which demonstrated considerable linearity of SVPs and more homogeneous microenvironment. The limit of detections (LODs) of IrC1–IrC3 and Ir(ppy)3 in THF were 0.27 mbar, 0.40 mbar, 0.28 mbar, and 0.43 mbar, respectively (see ESI†).
3.5. Variations of the collision radius
Winnik et al. reported the fundamental expression of luminescent oxygen sensing (eqn (3)).7 In eqn (3), PO2 means oxygen permeability of solvents or matrices. NA means the constant of Avogadro. α expresses the constant of luminescent quenching probability. σ represents the collision radii of OSPs to molecular oxygen. In eqn (3), PO2 describes the dependence of oxygen sensitivity on matrices. And high values of PO2 caused high oxygen sensitivities of OSPs.26 τ0 illustrates the dependence of oxygen sensitivity on the photophysical properties of OSPs. Long-lived τ0 leaded to high oxygen sensitivities of OSPs.19,21 The variations of collision radii (σ) describe the dependence of oxygen sensitivity on molecular structures of OSPs. OSPs with high values of σ should be more sensitive to oxygen.
 | (3) |
According to eqn (3), the ratio of collision radii (σ1/σ2) between two OSPs was obtained by the expression (eqn (4)), reads as
 | (4) |
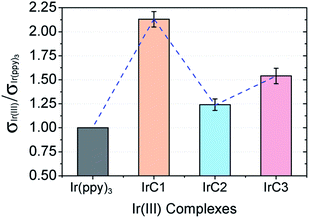
The ratios of collision radii between IrC1–IrC3 and Ir(ppy)3 (σIr(III)/σIr(ppy)3) represented the collision radius variations of OSPs. With luminescent decay times, the σIr(III)/σIr(ppy)3 have been calculated by measuring data of I0 and I100 five times in parallel (Table S2, see ESI†). The ratios of collision radii were 2.13 ± 0.08 for σIrC1/σIr(ppy)3, 1.24 ± 0.06 for σIrC2/σIr(ppy)3, and 1.54 ± 0.08 for σIrC3/σIr(ppy)3, respectively, with the sequence of IrC1 > IrC3 > IrC2 > Ir(ppy)3 (Fig. 5). In contrast to Ir(ppy)3, σ of IrC1 was obviously increased by TPA moieties. And in comparison with IrC1, the introduction of Cz1 and Cz2 moieties markedly decreased the collision radii of IrC2 and IrC3, respectively.
In this research, the delocalization of spin populations (DSPs) was for the first time applied to confirm the collision radius variations of Ir(III) complexes. The spin densities of T1-state IrC1–IrC3 and Ir(ppy)3 were calculated using unrestricted DFT calculations (B3LYP level, mixed basis sets of 6-31G* and LanL2DZ) (Fig. 6 and Table S3, see ESI†).49,50 The spin-density contours of IrC1–IrC3 and Ir(ppy)3 were dominated by p orbitals with spin population Pspin (percentages of spin population, Pspin%) of 1.66310 (83.15%), 1.59881 (79.94%), 1.62016 (81.00%) and 1.55760 (77.88%), respectively. One of intraligands of Ir(III) complexes significantly contributed the spin-orbital contours. Remarkable DSPs were found on the TPA, Cz1, and Cz2 moieties with Pspin (Pspin%) of 0.23210 (11.61%), 0.08862 (4.43%), and 0.13201 (6.60%), respectively (Table S3, see ESI†). TPA moieties caused more intense DSPs than Cz moieties. The DSPs could be visually observed on the spin-density contours of N atoms on TPA, Cz1, and Cz2 moieties with Pspin of 0.06098, 0.00542, and 0.02332, respectively (Fig. 6). The spin-density integral curves of IrC1–IrC3 and Ir(ppy)3 were plotted along Z axis (Fig. 7).49 Compared with Ir(ppy)3, spin population on Ir(III) atoms and 2-phenylpyridine moieties of IrC1–IrC3 declined in the range of 0 to 13 bohr, and then increased from 13 bohr to 27.5 bohr which exhibited intense DSPs on TPA, Cz1, and Cz2 moieties. Notably, considerable DSPs were demonstrated on TPA moieties than Cz1 and Cz2 moieties in the range of 17.5 to 27.5 bohr (Fig. 7). The integral curves confirmed the collision radius variations of Ir(III) complexes in Fig. 5.
 | ||
| Fig. 6 Spin-density contours (0.003 a.u.) of IrC1–IrC3 and Ir(ppy)3. Magenta and green contours mean positive and negative phase. Arrows exhibited the spin population variations of on N atoms. | ||
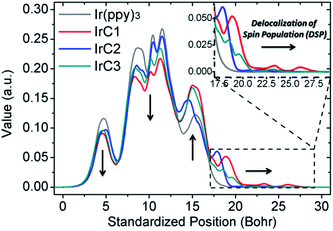 | ||
| Fig. 7 Spin-density integral curves of the optimized T1-state geometry of IrC1–IrC3 and Ir(ppy)3 along the Z axis. | ||
To demonstrate the relationship between the collision radius variations and the DSPs of Ir(III) complexes. The ratios of collision radii (σIr(III)/σIr(ppy)3) and the spin population (Pspin) on TPA, Cz1, and Cz2 moieties of IrC1–IrC3 were fitted with linearity (Fig. 8). Strong linear correlations between the ratios of collision radii and Pspin were apparent with R2 of 0.997. Hence, the DSPs could be the descriptor for the dependence of oxygen sensitivity on the molecular structure of Ir(III) complexes. In comparison with Ir(ppy)3, introduction of TPA and Cz moieties effectively improved the DSPs on intraligands resulting in increase of collision radii of Ir(III) complexes. Despite the upward tendency of luminescent decay times from IrC1 to IrC3, the increase of collision radius of IrC1 resulted in outstanding oxygen sensitivity.
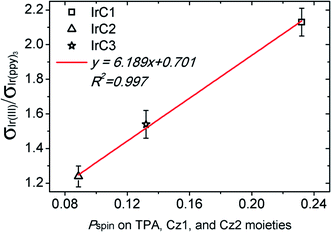 | ||
| Fig. 8 The linear fitting curve between the ratios of collision radii (σIr(III)/σIr(ppy)3) and the spin population (Pspin) of IrC1–IrC3. | ||
3.6. Photostability measurements
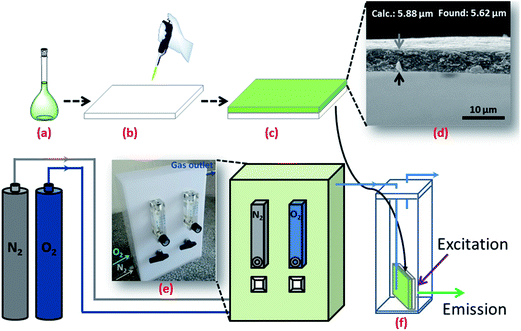
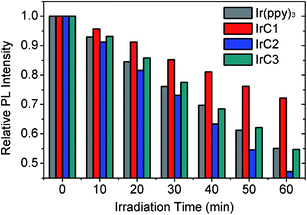
The photostability of OSPs is always of great concern for practical applications such as high-light densities determination or long-time continuous monitoring of oxygen. In this work, easily available supporting matrix ethyl cellulose (EC) was applied to immobilize Ir(III) complexes, respectively (Fig. 9a–c). The thickness of EC films is 5.62 μm (Fig. 9d). Ir(III) films were irradiated with Xe lamp under high power density of 27.3 W m−2 in air. And photostabilities of Ir(III) films were measured in N2 every 10 minutes.51 The data in Fig. 10 indicated that emission intensities of Ir(III) films were attenuated through continuous irradiation. IrC1 demonstrated higher photostability than that of Ir(ppy)3, IrC2 and IrC3. About 27.8% of IrC1, 52.8% of IrC2, 45.3% of IrC3, and 44.9% of Ir(ppy)3 were destroyed after 60 min of irradiation. The photostabilities were in the sequence of IrC1 > Ir(ppy)3 ≈ IrC3 > IrC2. And the sequence was correlated well with the order of excited-state oxidation potentials in Table 2, which determined the photo-oxidation reactivity of OSPs.46 Thus, the introduction of TPA moieties raises
  which makes IrC1 more stable to continuous irradiation.
3.7. Real-time monitoring of oxygen
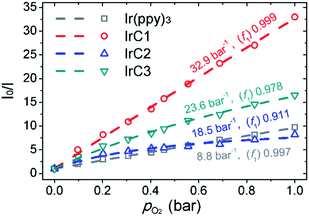
The luminescent responses of Ir(III) films were studied by gradually increasing concentration of O2. The Ir(III) films in 0% O2 (100% N2) exhibited intense room-temperature phosphorescence. And emission intensities of Ir(III) films were attenuated stepwise with incremental concentration of O2 (Fig. 11). KappSV and f1 values were summarized in Fig. 12 and Table S4 (see ESI†) which were fitted by eqn (2). The I0/I100 for Ir(III) films of IrC1, IrC2, IrC3, and Ir(ppy)3 were 33.0, 8.2, 16.5, and 9.7 with KappSV of 32.9 bar−1, 18.5 bar−1, 23.6 bar−1 and 8.8 bar−1. The IrC1-EC film exhibited outstanding oxygen sensitivity than that of other films. And the sequence of oxygen sensitivities was IrC1 > IrC3 > IrC2 > Ir(ppy)3, which was consistent with the sequence of oxygen sensitivities in THF (Fig. 4). The f1 values of IrC1 (0.999), IrC3 (0.978), and Ir(ppy)3 (0.997) films were higher than that of IrC2 (0.911) which showed considerable linearity and perfect microhomogeneity and resulted in increased oxygen sensitivities.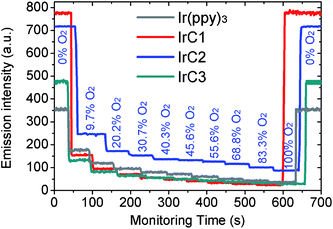 | ||
| Fig. 11 Time-dependent luminescent responses of Ir(III) films with incremental concentration of oxygen. | ||
3.8. Operational stability of oxygen sensing film
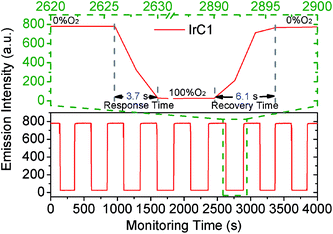
Because of the excellent oxygen sensing performance and high photostability, the operational stability of IrC1-EC film was measured by switching O2 and N2 atmospheres in 4000 s (Fig. 13). The values of I0 and I100 was constant and the cycles of quenching and recovery were perfectly reversible with no attenuation of original emission intensity which exhibited excellent operational stability. The response time of 3.7 s and recovery time of 6.1 s (96.6% recovery of original intensity) indicated quick responses of IrC1-EC film to molecular oxygen. Therefore, IrC1-EC film demonstrated outstanding photostability and operational stability which satisfied on-line continuous monitoring of molecular oxygen.4. Conclusions
In summary, new TPA and Cz moieties contained Ir(III) complexes IrC1, IrC2, and IrC3 were prepared and fully characterized as OSPs for luminescent sensing of oxygen. The ratios of collision radii (σIr(III)/σIr(ppy)3) of IrC1–IrC3 to Ir(ppy)3 were 2.13 ± 0.08, 1.24 ± 0.06, and 1.54 ± 0.08, respectively. Remarkable DSPs were found on the TPA, Cz1, and Cz2 moieties with the spin population (percentages of spin population) of 0.23210 (11.61%), 0.08862 (4.43%), and 0.13201 (6.60%), respectively. Strong linear correlations between the ratios of collision radii (σIr(III)/σIr(ppy)3) and the spin population on TPA and Cz moieties of IrC1–IrC3 were apparent with R2 of 0.997. The DSPs could be used to describe the dependence of oxygen sensitivity on the molecular structure of Ir(III) complexes. Introduction of TPA moieties could strongly improve photostability of Ir(III) complexes to reduce photo-oxidation. And fast response and recovery times of IrC1-EC film were obtained at 3.7 s and 6.1 s with no attenuation of original emission intensity in 4000 s which exhibited the excellent reversibility and operational stability. The results provide new concepts and technical supports for the design of high-performance luminescent sensors for monitoring of oxygen.Conflicts of interest
There are no conflicts to declare.Acknowledgements
The author thank the financial supports of Liaoning Shihua University (2017XJJ-001, 2016XJJ-099), the Education Department of Liaoning Province (L2017LQN007), the National Natural Science Foundation of China (21703135), and the Natural Science Foundation of the Department of Education of Shaanxi Province (17JS034).Notes and references
- P. Di Mascio, G. R. Martinez, S. Miyamoto, G. E. Ronsein, M. H. G. Medeiros and J. Cadet, Chem. Rev., 2019, 119, 2043 CrossRef CAS PubMed.
- M. Quaranta, S. M. Borisov and I. Klimant, Bioanal. Rev., 2012, 4, 115 CrossRef PubMed.
- D. B. Papkovsky and R. I. Dmitriev, Chem. Soc. Rev., 2013, 42, 8700 RSC.
- K. Iman and M. Shahid, New J. Chem., 2019, 43, 1094 RSC.
- X. Zhang, L. Huang, Q. Wang and S. Dong, J. Mater. Chem. A, 2017, 5, 18839 RSC.
- X. D. Wang and O. S. Wolfbeis, Chem. Soc. Rev., 2014, 43, 3666 RSC.
- X. Lu and M. A. Winnik, Chem. Mater., 2001, 13, 3449 CrossRef CAS.
- Y. Amao, Microchim. Acta, 2003, 143, 1 CrossRef CAS.
- M. Marín-Suárez, B. F. E. Curchod, I. Tavernelli, U. Rothlisberger, R. Scopelliti, I. Jung, D. Di Censo, M. Grätzel, J. F. Fernández-Sánchez, A. Fernández-Gutiérrez, M. K. Nazeeruddin and E. Baranoff, Chem. Mater., 2012, 24, 2330 CrossRef.
- M. Li, B. Zheng, D. Luo, H. Sun, N. Wang, Y. Huang, J. Dai, D. Xiao, S.-J. Su and Z. Lu, Chem. Commun., 2015, 51, 1926 RSC.
- V. Y. Vasilyev, N. B. Morozova, T. V. Basova, I. K. Igumenov and A. Hassan, RSC Adv., 2015, 5, 32034 RSC.
- P. Majumdar, X. Yuan, S. Li, B. Le Guennic, J. Ma, C. Zhang, D. Jacquemin and J. Zhao, J. Mater. Chem. B, 2014, 2, 2838 RSC.
- L. Liu, D. Huang, S. M. Draper, X. Yi, W. Wu and J. Zhao, Dalton Trans., 2013, 42, 10694 RSC.
- C. Arunkumar, F. R. Kooriyaden, X. Zhang, S. Sujatha and J. Zhao, New J. Chem., 2017, 41, 4908 RSC.
- H. Guo, L. Zhu, C. Dang, J. Zhao and B. Dick, Phys. Chem. Chem. Phys., 2018, 20, 17504 RSC.
- K. Xu, J. Zhao and E. G. Moore, Photochem. Photobiol. Sci., 2016, 15, 995 RSC.
- Y. Che, W. Yang, G. Tang, F. Dumoulin, J. Zhao, L. Liu and Ü. İşci, J. Mater. Chem. C, 2018, 6, 5785 RSC.
- S. M. Borisov, G. Nuss, W. Haas, R. Saf, M. Schmuck and I. Klimant, J. Photochem. Photobiol., A, 2009, 201, 128 CrossRef CAS.
- Y. Liu, H. Guo and J. Zhao, Chem. Commun., 2011, 47, 11471 RSC.
- Y. Xing, C. Liu, J.-H. Xiu and J.-Y. Li, Inorg. Chem., 2015, 54, 7783 CrossRef CAS PubMed.
- P. Lehner, C. Staudinger, S. M. Borisov and I. Klimant, Nat. Commun., 2014, 5, 4460 CrossRef CAS PubMed.
- O. S. Wolfbeis, J. Mater. Chem., 2005, 15, 2657 RSC.
- M. Quaranta, S. M. Borisov and I. Klimant, Bioanal. Rev., 2012, 4, 115 CrossRef.
- V. V. Vasil'ev and S. M. Borisov, Sens. Actuators, B, 2002, 82, 272 CrossRef.
- T. Ishiji, K. Kudo and M. Kaneko, Sens. Actuators, B, 1994, 22, 205 CrossRef CAS.
- Y. Amao, K. Asai, T. Miyashita and I. Okura, Polym. Adv. Technol., 2000, 11, 705 CrossRef CAS.
- Y. Amao, K. Asai, I. Okura, H. Shinohara and H. Nishide, Analyst, 2000, 125, 1911 RSC.
- Y. Amao, T. Miyashita and I. Okura, Anal. Chim. Acta, 2000, 421, 167 CrossRef CAS.
- W. Wu, W. Wu, S. Ji, H. Guo and J. Zhao, Dalton Trans., 2011, 40, 5953 RSC.
- W. Wu, J. Sun, S. Ji, W. Wu, J. Zhao and H. Guo, Dalton Trans., 2011, 40, 11550 RSC.
- C. Liu, X. Song, Z. Wang and J. Qiu, ChemPlusChem, 2014, 79, 1472 CrossRef CAS.
- C. Liu, X. Song, X. Rao, Y. Xing, Z. Wang, J. Zhao and J. Qiu, Dyes Pigm., 2014, 101, 85 CrossRef CAS.
- Y. Xing, C. Liu, X. Song and J. Li, J. Mater. Chem. C, 2015, 3, 2166 RSC.
- L. Deng, T. Zhang, R. Wang and J. Li, J. Mater. Chem., 2012, 22, 15910 RSC.
- J. Li, R. Wang, R. Yang, W. Zhou and X. Wang, J. Mater. Chem. C, 2013, 1, 4171 RSC.
- J. Li, T. Zhang, Y. Liang and R. Yang, Adv. Funct. Mater., 2013, 23, 619 CrossRef CAS.
- N. Li, Y. Fang, L. Li, H. Zhao, Y. Quan, S. Ye, Q. Fan and W. Huang, J. Lumin., 2018, 199, 465 CrossRef CAS.
- J. Hu, X. Zhang, D. Zhang, X. Cao, T. Jiang, X. Zhang and Y. Tao, Dyes Pigm., 2017, 137, 480 CrossRef CAS.
- P. Agarwala and D. Kabra, J. Mater. Chem. A, 2017, 5, 1348 RSC.
- R. Maragani, R. Misra, M. S. Roy, M. K. Singh and G. D. Sharma, Phys. Chem. Chem. Phys., 2017, 19, 8925 RSC.
- S. Soman, S. C. Pradhan, M. Yoosuf, M. V. Vinayak, S. Lingamoorthy and K. R. Gopidas, J. Phys. Chem. C, 2018, 122, 14113 CrossRef CAS.
- L. Di, Y. Xing, X. Wang, D. Zheng, Y. Yang and F. Li, RSC Adv., 2018, 8, 41040 RSC.
- J. Zhao, W. Wu, J. Sun and S. Guo, Chem. Soc. Rev., 2013, 42, 5323 RSC.
- Q. Li, C. Shi, M. Huang, X. Wei, H. Yan, C. Yang and A. Yuan, Chem. Sci., 2019, 10, 3257 RSC.
- W. Wu, H. Guo, W. Wu, S. Ji and J. Zhao, Inorg. Chem., 2011, 50, 11446 CrossRef CAS PubMed.
- W. Wai-SanáLee and K. ShingáChan, J. Mater. Chem., 1993, 3, 1031 RSC.
- W. Wu, J. Sun, X. Cui and J. Zhao, J. Mater. Chem. C, 2013, 1, 4577 RSC.
- E. Carraway, J. Demas and B. DeGraff, Langmuir, 1991, 7, 2991 CrossRef CAS.
- T. Lu and F. Chen, J. Comput. Chem., 2012, 33, 580 CrossRef CAS PubMed.
- W. Humphrey, A. Dalke and K. Schulten, J. Mol. Graphics, 1996, 14, 33 CrossRef CAS PubMed.
- S. M. Borisov, R. Pommer, J. Svec, S. Peters, V. Novakova and I. Klimant, J. Mater. Chem. C, 2018, 6, 8999 RSC.
Footnote |
| † Electronic supplementary information (ESI) available: Phosphorescent emission decay curves and cyclic voltammogram. See DOI: 10.1039/c9ra02277e |
| This journal is © The Royal Society of Chemistry 2019 |

