 Open Access Article
Characterization of glycan isomers using magnetic carbon nanoparticles as a MALDI co-matrix†
Alireza Banazadeha,
Reed Niemana,
Mona Golia,
Wenjing Penga,
Ahmed Husseinab,
Ercan Bursalc,
Hans Lischkaad and
Yehia Mechref *ae
*ae
aDepartment of Chemistry and Biochemistry, Texas Tech University, Lubbock, TX 79409-1061, USA. E-mail: yehia.mechref@ttu.edu; Fax: +1-806-742-1289; Tel: +1-806-742-3059
bDepartment of Biotechnology, Institute of Graduate Studies and Research, University of Alexandria, Alexandria, 21526, Egypt
cDepartment of Nursing, School of Health, Mus Alparslan University, Mus, Turkey
dSchool of Pharmaceutical Sciences and Technology, Tianjin University, Tianjin, 300072, P. R. China
eCenter for Biotechnology and Genomics, Texas Tech University, Lubbock, TX 79409, USA
First published on 27th June 2019
Abstract
Matrix-assisted laser desorption ionization-in source decay (MALDI-ISD) analysis is a useful technique in the structural analysis of glycans. Our recent publication demonstrated that magnetic carbon nanoparticles (MCNPs), used as a MALDI co-matrix, significantly enhanced ISD efficiency for glycomic analysis by MALDI-TOF. In this study, MCNPs were used for the structural study of isomeric glycans. Results from the standard glycans confirmed easy distinction of positional and linkage isomers without the need for further derivatization of glycan molecules. Extensive glycosidic and cross-ring fragmented ions provided different fragment patterns for various glycan isomers. Core- and branch-fucosylated isomers were distinguished by several unique ions, and pseudo-MS3 data were used to recognize the fucosylated branch. Although no diagnostic fragment ion was observed for 2,3- and 2,6-linked sialic acid isomers, their MALDI-ISD patterns were found to be significantly different (P < 0.05). Furthermore, the method introduced in this study could not only be used for the identification of glycan isomers but has also proved effective for the isomeric structural confirmation of gangliosides. GD1a and GD1b gangliosides were easily distinguished by the diagnostic ion originated from GD1a, produced by Z4αZ2β cleavages. Moreover, liquid chromatography coupled with MALDI-TOF was applied to analyze N-glycan isomers derived from a pooled human blood serum sample, providing an alternative method of isomeric glycomic analysis of biological specimens.
Introduction
Glycosylation is known to be critical in many biological processes, including intracellular interactions, cell signaling mechanisms, protein localization and protein folding.1,2 Aberrant glycosylation has been widely recognized as involved in the progression of certain diseases3–10 and various cancers,11–16 prompting quantitative studies of glycomics and glycoproteomics and necessitating reliable approaches for glycan/glycoprotein identification and quantitation. Glycomics and glycoproteomics analyses are very challenging due to the high complexity and microheterogeneity of protein glycosylation, which is mainly caused by the existence of multiple isomers. The structural study of oligosaccharides is, therefore, an essential part of efforts to gain more profound insights into glycosylation.17Among the variety of analytical methods that have been reported for glycan analysis, mass spectrometry (MS) is considered one of the most prominent methods for glycan profiling.18,19 When coupled with different separation techniques, including ion mobility mass spectrometry,20–23 capillary electrophoresis,24–26 porous graphitized carbon chromatography (PGC),17,27–32 hydrophilic liquid interaction chromatography (HILIC),33,34 and reverse phase chromatography,35 MS is a robust tool for the analysis of isomeric glycan. Considering all of these techniques, matrix-assisted laser desorption ionization (MALDI) offers several advantages, including rapid analysis time, ease of operation, small sample size requirements, and the relative simplicity of spectral interpretation.36–38 However, the relatively low ionization efficiency in both positive and negative ion modes and the instability of sialylated structures are the principal disadvantages of MALDI-MS analysis and must be addressed to achieve sensitive glycan analysis.
Derivatization of glycans before MS characterization offers advantages such as the stabilization of sialic acids and enhanced sensitivity and can be used to facilitate isomeric analysis of glycans.39–43 For instance, Alley and Novotny39 investigated sialic acid linkage isomers in breast cancer patients using amidation before permethylation, resulting in separation of the two isomers with 13 m/z unit per sialic acid residue. Later, Wuhrer et al.43 introduced a method for linkage-specific sialic acid derivatization, where the carboxylic group of α2,6-linked sialic acids experienced ethyl esterification while α2,3-linked sialic acids formed a lactone with the neighboring galactose. More than 100 N-glycans compositions with specific sialic acid linkages were detected using a MALDI-MS analysis of a human blood serum sample. However, derivatization introduced additional sample preparation steps, which may have increased deviation and sample loss.
Although MALDI is considered a soft-ionization technique, its ionization process could lead to the in-source decay (ISD) fragmentation of analytes, thus complicating the spectra. Although this phenomenon makes interpretation of spectra more difficult in some cases, it is nevertheless helpful for glycan profiling and structural identification.44–49 ISD fragmentation also has the potential to perform pseudo-MS3 experiments on MALDI. The amplitude of ISD fragmentation is dependent on matrix material and laser intensity. By controlling these parameters, ISD fragmentation in MALDI analysis can be used for the identification and relative quantification of glycan structures. Pauw et al.44 used 5-nitrosalicylic acid (5-NSA) as an oxidizing matrix to improve ISD of glycans via radical formation of precursors. Glycosidic and cross-ring cleavages were promoted by hydrogen abstraction from the hydroxyl group of glycans by 5-NSA molecules. As an example of the effect of laser intensity on the amplitude of ISD fragmentation, whereas the low abundance of ISD ions was observed in the mass spectrometer equipped with a conventional laser power (μJ levels), using a higher laser power (50 mJ per pulse) produced extensive glycosidic and cross-ring fragmentations.49
In recent years, the importance of nanomaterials as outstanding MALDI matrices has become increasingly evident due to their unique physicochemical characteristics, such as excellent optical absorption, exceptional electrical properties, and low background interference.50–57 Among these materials, carbon-based nanomaterials such as carbon nanotubes,58 carbon nanodots,59,60 carbon nanoparticles (CNPs),50,61 and graphene nanosheets (GNs)50,62,63 have attracted the most attention. Compared to traditional organic matrices, these nanomaterials facilitate the desorption process and enhance MS signal intensity due to their superior interaction with biomolecules and efficient energy absorption.
Recently, we investigated the performance of CNPs, GNs, and magnetic CNPs (MCNPs) as MALDI matrices or co-matrices for glycan profiling of different model glycoproteins and human blood serum samples.50,61 The material showed excellent absorption and transfer of laser energy to glycans, resulting in improved signal intensities by several orders of magnitude. Extensively-producing glycosidic and cross-ring cleavages, with the ability to easily control the extent of ISD fragmentation by changing the amount of nanomaterials in MALDI spot, confirmed the capability of these materials in the structural study of glycans.
In this study, MCNPs were used as a MALDI co-matrix for the isomeric study of glycans derived from a human blood serum sample. The use of MCNPs-MALDI-TOF for the identification of glycan isomers was initially demonstrated using both positional and linkage glycan isomer standards and then performed on human blood serum to measure its application on complex biological samples. Moreover, the capability of an MCNPs co-matrix for ganglioside isomer identification was also investigated. The glycan/glycolipid isomeric analysis enabled by the use of MCNPs as MALDI co-matrix facilitate rapid and straightforward analysis of glycans and glycolipids without the need for derivatization.
Experimental section
Materials
Standard N-glycans (N4H4F1, F1N4H4, N4H4F1S1, F1N4H4S1, N4H4F1S1(2,3), and N4H4F1S1(2,6); Table 1S†) were purchased from Chemily Glycoscience (Atlanta, GA). Standard gangliosides (GD1a-bovine brain and GD1b-human brain) were purchased from Merck (Germany). Carbon nanoparticles (CNPs) (particle size less than 100 nm and specific surface area higher than 100 m2 g−1), blood serum from human male AB plasma, 2,5-dihydroxybenzoic acid (DHB), and borane–ammonia complex were purchased from Sigma-Aldrich (St. Louis, MO). PNGase F was obtained from New England Biolabs (Ipswich, MA). HPLC grade ethanol, acetonitrile (ACN), and water were used for sample preparation and were purchased from Sigma-Aldrich (St. Louis, MO). MCNPs were readily synthesized by mixing CNPs, FeCl3·6H2O, and FeCl2·4H2O at 50 °C under N2 atmosphere, as per our recently published paper.61Sample preparation methods
Standard N-glycans and gangliosides were used directly without future purification. N-Glycans were released from human blood serum using PNGase F enzyme.31,32,64 Briefly, 40 μl of 10× diluted denaturation buffer was mixed with 10 μl aliquot of human blood serum (stock solution). After denaturation in a water bath at 80 °C for 30 minutes, 0.5 μl of PNGase F stock solution (500 units μl−1) was added, and the solution was incubated in a 37 °C water bath for 18 hours. Proteins were then precipitated by the addition of 90% ethanol, followed by incubation at −20 °C for 30 minutes. Purified glycans were reduced by adding a 10 μl aliquot of freshly prepared ammonia borane solution (10 μg μl−1) to the dry sample, followed by incubation in 60 °C water bath for one hour.Instrument methods
A MALDI TOF/TOF analyzer (AB SCIEX-4800), equipped with a pulsed Nd:YAG laser at an excitation wavelength of 355 nm, was used for MALDI-MS analyses. For matrix preparation, 1 μl of MCNPs suspension (0.2 μg μl−1, 50% ACN![[thin space (1/6-em)]](https://www.rsc.org/images/entities/char_2009.gif) :
:![[thin space (1/6-em)]](https://www.rsc.org/images/entities/char_2009.gif) H2O) was mixed with 1 μl of DHB (20 μg μl−1, 50% ACN
H2O) was mixed with 1 μl of DHB (20 μg μl−1, 50% ACN![[thin space (1/6-em)]](https://www.rsc.org/images/entities/char_2009.gif) :
:![[thin space (1/6-em)]](https://www.rsc.org/images/entities/char_2009.gif) H2O) to form a binary matrix. 1 μl of the resulting mixture was added to the MALDI plate, followed by the addition of 0.5 μl of the sample solution. The mass spectra were analyzed using Data Explorer 4.9 software (AB SCIEX). GlycoWorkbench software was applied for MS data interpretation and glycoform analysis.65 Domon and Costello nomenclature was employed to define the fragment ions from glycans.66
H2O) to form a binary matrix. 1 μl of the resulting mixture was added to the MALDI plate, followed by the addition of 0.5 μl of the sample solution. The mass spectra were analyzed using Data Explorer 4.9 software (AB SCIEX). GlycoWorkbench software was applied for MS data interpretation and glycoform analysis.65 Domon and Costello nomenclature was employed to define the fragment ions from glycans.66
To study isomeric glycans derived from a human blood serum sample, an UltiMate 3000 nanoLC system (Thermo Scientific, Sunnyvale, CA) was used for LC separation, prior to the MALDI analyses. Porous graphitized carbon column (PGC, HyperCarb, 75 μm × 100 mm, 5 μm particle size, Thermo Scientific, Pittsburgh, PA) was used for separation.17,67–69 Mobile phase A consisted of 50 mM formic acid buffered to pH 3.0 with ammonia, and mobile phase B used acetonitrile. Reduced glycans were injected directly into the PGC column, with a flow rate of 0.5 μl min−1, and the gradient was as follows. In the first 15 minutes, mobile phase B was kept at 2%; from 15 to 100 minutes, the percentage of B was increased to 30%. Solvent B was further elevated from 30% to 45% in the following 20 minutes and finally increased to 80% for 5 minutes. It was maintained at 80% B for 15 minutes to elute highly sialylated glycans and finally quickly back to 2% B. The outlet of the LC column was coupled to an LTQ Orbitrap Velos mass spectrometer (Thermo Scientific, San Jose, CA) through a nanoESI source with a 1.6 kV ESI voltage. For off-line MALDI analyses, the liquid was collected every 30 seconds from the outlet of the column on the MALDI plate, which was already spotted by matrix materials.
Molecular modeling
Quantum chemistry calculations were performed to optimize the 3D structures of the core- and branch-fucosylated N-glycan isomers, F1N4H4 and N4H4F1, and the α2,3- and α2,6-linked sialic acid isomers in order to better understand the mass spectra of such isomers. The 3D starting structures were generated using the GLYCAM-Web Carbohydrate Builder tool (http://www.glycam.org).70 Density functional theory (DFT) was then used to optimize the structures without inclusion of environmental effects by way of the Becke, 3-Parameter, Lee–Yang–Parr (B3LYP) hybrid functional71 with the split valence polarization (SVP) basis set,72 and the multipole-accelerated resolution of the identity for the Coulomb energy (MARI-J) approach.73 Empirical dispersion corrections were added by means of the D3 method.74 All calculations were carried out for the isolated molecules utilizing the Turbomole program suite.75Results and discussion
MALDI-TOF-MS spectra of standard N-glycans using MCNPs as a co-matrix
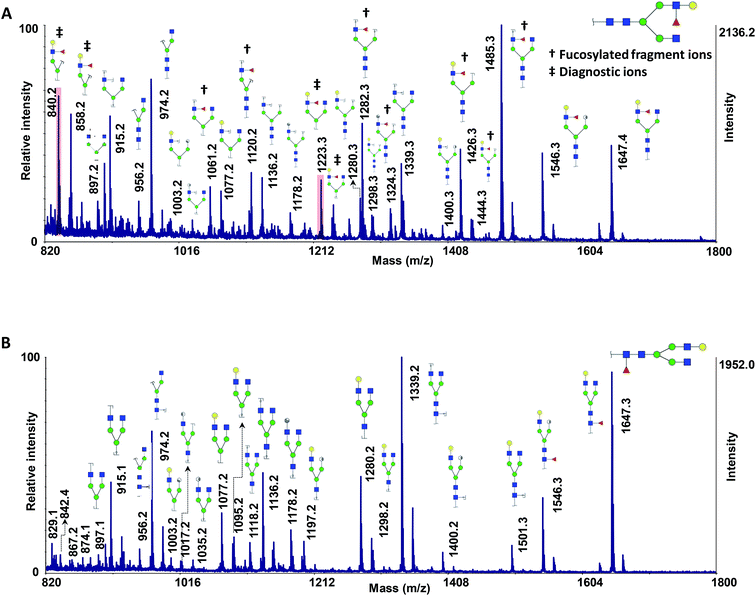
We recently investigated the performance of using MCNPs as a MALDI matrix and co-matrix in glycan profiling.61 MCNPs not only enhanced the signal intensities by several orders of magnitude but also prompted ISD fragmentations, which produced extensive glycosidic and cross-ring cleavages. Interestingly, the extent of ISD fragmentation can be modulated by MCNPs concentrations to easily obtain MS2 and pseudo-MS3 spectra, which are beneficial in glycan profiling and structural identification.To test the applicability of the MCNPs in the structural analysis of glycans, they were used as a co-matrix for analysis of core- and branch-fucosylated N-glycan isomers. Fig. 1 shows the MALDI-TOF-MS spectra of N4H4F1 (Fig. 1A) and F1N4H4 (Fig. 1B) with all corresponding structures represented as illustrations. In comparison with DHB as a matrix (Fig. 1S†), extensive glycosidic and cross-ring cleavages were produced by ISD fragmentations when MCNPs were utilized as a co-matrix. Significant differences between the spectra of the two isomers can be observed. Four fragment ions, indicated by a double dagger in Fig. 1A, at m/z 840.2, 858.2, 1223.3, and 1239.3 are the diagnostic ions of N4H4F1. The ions at m/z 1223.3 (C4α) and 1239.3 (B4α) were generated by cleaving two GlcNAc, and the ions at m/z 840.2 (C4αC1β) and 858.2 (C4αB1β) originated by losing three GlcNAc. In addition to these diagnostic ions, there are seven fragment ions found only in the spectrum of N4H4F1 (indicated by a dagger in Fig. 1A). These ions were observed at m/z 1061.2, 1120.2, 1282.3, 1324.3, 1426.3, 1444.3, and 1485.3 and are fucosylated fragment ions. In contrast, the fragment ion produced by fucose cleavage, at m/z 1501.3, appeared only in MALDI-ISD of F1N4H4 (Fig. 1B). The results illustrate that the loss of fucose was suppressed when the fucose was located on the branch.
To confirm these data, the structures of both isomers were optimized by computer modeling, performed as described above. As can be seen in Fig. 2, when the fucose is located on the branch, the molecule is more compact, and the fucose is closer to the surrounding monosaccharides, thus possibly increasing bond energy. The bond dissociation energies (ΔE, kcal mol−1) for the fucose loss were calculated as 120.3 and 110.2 for the N4H4F1 and F1N4H4 respectively, illustrating that higher energy is needed for the fragmentation of fucose when it is located on the branch.
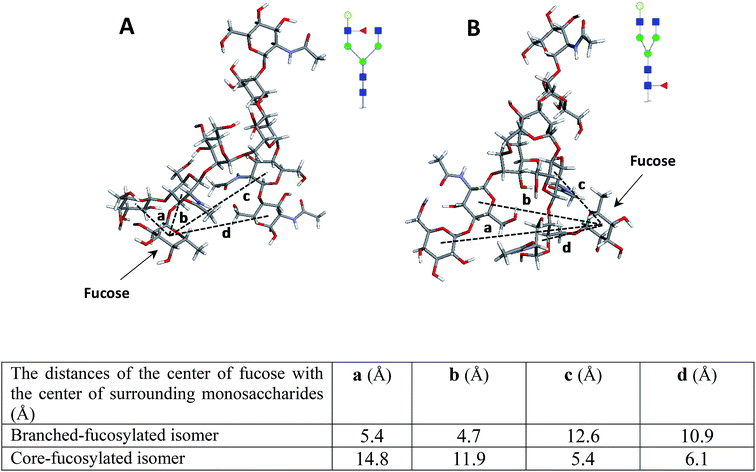 | ||
| Fig. 2 The molecular modeling of (A) N4H4F1 and (B) F1N4H4 while the table summarizes the distance of the center of fucose with the center of surrounding monosaccharides. Symbols as in Fig. 1. | ||
The relative intensities of the fragment ions derived from the two isomers are compared in Fig. 3A, which illustrates significant differences (P < 0.05) between most of them. The relative intensity stability was tested using five selected peaks and the results are shown in Table 2S.† Moreover, five samples with different molar ratios of the two isomers were prepared, and the intensities of the fragment ions were compared. As an example, the intensities of the four peaks at m/z 840.2, 1223.3, 1426.3 and 1485.3 are shown in Fig. 3B. Increasing their intensities by increasing the molar ratio of N4H4F1 in the mixture confirmed that these ions originated from N4H4F1.
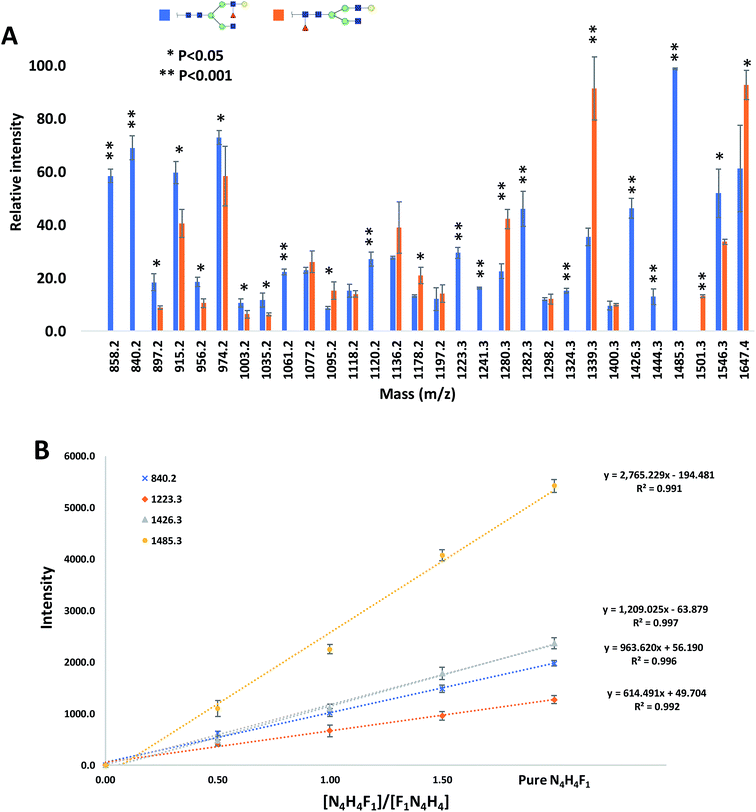 | ||
Fig. 3 (A) Comparison of the relative intensities of the fragment ions derived from N4H4F1 and F1N4H4. (B) The intensities of the four fragment ions derived from N4H4F1 at different ratios of N4H4F1![[thin space (1/6-em)]](https://www.rsc.org/images/entities/char_2009.gif) : :![[thin space (1/6-em)]](https://www.rsc.org/images/entities/char_2009.gif) F1N4H4. Symbols as in Fig. 1. F1N4H4. Symbols as in Fig. 1. | ||
As discussed above, ISD fragmented ions can be employed to produce pseudo-MS3 spectra that can provide valuable data for structural identification. The applicability of the proposed matrix for pseudo-MS3 analysis was investigated on the peaks at m/z 840.2 (Fig. 4A) and 1223.3 (Fig. 4B), which are diagnostic ions of N4H4F1. Several ions corresponding to the fragmentation of the ions of interest were observed, with relatively high signal-to-noise ratios, an aspect beneficial for structural analysis. As an example, the fragments at m/z 190.1 (Fig. 4A) and 1020.1 (Fig. 4B) confirmed the linkage of the fucose to the GlcNAc on the α1,3-antennae of the N4H4F1, which is a galactose-containing branch. The ion at m/z 190.1 is a fragment that contains one GlcNAc with three cleavage sites; the fragment ion at m/z 1020.1 contains four hexoses, one GlcNAc, and one fucose with two cleavage sites.
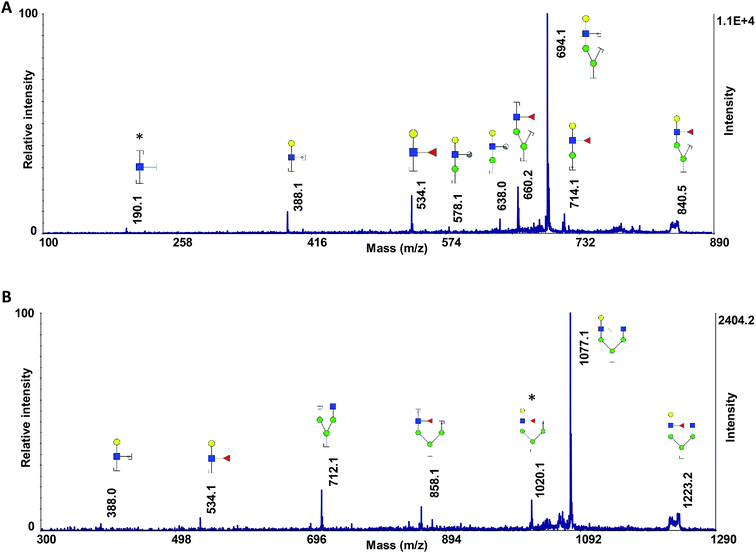 | ||
| Fig. 4 Pseudo-MS3 spectra of the ISD fragment ions at m/z (A) 840.2 and (B) 1223.2, as highlighted in Fig. 1. Symbols as in Fig. 1. | ||
To further investigate the effect of fucose linkage in the ISD pattern, N4H4F1S1 (Fig. 2Sa†) and F1N4H4S1 (Fig. 2Sb†) were also analyzed. The results were comparable with the results obtained for N4H4F1 and F1N4H4 (Fig. 1); however, due to the labile sialyl linkage, weak signals were observed for the intact molecules. In addition to the peak at m/z 1223.3, a diagnostic ion for N4H4F1S1, again there are seven fucosylated fragment ions that appeared only in the spectrum of N4H4F1S1 (Fig. 2Sa†), confirming that the loss of the fucose was suppressed when the fucose is located at the antenna. Significant differences (P < 0.05) were also observed between the relative intensities of most fragment ions originated by the two isomers (Fig. 2Sc†). The data in Table 2S† illustrates the relative intensity stability of the fragment ions originated by these two isomers. Further MCNPs was performed to distinguish sialylated linkage isomers. Glycan standard N4H5S1(2,3) and N4H5S1(2,6) were used for illustration, and the results are shown in Fig. 5A and B. Although no diagnostic ion was observed for these isomers, the distribution of their fragment ions was significantly different (P < 0.05), as shown in Fig. 5C. Moreover, a fragment ion at m/z 1853.1 appeared only in the spectrum of N4H5S1(2,6), which was originated by the cross-ring fragmentation of sialic acid (2,4X). In comparison with the α2,3 isomer, the α2,6-linked sialic acid isomer shows significantly higher relative intensity for intact glycan (m/z 1976.3), indicating higher stability of the glycosylic bond between the sialic acid and galactose. Moreover, comparing the relative intensities of the Y6α fragment ions (m/z 1663.3) derived from two isomers shows more energy is needed to lose galactose in an α2,6 isomer. This result was further supported by computer modeling data. The optimized geometries for the two isomers (Fig. 6) indicate that the α2,6-linked sialic acid isomer is more compact and the sialic acid residue is closer to the GlcNAc. The bond dissociation energies (Table 3S†) illustrate that higher energy is needed for sialic acid and galactose loss in the α2,6-linked sialic acid isomer. The relative intensity stability of the fragment ions derived from these two isomers confirmed by the data in Table 2S.†
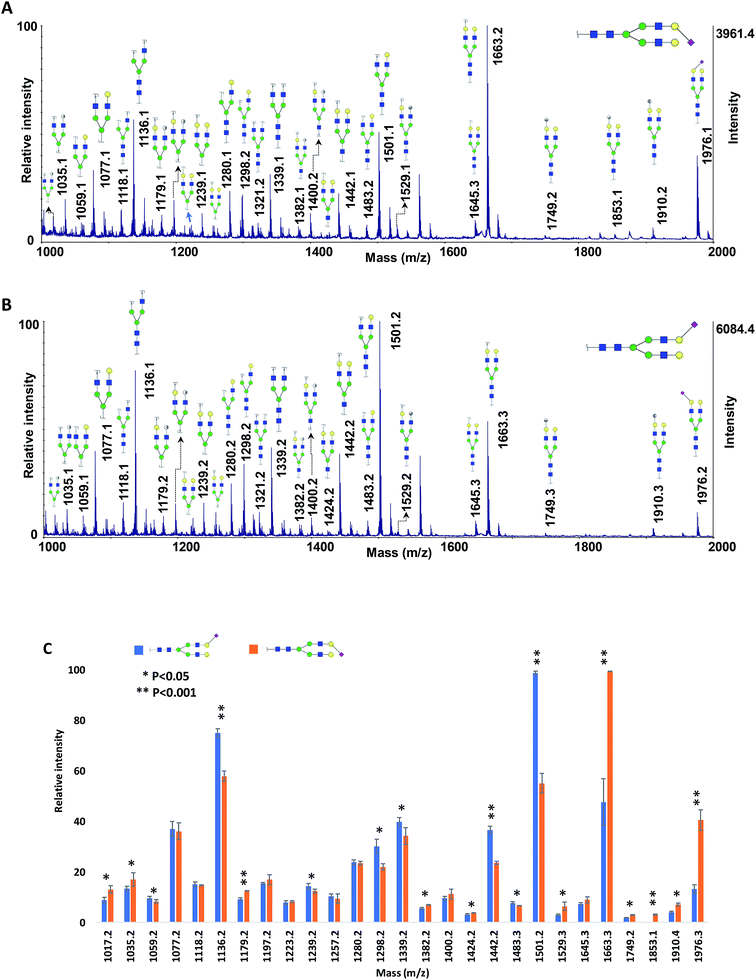 | ||
| Fig. 5 MALDI-TOF-MS spectra of 50 ng of (A) N4H5S1(2,6) and (B) N4H5S1(2,3), using 10 μg DHB + 0.1 μg MCNPs. (C) Comparison of the relative intensities of the fragment ions derived from N4H5S1(2,6) and N4H5S1(2,3). Symbols as in Fig. 1. | ||
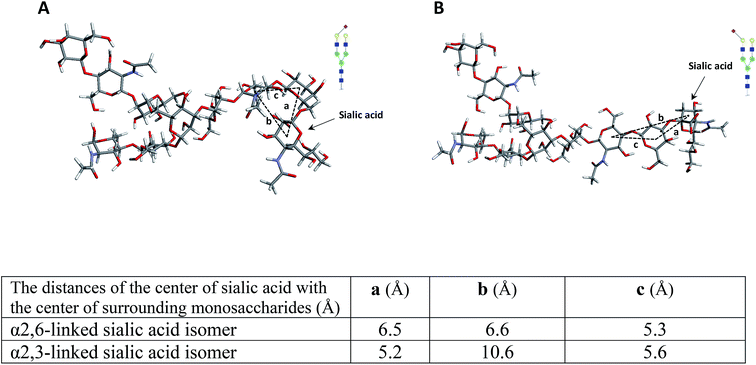 | ||
| Fig. 6 The molecular modeling of (A) N4H5S1(2,6) and (B) N4H5S1(2,3) while the table summarizes the distance of the center of sialic acid with the center of surrounding monosaccharides. Symbols as in Fig. 1. | ||
MALDI-TOF-MS spectra of standard gangliosides using MCNPs as a co-matrix
Gangliosides are sialic acid-containing glycosphingolipids which are found in tissues and body fluids, with more abundance in the nervous system. They are associated with different mammalian diseases including lung, breast, prostate, and ovarian cancer as well as brain tumors, and therefore the reliable identification of ganglioside isomers is important for biomarker discovery studies.76–79 To date, more than 180 ganglioside species with different glycan headgroups have been identified in vertebrate tissues.The performance of the MCNPs as a MALDI co-matrix in the structural analysis of isomeric gangliosides was also investigated, using ganglioside isomers GD1a and GD1b. These two isomers differ in the linkage of sialic acid.76,77 The MALDI-ISD spectra of the two isomers are shown in Fig. 7A and B. The peaks at m/z 1931.5 indicate the intact gangliosides, which were detected as [M + 3Na–2H]+. For both isomers, another peak can be seen with 28 Da mass difference (m/z 1903.5), which was originated by the difference in the lengths of the lipid moieties. The same peaks with 28 Da mass difference can also be observed for all of the fermented ions.
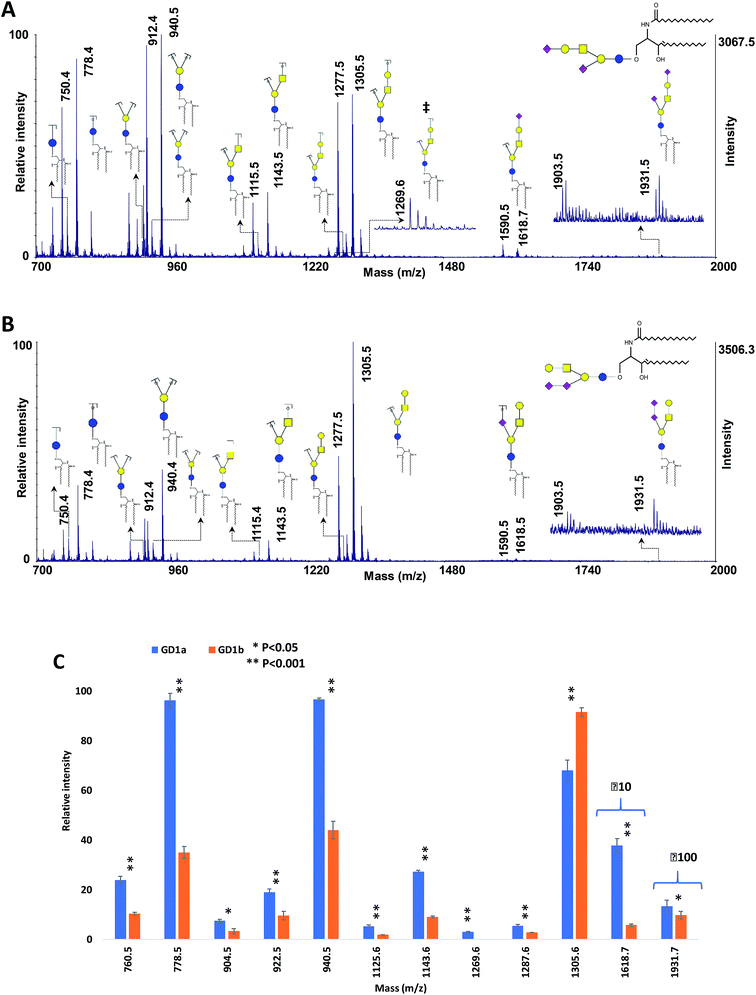 | ||
| Fig. 7 MALDI-TOF-MS spectra of 100 ng of ganglioside isomers (A) GD1a and (B) GD1b, using 10 μg DHB + 0.1 μg MCNPs. (C) Comparison of the relative intensities of the fragment ions derived from GD1a and GD1b. ‡ shows diagnostic ions. Symbols as in Fig. 1. | ||
The spectra show dominant glycosidic cleavages leading to Y ions and a few low abundant Z ions. No cleavage was observed on the lipid moieties. Although most of the fragment ions are common between the two isomers, the ion at m/z 1269.6 (Fig. 7A) is the diagnostic ion of GD1a, which was produced by Z4αZ2β cleavages. Moreover, Fig. 7C exhibited significant alterations of fragment distributions between the two isomers, suggesting the proposed matrix can be utilized in the structural analysis of ganglioside isomers.
Use of MCNPs as a MALDI co-matrix in the isomeric study of glycans derived from human blood serum
The utility of MCNPs was then investigated in the glycomic study of N-glycans derived from human blood serum. Human blood serum contains proteins with sophisticated glycosylation, and its profiling plays an essential role in biomarker discovery, and disease diagnosis and prognosis.7,16,18,80,81 Isomers of reduced glycans were first separated by a PGC-nanoLC system and then analyzed with MALDI using MCNPs as a co-matrix. Reduced glycans were used to prevent anomeric separation on the PGC column. Fig. 8A shows the extracted ion chromatogram (EIC) of (F*: denotes to both core- and branch-fucosylated isomers), and the corresponding MALDI spectra. As it can be observed, the patterns of the peaks in the MALDI spectra in Fig. 8B and C are identical to the results that were obtained for the branch- and core-fucosylated standard isomer, respectively. In addition to the peak at m/z 1223.3 (the diagnostic ion of N4H4F1), fucosylated fragment ions can only be observed for this isomer. These results confirmed that the peaks at 43.6 min and 44.7 min represent N4H4F1 and F1N4H4, respectively.
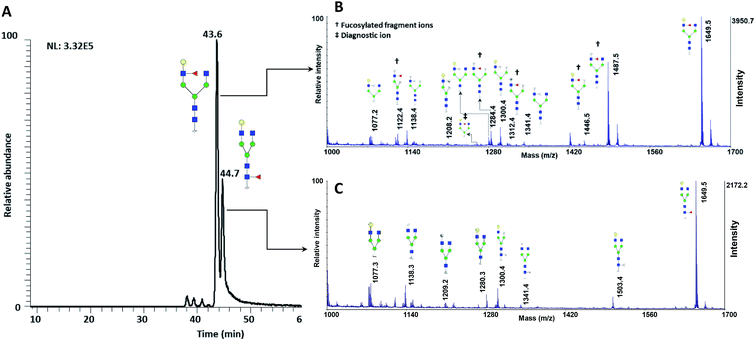 | ||
| Fig. 8 (A) Extracted ion chromatogram of the glycan N4H4F1, released from human blood serum. MALDI-TOF-MS spectra of the peak at (B) 43.2 min and (C) 44.7 min. † shows the fucosylated fragment ions, ‡ shows the diagnostic ions. Symbols as in Fig. 1. | ||
Fig. 3S† shows the EIC and the corresponding MALDI spectra of the sialic acid-linked isomers of N4H4FS1. Two peaks were observed at retention times 46.3 and 51.8 min (Fig. 3Sa†). Fig. 3Sb† depicts the MALDI spectrum of the peak eluting at 46.3 min, while Fig. 3Sc† represents the MALDI spectrum of the second peak eluting at 51.8 min. The pattern of the peaks in Fig. 3Sb† is coincident with the results that were obtained for the α2,6-linked sialic acid structure, with higher relative intensities for the intact structure (m/z 1978.4) and the Y6α fragment ion (m/z 1665.4). A similar pattern to that of the α2,3-linked sialic acid structure can be seen in Fig. 3Sc,† with a higher relative intensity for the Y5α fragment ion (m/z 1503.2). The results confirmed that the peaks at 46.3 and 51.8 represent N4H5S1(2,6) and N4H5S1(2,3) structures, respectively. These results are compatible with the previously reported data for N-glycans derived from human blood serum samples, where the significantly higher relative intensity of the α2,6 isomer was shown.82,83
The EIC of the four isomers of N4H5S2 and their corresponding MALDI spectra are shown in Fig. 9. Similar to the results that were obtained for monosialylated glycans, the relative intensities of the Y6αY6β and Y5αY6β fragment ions are dependent upon the sialic acid linkage. The peaks in the EIC were assigned by comparison with the relative intensities of the Y6αY6β and Y5αY6β fragment ions in the MALDI-ISD spectra. As can be seen in Fig. 9B and C, for the structures with two α2,6- and α2,3-linked sialic acids, Y6αY6β, and Y5αY6β fragment ions show higher relative intensities, respectively. For the other two isomers at 49.6 and 54.8 min, with one α2,6- and α2,3-linkage in their structures, similar relative intensities were obtained for Y6αY6β and Y5αY6β fragment ions (Fig. 9C and D). Although more work needs to be done to improve separation efficiency prior to MALDI measurements and therefore the assignment of more structures, these data illustrate the applicability of our proposed matrix to easily distinguish both positional and linkage isomers derived from a complex biological sample. The effectiveness of the MCNPs as a co-matrix will be investigated in the future work by the analysis of N- and O-glycans derived from different biological samples such as mice and porcine tissues, Medicago leaf, human urine, breast and brain cancer cell lines, and human salivary mucins.16,30,84–92
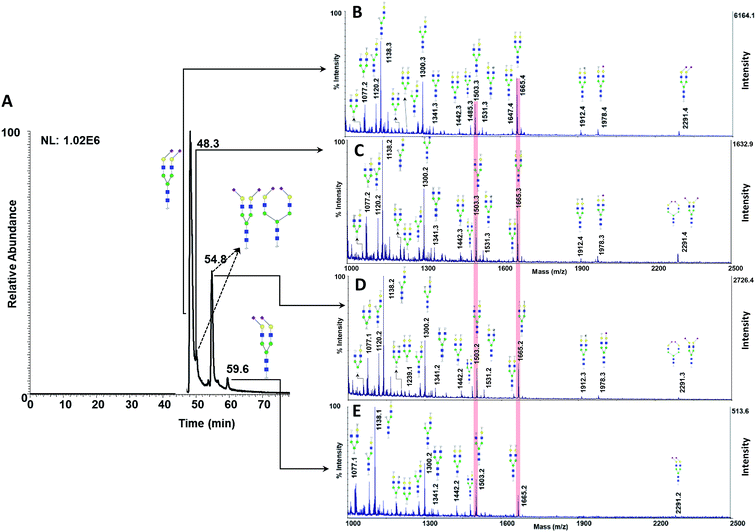 | ||
| Fig. 9 (A) Extracted ion chromatogram of glycan N4H5S2, derived from 0.5 μl of human blood serum. MALDI-TOF-MS spectra of the peak at (B) 48.3 min, (C) 49.6 min, (D) 54.8 min, and (E) 59.6 min. Highlights show the relative intensities of the Y6αY6β and Y5αY6β fragment ions, derived from the four isomers. Symbols as in Fig. 1. | ||
Conclusion
In this work, MCNPs were used as a MALDI co-matrix for the structural study of isomeric glycans. The MALDI-ISD results demonstrated the ability of MCNPs to generate desired structural information. Extensive glycosidic and cross-ring bond fragmentations provided valuable data to distinguish both positional and linkage isomers. Data for standard glycans showed that, while core- and branch-fucosylated glycans were discriminated by their several unique ions, a significant difference between the relative intensities of the ISD fragmented ions helped to differentiate sialic acid linkage isomers. The applicability of MCNPs in the structural analysis of glycans was also confirmed by the analysis of ganglioside isomers. Although no cleavages occurred at the lipid moieties, the ISD of their headgroup glycans produced unique ions to distinguish these isomers. Finally, the use of PGC-LC to separate glycan isomers, prior to MALDI analyses, provided the facility for structural analysis of glycans derived from a human blood serum sample.Conflicts of interest
The authors declare that they have no conflict of interest.Acknowledgements
This work was supported by grants from National Institutes of Health, NIH (1R01GM112490-04, 1R01GM130091-01, and 1U01CA225753-01).References
- A. Helenius and M. Aebi, Science, 2001, 291, 2364–2369 CrossRef CAS PubMed.
- K. W. Moremen, M. Tiemeyer and A. V. Nairn, Nat. Rev. Mol. Cell Biol., 2012, 13, 448–462 CrossRef CAS PubMed.
- M. L. Bermingham, M. Colombo, S. J. McGurnaghan, L. A. Blackbourn, F. Vučković, M. P. Baković, I. Trbojević-Akmačić, G. Lauc, F. Agakov and A. S. Agakova, Diabetes Care, 2018, 41, 79–87 CrossRef CAS PubMed.
- A. V. Everest-Dass, E. S. Moh, C. Ashwood, A. M. Shathili and N. H. Packer, Expert Rev. Proteomics, 2018, 15, 165–182 CrossRef CAS PubMed.
- A. V. Everest-Dass, E. S. Moh, C. Ashwood, A. M. Shathili and N. H. Packer, Expert Rev. Proteomics, 2018, 15, 341–352 CrossRef CAS PubMed.
- Y. Kizuka, S. Kitazume and N. Taniguchi, Biochim. Biophys. Acta, Gen. Subj., 2017, 1861, 2447–2454 CrossRef CAS PubMed.
- W. Peng, J. Zhao, X. Dong, A. Banazadeh, Y. Huang, A. Hussien and Y. Mechref, Expert Rev. Proteomics, 2018, 15, 1007–1031 CrossRef CAS PubMed.
- A. C. Russell, M. Šimurina, M. T. Garcia, M. Novokmet, Y. Wang, I. Rudan, H. Campbell, G. Lauc, M. G. Thomas and W. Wang, Glycobiology, 2017, 27, 501–510 CrossRef CAS PubMed.
- S. Schedin-Weiss, B. Winblad and L. O. Tjernberg, FEBS J., 2014, 281, 46–62 CrossRef CAS PubMed.
- M. Van Scherpenzeel, E. Willems and D. J. Lefeber, Glycoconjugate J., 2016, 33, 345–358 CrossRef CAS PubMed.
- H. Guo and K. L. Abbott, in Advances in cancer research, Elsevier, 2015, vol. 126, pp. 281–303 Search PubMed.
- M. J. Kailemia, D. Park and C. B. Lebrilla, Anal. Bioanal. Chem., 2017, 409, 395–410 CrossRef CAS PubMed.
- Y. Mechref, Y. Hu, A. Garcia and A. Hussein, Electrophoresis, 2012, 33, 1755–1767 CrossRef CAS PubMed.
- A. Mehta, H. Herrera and T. Block, in Advances in cancer research, Elsevier, 2015, vol. 126, pp. 257–279 Search PubMed.
- S. Pan, T. A. Brentnall and R. Chen, World J. Gastroenterol., 2016, 22, 9288–9299 CrossRef CAS PubMed.
- L. Veillon, C. Fakih, H. Abou-El-Hassan, F. Kobeissy and Y. Mechref, ACS Chem. Neurosci., 2018, 9, 51–72 CrossRef CAS PubMed.
- L. Veillon, Y. Huang, W. Peng, X. Dong, B. G. Cho and Y. Mechref, Electrophoresis, 2017, 38, 2100–2114 CrossRef CAS PubMed.
- X. Dong, Y. Huang, B. G. Cho, J. Zhong, S. Gautam, W. Peng, S. D. Williamson, A. Banazadeh, K. Y. Torres-Ulloa and Y. Mechref, Electrophoresis, 2018, 39, 3063–3081 CrossRef CAS PubMed.
- A. Yu, J. Zhao, W. Peng, A. Banazadeh, S. D. Williamson, M. Goli, Y. Huang and Y. Mechref, Electrophoresis, 2018, 39, 3104–3122 CrossRef CAS PubMed.
- M. Gaye, T. Ding, H. Shion, A. Hussein, Y. Hu, S. Zhou, Z. Hammoud, B. Lavine, Y. Mechref and J. Gebler, Analyst, 2017, 142, 1525–1535 RSC.
- M. M. Gaye, S. J. Valentine, Y. Hu, N. Mirjankar, Z. T. Hammoud, Y. Mechref, B. K. Lavine and D. E. Clemmer, J. Proteome Res., 2012, 11, 6102–6110 CrossRef CAS PubMed.
- J. Hofmann and K. Pagel, Angew. Chem., Int. Ed. Engl., 2017, 56, 8342–8349 CrossRef CAS PubMed.
- C. Manz and K. Pagel, Curr. Opin. Chem. Biol., 2018, 42, 16–24 CrossRef CAS PubMed.
- G. Lu, C. L. Crihfield, S. Gattu, L. M. Veltri and L. A. Holland, Chem. Rev., 2018, 118, 7867–7885 CrossRef CAS PubMed.
- Y. Mechref, Electrophoresis, 2011, 32, 3467–3481 CrossRef CAS PubMed.
- S. Suzuki, Anal. Sci., 2013, 29, 1117–1128 CrossRef CAS PubMed.
- S. Hua, C. C. Williams, L. M. Dimapasoc, G. S. Ro, S. Ozcan, S. Miyamoto, C. B. Lebrilla, H. J. An and G. S. Leiserowitz, J. Chromatogr. A, 2013, 1279, 58–67 CrossRef CAS PubMed.
- D. Kolarich, M. Windwarder, K. Alagesan and F. Altmann, Methods Mol. Biol., 2015, 1321, 427–435 CrossRef PubMed.
- Y. Liu, C. Wang, R. Wang, Y. Wu, L. Zhang, B.-F. Liu, L. Cheng and X. Liu, J. Proteomics, 2018, 181, 160–169 CrossRef CAS PubMed.
- S. Zhou, Y. Huang, X. Dong, W. Peng, L. Veillon, D. A. S. Kitagawa, A. J. A. Aquino and Y. Mechref, Anal. Chem., 2017, 89, 6590–6597 CrossRef CAS PubMed.
- S. Zhou, L. Veillon, X. Dong, Y. Huang and Y. Mechref, Analyst, 2017, 142, 4446–4455 RSC.
- R. Zhu, S. Zhou, W. Peng, Y. Huang, P. Mirzaei, K. Donohoo and Y. Mechref, J. Proteome Res., 2018, 17, 2668–2678 CrossRef PubMed.
- F. Tousi, J. Bones, W. S. Hancock and M. Hincapie, Anal. Chem., 2013, 85, 8421–8428 CrossRef CAS PubMed.
- M. Wuhrer, A. R. de Boer and A. M. Deelder, Mass Spectrom. Rev., 2009, 28, 192–206 CrossRef CAS PubMed.
- G. C. Vreeker and M. Wuhrer, Anal. Bioanal. Chem., 2017, 409, 359–378 CrossRef CAS PubMed.
- R. R. Drake, T. W. Powers, E. E. Jones, E. Bruner, A. S. Mehta and P. M. Angel, Adv. Cancer Res., 2017, 134, 85–116 CrossRef CAS PubMed.
- D. J. Harvey, Mass Spectrom. Rev., 2015, 34, 268–422 CrossRef CAS PubMed.
- D. J. Harvey, Mass Spectrom. Rev., 2018, 37, 353–491 CrossRef CAS PubMed.
- W. R. Alley Jr and M. V. Novotny, J. Proteome Res., 2010, 9, 3062–3072 CrossRef PubMed.
- N. de Haan, K. R. Reiding, M. Haberger, D. Reusch, D. Falck and M. Wuhrer, Anal. Chem., 2015, 87, 8284–8291 CrossRef CAS PubMed.
- K. Jiang, H. Zhu, L. Li, Y. Guo, E. Gashash, C. Ma, X. Sun, J. Li, L. Zhang and P. G. Wang, Anal. Chim. Acta, 2017, 981, 53–61 CrossRef CAS PubMed.
- H. Li, W. Gao, X. Feng, B.-F. Liu and X. Liu, Anal. Chim. Acta, 2016, 924, 77–85 CrossRef CAS PubMed.
- K. R. Reiding, D. Blank, D. M. Kuijper, A. M. Deelder and M. Wuhrer, Anal. Chem., 2014, 86, 5784–5793 CrossRef CAS PubMed.
- D. Asakawa, N. Smargiasso and E. De Pauw, Anal. Chem., 2012, 84, 7463–7468 CrossRef CAS PubMed.
- D. Asakawa, N. Smargiasso and E. De Pauw, J. Mass Spectrom., 2014, 49, 1059–1062 CrossRef CAS PubMed.
- D. Debois, N. Smargiasso, K. Demeure, D. Asakawa, T. A. Zimmerman, L. Quinton and E. De Pauw, Top. Curr. Chem., 2013, 331, 117–141 CrossRef CAS PubMed.
- Q. Liang, T. Macher, Y. Xu, Y. Bao and C. J. Cassady, Anal. Chem., 2014, 86, 8496–8503 CrossRef CAS PubMed.
- H. Yang, Z. J. Li, D. Wan, W. Lian and S. Liu, J. Mass Spectrom., 2013, 48, 539–543 CrossRef CAS PubMed.
- H. Yang, Y. Yu, F. Song and S. Liu, J. Am. Soc. Mass Spectrom., 2011, 22, 845–855 CrossRef CAS PubMed.
- A. Banazadeh, W. Peng, L. Veillon and Y. Mechref, J. Am. Soc. Mass Spectrom., 2018, 29, 1892–1900 CrossRef CAS PubMed.
- M. Guan, Z. Zhang, S. Li, J. Liu, L. Liu, H. Yang, Y. Zhang, T. Wang and Z. Zhao, Talanta, 2018, 179, 624–631 CrossRef CAS PubMed.
- N. Hasan and H. F. Wu, Anal. Bioanal. Chem., 2011, 400, 3451–3462 CrossRef CAS PubMed.
- S. Ju and W. S. Yeo, Nanotechnology, 2012, 23, 135701–135707 CrossRef PubMed.
- C. Jun, H. Tianxi and F. Xuemei, Talanta, 2012, 100, 419–424 CrossRef PubMed.
- S. K. Kailasa, S. D'Souza and H. F. Wu, Bioanalysis, 2015, 7, 2265–2276 CrossRef CAS PubMed.
- S. K. Kailasa and H. F. Wu, Analyst, 2012, 137, 1629–1638 RSC.
- Q. Liang, J. Sherwood, T. Macher, J. M. Wilson, Y. Bao and C. J. Cassady, J. Am. Soc. Mass Spectrom., 2017, 28, 409–418 CrossRef CAS PubMed.
- X. S. Li, J. H. Wu, L. D. Xu, Q. Zhao, Y. B. Luo, B. F. Yuan and Y. Q. Feng, Chem. Commun., 2011, 47, 9816–9818 RSC.
- Y. Chen, D. Gao, H. Bai, H. Liu, S. Lin and Y. Jiang, J. Am. Soc. Mass Spectrom., 2016, 27, 1227–1235 CrossRef CAS PubMed.
- W. Lu, Y. Li, R. Li, S. Shuang, C. Dong and Z. Cai, ACS Appl. Mater. Interfaces, 2016, 8, 12976–12984 CrossRef CAS PubMed.
- A. Banazadeh, S. Williamson, M. Zabet, A. Hussien and Y. Mechref, Anal. Bioanal. Chem., 2018, 410, 7395–7404 CrossRef CAS PubMed.
- Y. Liu, J. Liu, C. Deng and X. Zhang, Rapid Commun. Mass Spectrom., 2011, 25, 3223–3234 CrossRef CAS PubMed.
- Q. Liu, M. Cheng, J. Wang and G. Jiang, Chem. Eur. J, 2015, 21, 5594–5599 CrossRef CAS PubMed.
- S. Zhou, X. Dong, L. Veillon, Y. Huang and Y. Mechref, Anal. Bioanal. Chem., 2017, 409, 453–466 CrossRef CAS PubMed.
- A. Ceroni, K. Maass, H. Geyer, R. Geyer, A. Dell and S. M. Haslam, J. Proteome Res., 2008, 7, 1650–1659 CrossRef CAS PubMed.
- B. Domon and C. E. Costello, Glycoconjugate J., 1988, 5, 397–409 CrossRef CAS.
- S. Hua, H. J. An, S. Ozcan, G. S. Ro, S. Soares, R. DeVere-White and C. B. Lebrilla, Analyst, 2011, 136, 3663–3671 RSC.
- M. Pabst and F. Altmann, Anal. Chem., 2008, 80, 7534–7542 CrossRef CAS PubMed.
- M. Pabst, J. S. Bondili, J. Stadlmann, L. Mach and F. Altmann, Anal. Chem., 2007, 79, 5051–5057 CrossRef CAS PubMed.
- K. N. Kirschner, A. B. Yongye, S. M. Tschampel, J. González-Outeiriño, C. R. Daniels, B. L. Foley and R. J. Woods, J. Comput. Chem., 2008, 29, 622–655 CrossRef CAS PubMed.
- A. D. Becke, J. Chem. Phys., 1993, 98, 5648–5652 CrossRef CAS.
- A. Schäfer, H. Horn and R. Ahlrichs, J. Chem. Phys., 1992, 97, 2571–2577 CrossRef.
- C. Hättig and F. Weigend, J. Chem. Phys., 2000, 113, 5154–5161 CrossRef.
- S. Grimme, J. Antony, S. Ehrlich and H. Krieg, J. Chem. Phys., 2010, 132, 154104–154122 CrossRef PubMed.
- R. Ahlrichs, M. Bär, M. Häser, H. Horn and C. Kölmel, Chem. Phys. Lett., 1989, 162, 165–169 CrossRef CAS.
- S. Albrecht, S. Vainauskas, H. Stöckmann, C. McManus, C. H. Taron and P. M. Rudd, Anal. Chem., 2016, 88, 4795–4802 CrossRef CAS PubMed.
- A. D. Garcia, J. L. Chavez and Y. Mechref, J Chromatogr B, 2014, 947, 1–7 CrossRef PubMed.
- C. Hamark, R. P.-A. Berntsson, G. Masuyer, L. M. Henriksson, R. Gustafsson, P. l. Stenmark and G. r. Widmalm, J. Am. Chem. Soc., 2016, 139, 218–230 CrossRef PubMed.
- Y. Robert K, Y.-T. Tsai, T. Ariga and M. Yanagisawa, J. Oleo Sci., 2011, 60, 537–544 CrossRef.
- Y. Hu, T. Shihab, S. Zhou, K. Wooding and Y. Mechref, Electrophoresis, 2016, 37, 1498–1505 CrossRef CAS PubMed.
- A. Mayampurath, E. Song, A. Mathur, C. Y. Yu, Z. Hammoud, Y. Mechref and H. Tang, J. Proteome Res., 2014, 13, 4821–4832 CrossRef CAS PubMed.
- K. R. Reiding, D. Blank, D. M. Kuijper, A. M. Deelder and M. Wuhrer, Anal. Chem., 2014, 86, 5784–5793 CrossRef CAS PubMed.
- C. M. Snyder, X. Zhou, J. A. Karty, B. R. Fonslow, M. V. Novotny and S. C. Jacobson, J. Chromatogr. A, 2017, 1523, 127–139 CrossRef CAS PubMed.
- S. Chen, H. Zheng, J. Wang, J. Hou, Q. He, H. Liu, C. Xiong, X. Kong and Z. Nie, Anal. Chem., 2013, 85, 6646–6652 CrossRef CAS PubMed.
- S. Miyagawa, A. Maeda, T. Kawamura, T. Ueno, N. Usui, S. Kondo, S. Matsumoto, T. Okitsu, M. Goto and H. Nagashima, Glycobiology, 2014, 24, 125–138 CrossRef CAS PubMed.
- S. Chen, C. Xiong, H. Liu, Q. Wan, J. Hou, Q. He, A. Badu-Tawiah and Z. Nie, Nat. Nanotechnol., 2015, 10, 176–182 CrossRef CAS PubMed.
- C. Jin, J. T. Padra, K. Sundell, H. Sundh, N. G. Karlsson and S. K. Linden, J. Proteome Res., 2015, 14, 3239–3251 CrossRef CAS PubMed.
- W. B. Struwe, R. Gough, M. E. Gallagher, D. T. Kenny, S. D. Carrington, N. G. Karlsson and P. M. Rudd, Mol. Cell. Proteomics, 2015, 14, 1464–1477 CrossRef CAS PubMed.
- V. Venkatakrishnan, M. P. Quintana-Hayashi, M. Mahu, F. Haesebrouck, F. Pasmans and S. K. Linden, J. Proteome Res., 2017, 16, 1728–1742 CrossRef CAS PubMed.
- G. Dekkers, A. E. H. Bentlage, R. Plomp, R. Visser, C. A. M. Koeleman, A. Beentjes, J. Y. Mok, W. J. E. van Esch, M. Wuhrer, T. Rispens and G. Vidarsson, Mol. Immunol., 2018, 94, 54–60 CrossRef CAS PubMed.
- A. Ogura, S. Urano, T. Tahara, S. Nozaki, R. Sibgatullina, K. Vong, T. Suzuki, N. Dohmae, A. Kurbangalieva, Y. Watanabe and K. Tanaka, Chem. Commun., 2018, 54, 8693–8696 RSC.
- L. Zhan, X. Xie, Y. Li, H. Liu, C. Xiong and Z. Nie, Anal. Chem., 2018, 90, 1525–1530 CrossRef CAS PubMed.
Footnote |
| † Electronic supplementary information (ESI) available. See DOI: 10.1039/c9ra02337b |
| This journal is © The Royal Society of Chemistry 2019 |

