 Open Access Article
Fluorescent delivery vehicle containing cobalt oxide–umbelliferone nanoconjugate: DNA/protein interaction studies and anticancer activity on MF7 cancer cell line†
Mohd Sajid Ali a,
Sartaj Tabassum
 *ac,
Hamad A. Al-Lohedana,
Mohammad Abul Farahb,
Khalid Mashay Al-Anazib and
Mohammad Usmanc
aSurfactant Research Chair, Department of Chemistry, College of Sciences, King Saud University, P.O. Box 2455, Riyadh 11451, Kingdom of Saudi Arabia. E-mail: tsartaj62@yahoo.com; Tel: +96 6530128012
bDepartment of Zoology, College of Sciences, King Saud University, Riyadh 11451, Kingdom of Saudi Arabia
cDepartment of Chemistry, Aligarh Muslim University, Aligarh-2002, India. Tel: +91 9358255791
First published on 23rd August 2019
Abstract
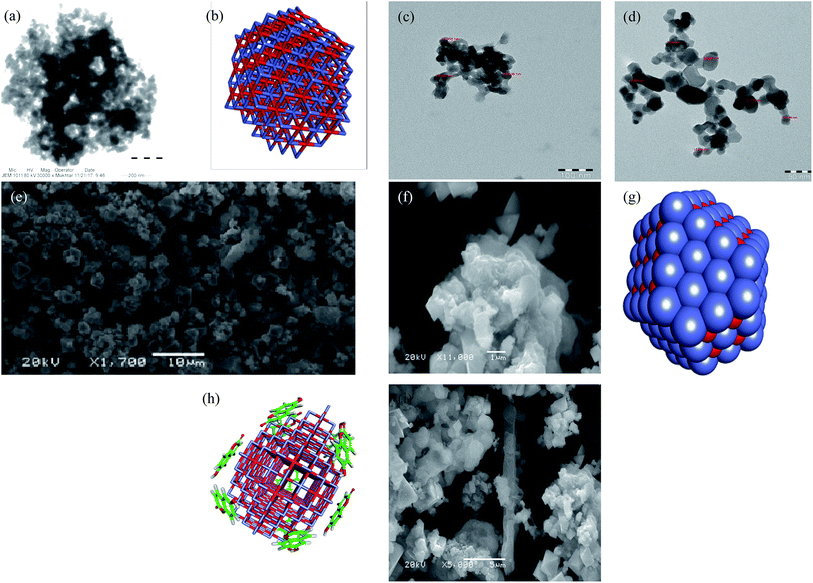
Fluorescent labeling is limited to certain molecules and alters biomolecule functionality. A new class of nanomaterial with anticancer activity and fluorescence properties has been designed and prepared. This nanotherapeutic conjugate of natural molecules has a selective binding site in cancer cell lines. Natural drug umbelliferone was taken with cobalt metal ions in a one pot assembly in the presence of tannic acid which yields new fluorescent nanoparticles of umbelliferone cobalt oxide nanoconjugate. Umbelliferone has high fluorescent properties and also has coordination ability to bind with central metal ions. The nanoconjugate was synthesized and characterized by using TEM, EDX analysis, SEM, XRD, and FTIR spectroscopy. TEM shows that the average size of the particles formed with umbelliferone is ∼20 nm. The solubility of the drug nanoparticles in water showed compatibility with cancer cells and provided a favorable environment to investigate the mechanism of action on the MCF-7 cell line. The nanoconjugate is microcrystalline in nature and gives a clear suspension in water. The nanocobalt conjugate was loaded on TiO2 nanoparticles by ultrasonication, and the solution was digested overnight. The conjugate of the drug with a TiO2 drug carrier was stable in solution and maintained the nanostructure ∼34.6 nm. A comparative study with nano-vehicle TiO2 and the nanoconjugate was performed. TiO2 was used to compare the anti-cancer activity of the nanoconjugate at low dose in vitro. It was observed that the nanoconjugate with TiO2 is capable of reaching the specific target like the TiO2 nanoparticle and enhance the chemotherapeutic impact. Hence, the nanoconjugate can also be used like nano-TiO2, as the drug and carrier. The ct-DNA and HSA protein binding studies were done and validated by docking studies.
1. Introduction
Nanoparticle based conjugate biomaterials have opened a new area of research in medical sciences and radio-oncology. The nano-dimension molecules are being exploited for radiodiagnosis, chemotherapeutic, and enzyme mimicking applications.1–3 Metal nanoparticles with paramagnetic properties are attractive because their optical, magnetic and chemical properties can be modified for biosensing.4–6 Antibodies in life science have gained momentum, with their conjugates being used for targeted drug therapy.The demand for labeling technologies has enabled the production of nanoconjugates for imaging and drug delivery properties. There is a need to develop dual functional nanotherapeutic bioconjugates for in vivo and in vitro model systems. Nano fluorescent molecules are important drugs for the diagnosis and treatment of cancer.7,8
The literature showed that the high concentrations of nano-TiO2 induce lung cancer in mice.9,10 TiO2 nanoparticles can serve as potential tumor cell-killing agents, and gene targeting materials. The impacts of TiO2 on cytotoxicity in renal and neural cells and ROS have thoroughly been investigated.11
Umbelliferone is a coumarin derivative and has anticoagulant12,13 and fluorescent properties.14 Transition metal complexes of umbelliferone derivatives synthesized, characterized and their antitumor activity has also been reported.15–17 The Umbelliferae derivatives have high antimutagenic and anti-carcinogenic activity.18
It has been reported that TiO2 can move in the blood through plasma proteins, the specific interactions between nanoparticles and proteins are not well studied. The TiO2 particles may react with cell membrane proteins, and interaction with DNA followed by ROS has an essential role in DNA damage, destruction of the membrane and finally cell death.19
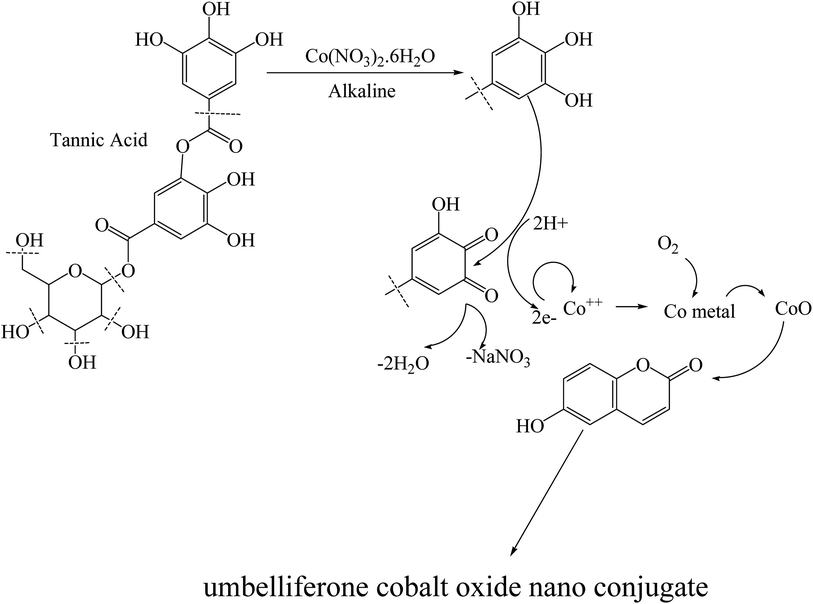
The literature survey shows that a comparative study on nanoconjugate with TiO2 nanoparticles is still in demand. That motivated us to synthesized fluorescent nano cobalt oxide conjugate, to explore its anti-cancer activity, and its prospective application in diagnostic medicine. A modified method was opted to get nano-complex of cobalt(II) with umbelliferone in the presence of tannic acid in the alkaline medium. Tannic acid, contains glucose and poly galloyl ester chains, hydrolyzes in both acidic and basic conditions and gives gallic acid and glucose. The fragments have weak reducing properties which protect high oxidation of cobalt ion. The umbelliferone is a coordination ligand and captures the cobalt oxide at room temperature and yields fluorescent nanoconjugate. In vitro biological evaluation suggests that no apparent toxicity of the TiO2/CoO–umbelliferone coating and the conjugation stimulates the cell proliferation. Comparative study with TiO2 and TiO2–CoO–umbelliferone conjugate exhibits improved anti-cancer activity of the latter.
The surface modification of TiO2 materials may provide hybrid material for the further development of bioactive duel function conjugate to better meet the medical demand. The literature survey shows that naturally occurring coumarins exhibit antimutagenic activity and prevent dimethyl benz(a)anthracene-induced mammary neoplasia.19 Polymeric nanoparticles are widely used in pharmaceutical research. The objective of this project was to develop a new and economically viable nanoconjugate which has anti-cancer activity and fluorescence property as well. Here, we report a simple method to synthesize nano dual function fluorescent pharmaceuticals & probe and delivery agent like nano-TiO2.
2. Material and methods
Umbelliferone, cobalt(II) nitrate hexahydrate obtained from Fluka Trypan blue, phosphate buffered saline (PBS), dimethyl sulfoxide (DMSO), ethidium bromide, acridine orange, and Dulbecco's Modified Eagle's medium (DMEM), Tannic acid and nano-TiO2 obtained from Sigma-Aldrich (St Louis, MO, USA). CellTiter 96® Non-radioactive cell proliferation assay kit obtained from Promega (Madison, WI, USA). All reagents were of the best commercial grade and used without further purification. Fourier-transform IR (FTIR) spectra recorded on an Interspec 2020 FTIR spectrometer PerkinElmer Model 1320 spectrometer (KBr disk, 400–4000 cm−1), PerkinElmer UV-vis spectrophotometer, Shimadzu RF-5301 PC spectrofluorophotometer. Axygen horizontal electrophoretic assembly with power supply and Vilber-Infinity gel documentation system for imaging. Powder X-ray diffraction (XRD) of the products was measured using a Philips X'Pert PRO MPD diffractometer at a scanning rate of 4° min−1, with 2α ranging from 10° to 70°, using Cu Kα radiation (=1.5406 Å). Thermal studies were conducted using a TGA/SDTA 851e (Mettler Toledo) thermogravimetric analyzer in ambient atmosphere from 20 °C to 500 °C at a heating rate of 10 °C min−1. The morphologies of the samples studied by scanning electron microscopy (SEM) (JEOL SM5600LV) at 20 kV. The powders were ultrasonicated in ethanol, and a drop of the suspension dried on a carbon-coated microgrid. Transmission electron microscopy (TEM) observations performed with a JEM 100CX-II microscope operated at 100 kV.2.1. Synthesis of nanoconjugate
The synthesis of the nanoconjugate is done according to the simple procedure (Scheme 1) by using tannic acid as reducing and activating agent. A methanolic solution of cobalt nitrate (0.001 mol) was taken in a round bottom flask and umbelliferone was added (0.001 mol) to it to form a clear pink solution. To the stirring solution, tannic acid was added dropwise in open assembly. The solution of the reactants sonicated for one hour till a brown colored fine powder obtained. The product was centrifuged and washed with ethanol and again centrifuged and washed several times with ethanol and dried in vaccuo.2.2. DNA binding and cleavage
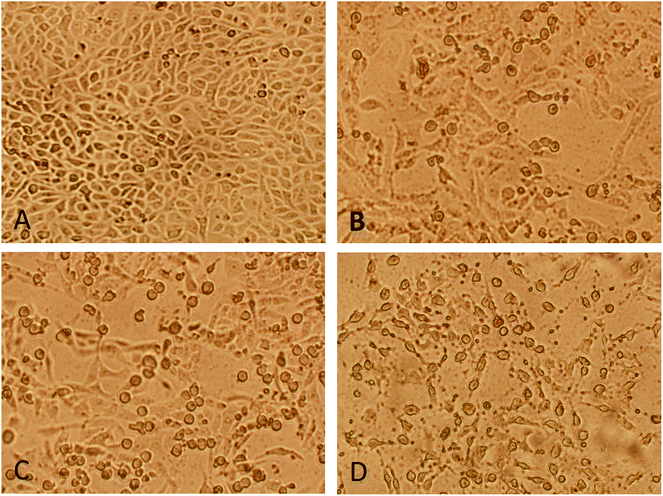
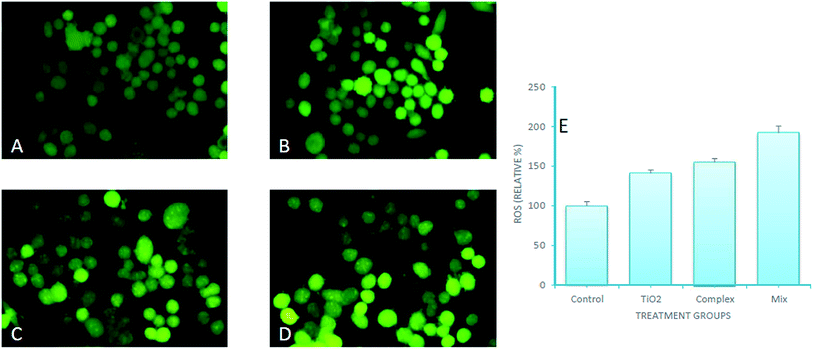
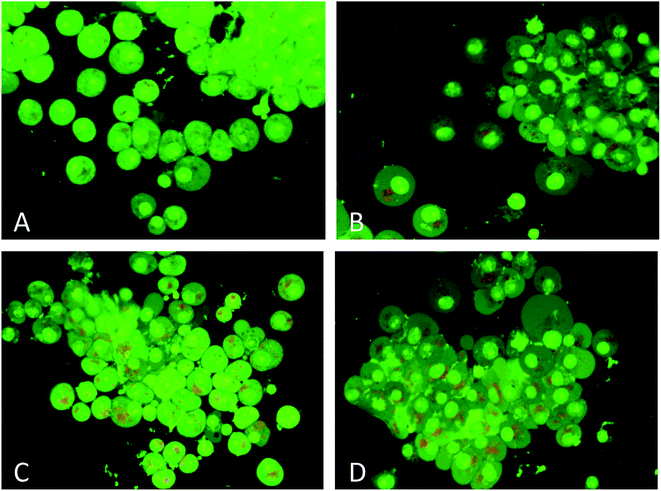
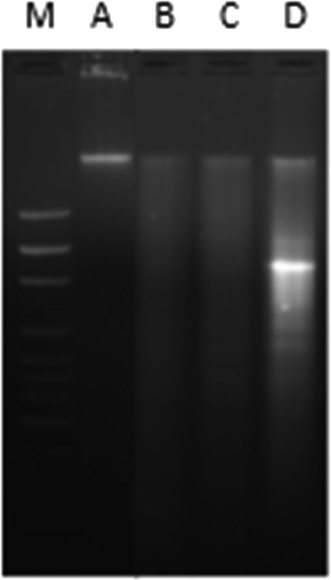
DNA binding experiments were done using the standard protocol.20 The MCF-7 human breast adenocarcinoma cell line was obtained from American Type Culture Collection (ATCC, Rockville, MD, USA) and cell were grown in DMEM with 10% FBS and 1% antibiotics at 37 °C with 5% CO2 (for detail see ESI†). MTT colorimetric assay with some modifications was performed using a CellTiter 96® non-radioactive cell proliferations assay kit (Promega, Madison, WI, USA). Morphological changes in cells (MCF-7) after treatment with nanoconjugate for 24 h were visualized under 100× a phase contrast inverted microscope. Intracellular ROS generation was analysed by staining the cells after treatment with fluorescent dye (carboxy-H2 DCFDA). Quantitative estimation of ROS was achieved by measuring fluorescence and qualitative observation was performed by acquiring images under fluorescence microscope. Acidic vesicular organelles (AVOs), as a marker of autophagy induction were observed by fluorescence microscopy after staining of cells with acridine orange (AO). An apoptosis DNA ladder kit (Roche Diagnostics, Mannheim, Germany) was used to analyse DNA fragmentation on agarose gel electrophoresis. All experiments were carried out with three independent replicates. Values were presented as mean ± standard error of the mean (SEM). Data were analyzed using the Student's t-test for comparison between the means applying a significance level of P < 0.05. For more details on these experiments see ESI.†2.3. Molecular docking
The rigid molecular docking studies performed by using HEX 8.0.0 software, which is an interactive molecular graphics program for calculating and displaying available docking modes of protein. The Hex 8.0.0 performs protein docking using Spherical Polar Fourier Correlations21 the parameters used for docking include correlation type – shape only, FFT mode – 3D, grid dimension – 0.6, receptor range – 180, ligand range – 180, twist range – 360, distance range – 40. The crystal structure of DNA and the human serum albumin (PDB ID: 1bna, 1h9z) downloaded from the protein data bank (http://www.rcsb.org./pdb). Visualization of minimum energy favorable docked poses has been performed using Discovery studio 4.1.222.4. Binding of nanoconjugate with calf thymus DNA and HAS
HSA and DNA binding studies were carried out using UV-visible, fluorescence quenching and circular dichroism methods and the detailed experimental procedures for these studies have been described elsewhere.20,23–273. Result and discussion
Nanoconjugate has dual character as drug and a carrier, nanostructural arrangement enhance cellular uptake.28–30 Immunomodulation of the drug has opened new sub-area of research.31 Several self-assembled nanostructures have been studied by TEM and it has been observed that the driving forces such as hydrogen bonds and van der Waals forces exist. The effective delivery also depends on other factors, specific targeting, cell uptake, kinetics, and clearance. The present study was focused on nanoconjugation to minimize drug degradation and increase absorption in the cell. Natural organic conjugate nanoparticles possess many desirable features for drug delivery in three distinct interfaces, suitable for endocytosis, less toxic and biodegradable. To recognize and respond to biomolecules has recently been exploited to deliver therapeutic compounds via drug carrier. The loading mechanisms, therapeutic targets delivery, and efficacy enhanced many folds through this method. The importance of such nanoconjugate for drug/drug delivery agent, it has spaced structures for adsorbing second drug moiety. The cytotoxicity of this nanoconjugate evaluated on the receptor in the cell. Umbelliferone was successfully attached to the nanocobalt oxide nanoparticles by covalent interaction, exhibit cytotoxicity and induce apoptosis in cancer cells. Fluorescence microscopy study shows the dose of the conjugate particle absorbed by MF7 cancer cells, which demonstrated that cells overexpressing the conjugate receptor internalized a higher level of this nanoconjugate then TiO2.3.1. Characterization of nanoconjugate
d = 0.9λ/β![[thin space (1/6-em)]](https://www.rsc.org/images/entities/char_2009.gif) cos cos![[thin space (1/6-em)]](https://www.rsc.org/images/entities/char_2009.gif) θ, θ,
| (1) |
![[double bond, length as m-dash]](https://www.rsc.org/images/entities/char_e001.gif) O stretching at 1612 cm−1 indicated that CoO conjugated to C
O stretching at 1612 cm−1 indicated that CoO conjugated to C![[double bond, length as m-dash]](https://www.rsc.org/images/entities/char_e001.gif) O and C–OH of umbelliferone. 763 cm−1,1069 cm−1 and 1231 cm−1, 1372 cm−1 are due to C–O and C–O–C. The peak at 2840 cm−1 is due to C–H stretching vibration of umbelliferone.
O and C–OH of umbelliferone. 763 cm−1,1069 cm−1 and 1231 cm−1, 1372 cm−1 are due to C–O and C–O–C. The peak at 2840 cm−1 is due to C–H stretching vibration of umbelliferone.![[double bond, length as m-dash]](https://www.rsc.org/images/entities/char_e001.gif) O⋯H–O–umbelliferone–C
O⋯H–O–umbelliferone–C![[double bond, length as m-dash]](https://www.rsc.org/images/entities/char_e001.gif) O → Co
O → Co![[double bond, length as m-dash]](https://www.rsc.org/images/entities/char_e001.gif) ]O, the calculated mass M/Z = 295.99 (Fig. S3†) is close to the experimental value of nanoconjugate, i.e., 293.199. The mass fragments 74
]O, the calculated mass M/Z = 295.99 (Fig. S3†) is close to the experimental value of nanoconjugate, i.e., 293.199. The mass fragments 74![[thin space (1/6-em)]](https://www.rsc.org/images/entities/char_2009.gif) 111
111![[thin space (1/6-em)]](https://www.rsc.org/images/entities/char_2009.gif) 163 are the umbelliferone components as reported in the literature.34,35 The TGA further support that the conjugate is non-hygroscopic nature, there is no remarkable loss below 100 °C. The organic moiety of umbelliferone resists fragmentation up to about 500 °C. The total loss in weight percentage supporting the loss of umbelliferone (Fig. S4†).
163 are the umbelliferone components as reported in the literature.34,35 The TGA further support that the conjugate is non-hygroscopic nature, there is no remarkable loss below 100 °C. The organic moiety of umbelliferone resists fragmentation up to about 500 °C. The total loss in weight percentage supporting the loss of umbelliferone (Fig. S4†).3.2. Molecular docking
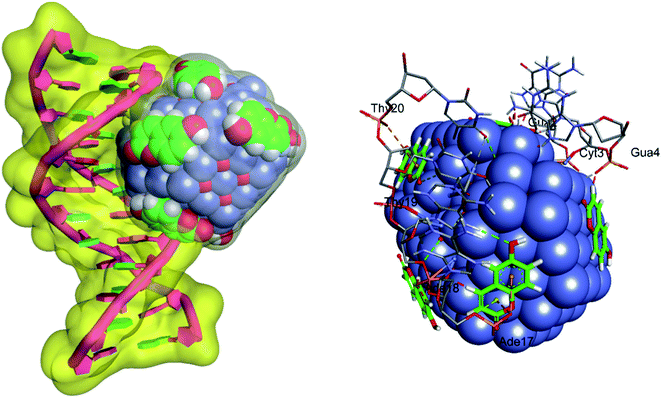
The literature on the docking or molecular simulation studies of the nano-drug conjugate is scarce. The main problem resides in the simulation of structural coordinates or molecular assembly of the nano-drug conjugate. Here we adopt a three-step molecular simulation protocol, (1) generation of 2 nm CoO nanoparticle atomic coordinates. (2) Interaction of nanoparticle with corresponding drug moiety to find out the surface level interaction and confirmation of drug moiety. (3) The molecular docking of drug nanoconjugate with DNA. The molecular assembly of 2 nm CoO generated from the crystal structure investigation file is directly taken from the CCDC. The generated 2 nm CoO nanoparticle molecular structure is then subjected to energy minimization along with the ten numbers of drug molecules by employing the molecular mechanic's force field.| Name | Distance (Å) | Category | Type |
|---|---|---|---|
| a Note: UNK1 = nanodrug-conjugate. | |||
| :UNK1:O1 – A:ALA201:O | 3.0465 | Hydrogen bond | Hydrogen bond |
| A:LYS205:CA – :UNK1:O | 3.45698 | Hydrogen bond | C–H bond |
| A:LYS205:CE – :UNK1:O1 | 3.26261 | Hydrogen bond | C–H bond |
| *A:LYS205:CE – :UNK1:O1 | 3.09276 | Hydrogen bond | C–H bond |
| :UNK1:CO1 – A:TYR148:OH | 3.03676 | Other | Metal-acceptor |
| :UNK1:CO1 – A:GLN104:O | 3.37952 | Other | Metal-acceptor |
| A:VAL462:CG2 – :UNK1 | 2.45914 | Hydrophobic | Pi–σ |
| A:VAL462:CG2 – :UNK1 | 3.29989 | Hydrophobic | Pi–σ |
| :UNK1 – A:CYS246 | 5.44805 | Hydrophobic | Pi-alkyl |
| :UNK1 – A:LYS205 | 4.07321 | Hydrophobic | Pi-alky |
| :UNK1 – A:LYS205 | 4.22508 | Hydrophobic | Pi-alkyl |
These non-covalent interaction formed by drug nanoconjugate dominated by hydrophobic contact while additional stabilization also assisted by the hydrogen bonding and other metal acceptor type noncovalent interactions with the polar residues of the binding site cavity. It was previously observed that hydrogen bonding and metal acceptor interaction decreased the hydrophilicity and increased the hydrophobicity to keep the drug nanoconjugate – HSA system stable.39
3.3. In vitro DNA and HSA binding studies in solutions
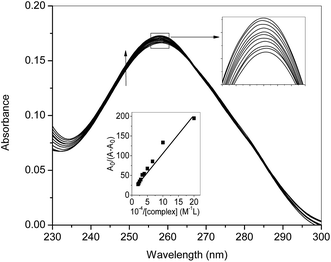
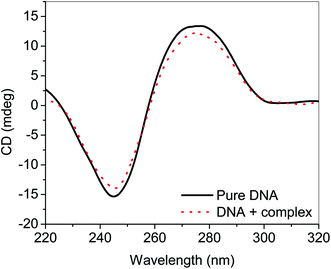
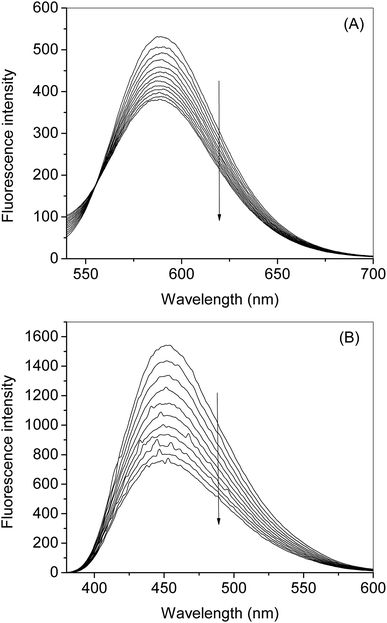
UV-visible spectroscopy was employed to see the changes in the UV-visible spectral profiles of ct-DNA in the presence of nanoconjugate (Fig. 5). Hyperchromism was observed with increasing concentration of ct-DNA confirming the interaction of complex and ct-DNA which suggests the possibility of interactions between them. The apparent rate constant was evaluated using Benesi–Hildebrand equation40 which was found to be 1.67 × 10⁴ M−1. For getting more insight on the interaction between ct-DNA and nanoconjugate dye displacement method (using EB and DAPI) along with circular dichroism spectroscopy performed, and the results have also been validated using molecular docking simulations.The CD spectrum of ct-DNA displays one positive peak at 275 nm due to the base pair stacking while a negative peak around 245 nm is due to the helicity. It is known that intercalating molecules affect the CD spectra of DNA while groove binders did not show any considerable influence41 As evident from the figure. Three, that complex has some effect (though not very large as expected in case of classical intercalators and also not very small or negligible anticipated for groove binders) on the CD spectrum of ct-DNA. It is considered that the binding site of the complex is somewhere at the interfacial region of the intercalating site and groove region. To confirm our hypothesis we have performed dye displacement assays using EB which is a classical intercalator and DAPI which is known to bind at minor groove under our experimental conditions26,27 and the results are shown in Fig. 6.
Both EB and DAPI display very low fluorescence emission, but the fluorescence intensity of both dyes increases multifold when these mixed with DNA solutions. Fig. 7A therefore, any molecule which binds at the particular site belongs to these dyes can displace the latter and eventually can decrease the fluorescence40,42 the complex synthesized in the present study has its own fluorescence emission at the excitation wavelength of the DAPI. However, it does not show any fluorescence enhancement in the presence of DNA. To nullify the involvement of the fluorescence of nanoconjugate in case of DAPI emission we have taken the fluorescence emission spectra of successive addition of nanoconjugate to the DNA solution and subtracted these values from the spectra containing the DAPI-DNA mixture and the subtracted spectra given in Fig. 7B. The complex did not show any fluorescence at the excitation wavelength of EB. From the dye displacement study of both EB and DAPI, it is clear that the complex was able to displace both the dyes from their respective solutions and hence can be considered as binding at the interfacial region of the groove and intercalating site. These results have been, further, supported by the computational method using molecular docking which has been given in the corresponding part of the manuscript.
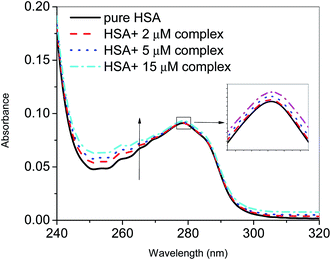
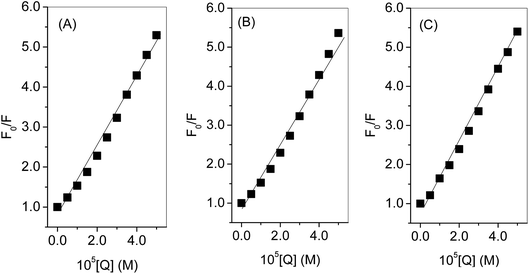
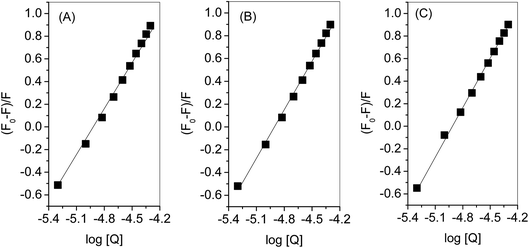
The binding of the nanoconjugate seen with carrier protein human serum albumin (HSA). The UV-visible difference spectra of HSA alone and complexed with the complex given in Fig. 8 the results have shown that on the addition of complex to the HSA, the intensity of latter increases and the increment is directly proportional to the concentration of complex. After this we performed fluorescence quenching experiments by exciting the HSA at 295 nm, in which the protein shows its intrinsic fluorescence owing to the presence of a tryptophan residue.42 Further, the complex didn't show any significant fluorescence in the region of HSA emission. However, due to the significant absorption of the complex in the region of fluorescence emission of HSA, the fluorescence data were corrected for the inner filter effect while calculating the quenching and binding parameters43 the fluorescence quenching spectra of HSA in the presence of complex at 25, 35, and 45 °C is given in Fig. S6A–C,† respectively. The complex is capable of quenching the fluorescence of HSA efficiently which means a strong interaction between them. Stern–Volmer quenching constants have been calculated to elucidate the type of interaction using the following equation:42
| F0/F = 1 + KSV[Q] | (2) |
 | (3) |
 | (4) |
| ΔG = ΔH − TΔS | (5) |
The fluorescence quenching of biomolecules by the ligands takes place either via a static or dynamic type of mechanism. Both quenchings can be differentiated by their behavior concerning the temperature.42 Quenching constant in case of static mechanism decreases on increasing the temperature while it increases for dynamic quenching. Therefore, the fluorescence quenching measurements have been carried out at three different temperatures (25, 35 and 45°) and the values of Stern–Volmer quenching constants (analyzed according to eqn (2) using Fig. 9) given in Table 2. Increase in temperature causes a decrease of Stern–Volmer quenching constant, hence; it can be concluded that dynamic quenching is involved in the interaction between HSA and complex.
| Temperature (°C) | 104 Ksv (M−1) | n | 106 Kb (M−1) | ΔG (kJ M−1) | ΔH (kJ M−1) | ΔS (J K−1 M−1) |
|---|---|---|---|---|---|---|
| 25 | 8.0 | 1.4 | 9.8 | −39.9 | 4.4 | 148 |
| 35 | 8.1 | 1.4 | 10.7 | −41.4 | ||
| 45 | 8.3 | 1.4 | 11.0 | −42.9 |
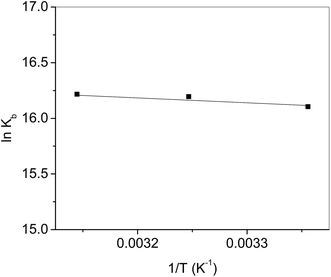
Evaluation of binding constant and number of binding sites was carried out using eqn (3) and Fig. 10 for which the values a given in Table 2. There was 1![[thin space (1/6-em)]](https://www.rsc.org/images/entities/char_2009.gif) :
:![[thin space (1/6-em)]](https://www.rsc.org/images/entities/char_2009.gif) 1 strong binding between HSA and complex. Thermodynamic parameters were evaluated (Table 2) from the linear regression of Fig. 11 using eqn (4) and (5). A high value of ΔG is ascribed to the strong interaction between HSA and complex. From the values of ΔH and ΔS the involvement of electrostatic forces as well as hydrogen bonding is estimated in the interaction.44
1 strong binding between HSA and complex. Thermodynamic parameters were evaluated (Table 2) from the linear regression of Fig. 11 using eqn (4) and (5). A high value of ΔG is ascribed to the strong interaction between HSA and complex. From the values of ΔH and ΔS the involvement of electrostatic forces as well as hydrogen bonding is estimated in the interaction.44
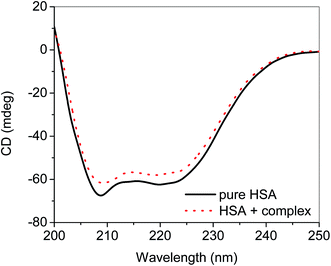
CD was also performed to see the secondary structural changes in the protein and it was found that addition of nanoconjugate resulted in the decrease in the helicity of HSA (Fig. 12).23,45
3.4. pH-Dependent fluorescence studies
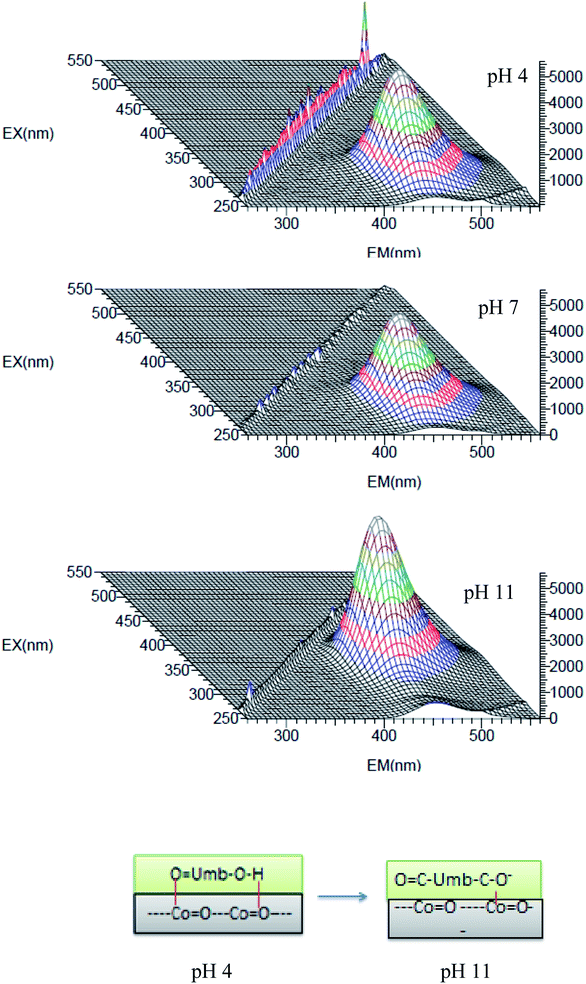
The fluorescence studies of the nanoconjugate were performed at different pH and observed that the conjugate has high fluorescence at pH-10 and stable (Fig. 13 and 14) at pH-4–pH-10 the intensity of the peaks increased when we move from lower to higher pH. The nano-CoO–umbelliferone has pH-dependent fluorescence behavior may be considered as an active probe property for drug dispersion and action observation. The pH dependent fluorescence exciting 330–360 nm wavelength and emission peak absorbance shifted to ∼450 nm, the shift is due to hydrogen bonding with nano-cobalt oxide and umbelliferone hydroxyl group (–Co![[double bond, length as m-dash]](https://www.rsc.org/images/entities/char_e001.gif) Oδ−⋯+δH–−O–umb–C
Oδ−⋯+δH–−O–umb–C![[double bond, length as m-dash]](https://www.rsc.org/images/entities/char_e001.gif) O) further if enhanced the intensity of the fluorescence may be due to (Co
O) further if enhanced the intensity of the fluorescence may be due to (Co![[double bond, length as m-dash]](https://www.rsc.org/images/entities/char_e001.gif) O–umb–O− + H+) deprotonating in aqueous solution46 the stability further enhanced due to electrostatic attraction within nanoconjugate.
O–umb–O− + H+) deprotonating in aqueous solution46 the stability further enhanced due to electrostatic attraction within nanoconjugate.
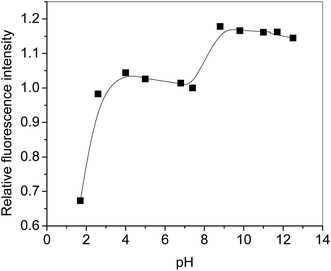 | ||
| Fig. 14 Relative fluorescence intensity of complex as a function of pH at 25 °C. The fluorescence intensity at pH 7 has been taken as a standard to calculate the relative intensity. | ||
3.5. Comparative antiproliferative studies of TiO with CoO–umbelliferone conjugate
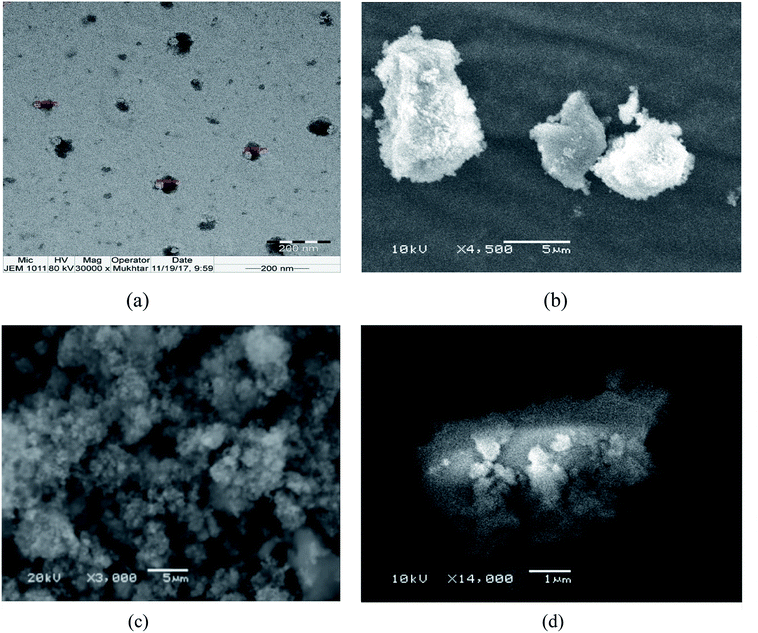
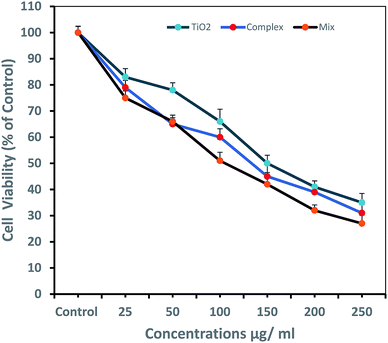
Titanium oxide nanoparticle has been used for anti-cancer activity and drug delivery vehicle as well. Since titanium oxide has its therapeutic impact on cancer cells lines, therefore, researchers have considered it as an active delivery agent for drugs and gene vector.47,48 The literature on cytotoxicity of TiO2 support that TiO2 nanoparticles have a high effect on the breast cancer cell line.11,49–51 Some studies reported the synergistic effect of UV radiation and TiO2 nanoparticles on several cells, nanoparticles react with a water molecule in vitro and yield ROS via electron capture pathway.The titanium nanoconjugate prepared by mixing of CoO umbelliferone and TiO2 with ultra-sonication and the dried nanoparticles analyzed by SEM and TEM, EDX analysis, the size of the mixed nanoparticles was 22–56 nm and EDX confirmed the presence of both the particles TiO2 and umbelliferone conjugate (Fig. 15 and 16). We have compared the anticancer activity of our CoO–umbelliferone conjugate with TiO2, and found that the proposed nanoconjugate has similar activity in vitro system. The IC50 value were compared and concluded that the CoO umbelliferone has promising activity in vitro anticancer evaluation.
4. Conclusion
This paper deals with the new modified chemical method for the preparation of a nano-cobalt oxide conjugate of umbelliferone and study its relative influence on breast cancer cell line MCF-7 at different concentrations in vitro. The nano-cobalt oxide conjugate of umbelliferone has shown impressive fluorescence properties and remarkable cytotoxic potential to act as a chemotherapeutic agent as a good alternative to TiO2. It further helps to find a better-tolerated fluorescent anti-cancer promising drug conjugate for in vivo studies, and seeks to ascertain the drug delivery action in the cancerous cells.Conflicts of interest
There are no conflicts to declare.Abbreviations
| TEM | Transmission electron microscopy |
| EDX | Energy dispersion X-ray analysis |
| SEM | Scanning electron microscopy |
| XRD | X-ray diffraction |
| FTIR | Fourier-transform infra-red |
| ct-DNA | Calf thymus DNA |
| HAS | Human serum albumin |
| TiO2 | Titanium dioxide |
| JCPDS | Joint Committee on Powder Diffraction Standards |
| FWHM | Full width at half maximum |
| ESI | Electronic supplementary information |
Acknowledgements
The project was supported by King Saud University, Vice Dean-ship of Scientific Research, Research Chair.References
- A. Salimi, R. Hallaj and S. Soltanian, Biophys. Chem., 2007, 130, 122–131 CrossRef CAS PubMed.
- D. S. Dimitrov and J. D. Marks, Methods Mol. Biol., 2009, 525, 1–27 CrossRef CAS PubMed.
- M. J. Dykstra and L. E. Reuss, Biological Electron Microscopy: Theory, Techniques, and Troubleshooting, Springer US, 2003 Search PubMed.
- A. M. Wu and T. Olafsen, Cancer J., 2008, 14, 191–197 CrossRef CAS PubMed.
- J. H. Rao, A. Dragulescu-Andrasi, H. Q. Yao and H. Q. Yao, Curr. Opin. Biotechnol., 2007, 18, 17–25 CrossRef CAS PubMed.
- S. M. Ansari, R. D. Bhor, K. R. Pai, D. Sen, S. Mazumder, K. Ghosh, Y. D. Kolekar and C. V. Ramana, Appl. Surf. Sci., 2017, 414, 171–187 CrossRef CAS.
- D. L. Fedlheim and C. A. Foss, Metal Nanoparticles: Synthesis, Characterization, and Applications, Taylor & Francis, 2001 Search PubMed.
- J. Lim and S. A. Majetich, Nano Today, 2013, 8, 98–113 CrossRef CAS.
- E. Bermudez, J. B. Mangum, B. A. Wong, B. Asgharian, P. M. Hext, D. B. Warheit and J. I. Everitt, Toxicol. Sci., 2004, 77, 347–357 CrossRef CAS PubMed.
- A. Wiesenthal, L. Hunter, S. G. Wang, J. Wickliffe and M. Wilkerson, Int. J. Dermatol., 2011, 50, 247–254 CrossRef CAS PubMed.
- B. L'Azou, J. Jorly, D. On, E. Sellier, F. Moisan, J. Fleury-Feith, J. Cambar, P. Brochard and C. Ohayon-Courtes, Part. Fibre Toxicol., 2008, 5(1–14), 22 CrossRef PubMed.
- R. B. Arora and C. N. Mathur, Br. J. Pharmacol. Chemother., 1963, 20, 29–35 CrossRef CAS PubMed.
- S. Lehnert, G. Fisher and G. Methot, Int. J. Radiat. Biol. Relat. Stud. Phys., Chem. Med., 1981, 40, 63–73 CAS.
- N. Nizomov, A. Kholov, A. Ishchenko, V. Ishchenko and V. Khilya, J. Appl. Spectrosc., 2007, 74, 626–634 CrossRef CAS.
- M. N. Hughes, The Inorganic Chemistry of Biological Processes, John Wiley & Sons Incorporated, 1981 Search PubMed.
- S. Knutson, E. Raja, R. Bomgarden, M. Nlend, A. S. Chen, R. Kalyanasundaram and S. Desai, PLoS One, 2016, 11(1–25), e0157762 CrossRef PubMed.
- S. Knutson, E. Raja, R. Bomgarden, M. Nlend, A. S. Chen, R. Kalyanasundaram and S. Desai, [abstract], in Proceedings of the 106th Annual Meeting of the American Association for Cancer Research; 2015 Apr 18-22, AACR; Cancer Res, Philadelphia, PA, 2015, vol. 75(15 suppl), Abstract nr LB-001 Search PubMed.
- S. P. Pillai, S. R. Menon, L. A. Mitscher, C. A. Pillai and D. M. Shankel, J. Nat. Prod., 1999, 62, 1358–1362 CrossRef CAS.
- Q. Zhang, J. J. Zhai, Y. R. Zhang, Y. M. Liu, L. F. Wang, S. B. Li, D. Z. Liao and G. L. Wang, Transition Met. Chem., 2000, 25, 93–98 CrossRef CAS.
- M. Usman, S. Tabassum, F. Arjmand, R. A. Khan, M. S. Ali, H. A. Al-Lohedan, A. Alsalme, M. Abul Farah, K. M. Al-Anazi and M. Ahmad, Inorg. Chim. Acta, 2018, 479, 229–239 CrossRef CAS.
- D. W. Ritchie and V. Venkatraman, Bioinformatics, 2010, 26, 2398–2405 CrossRef CAS PubMed.
- D. Mustard and D. W. Ritchie, Proteins: Struct., Funct., Bioinf., 2005, 60, 269–274 CrossRef CAS PubMed.
- M. S. Ali and H. A. Al-Lohedan, J. Lumin., 2016, 169, 35–42 CrossRef CAS.
- M. S. Ali and H. A. Al-Lohedan, J. Mol. Liq., 2017, 236, 232–240 CrossRef CAS.
- M. S. Ali, H. A. Al-Lohedan, A. M. Atta, A. O. Ezzat and S. A. A. Al-Hussain, J. Mol. Liq., 2015, 204, 248–254 CrossRef CAS.
- M. S. Ali, M. A. Farah, H. A. Al-Lohedan and K. M. Al-Anazi, RSC Adv., 2018, 8, 9083–9093 RSC.
- M. S. Ali, M. A. Farah, H. A. Al-Lohedan and K. M. Al-Anazi, J. Mol. Liq., 2018, 258, 74–84 CrossRef CAS.
- K. Peters, R. E. Unger, C. J. Kirkpatrick, A. M. Gatti and E. Monari, J. Mater. Sci.: Mater. Med., 2004, 15, 321–325 CrossRef CAS PubMed.
- T. Uchino, H. Tokunaga, M. Ando and H. Utsumi, Toxicol. in Vitro, 2002, 16, 629–635 CrossRef CAS PubMed.
- S. Yamaguchi, H. Kobayashi, T. Narita, K. Kanehira, S. Sonezaki, Y. Kubota, S. Terasaka and Y. Iwasaki, Photochem. Photobiol., 2010, 86, 964–971 CrossRef CAS PubMed.
- N. M. Molino and S. W. Wang, Curr. Opin. Biotechnol., 2014, 28, 75–82 CrossRef CAS PubMed.
- R. K. Sharma and R. Ghose, J. Alloys Compd., 2016, 686, 64–73 CrossRef CAS.
- B. D. Cullity, Elements of X Ray Diffraction, BiblioBazaar, 2011 Search PubMed.
- H. Esterbauer, E. Schwarzl and D. Grill, Z. Naturforsch., C: J. Biosci., 1980, 35, 682–684 Search PubMed.
- R. Singh, B. Singh, S. Singh, N. Kumar, S. Kumar and S. Arora, Food Chem., 2010, 120, 825–830 CrossRef CAS.
- A. Örnek, E. Bulut and M. Can, Mater. Charact., 2015, 106, 152–162 CrossRef.
- T. Ahmad, J. Nanotechnol., 2014, 2014, 11 Search PubMed.
- G. Macindoe, L. Mavridis, V. Venkatraman, M. D. Devignes and D. W. Ritchie, Nucleic Acids Res., 2010, 38, 5 CrossRef PubMed.
- B. K. Shoichet, S. L. McGovern, B. Wei and J. J. Irwin, Curr. Opin. Chem. Biol., 2002, 6, 439–446 CrossRef CAS PubMed.
- M. Sirajuddin, S. Ali and A. Badshah, J. Photochem. Photobiol., B, 2013, 124, 1–19 CrossRef CAS PubMed.
- D. Sarkar, P. Das, S. Basak and N. Chattopadhyay, J. Phys. Chem. B, 2008, 112, 9243–9249 CrossRef CAS PubMed.
- J. R. Lakowicz, Principles of Fluorescence Spectroscopy, Springer US, 2007 Search PubMed.
- M. S. Ali, M. Altaf and H. A. Al-Lohedan, J. Photochem. Photobiol., B, 2017, 173, 108–119 CrossRef CAS PubMed.
- P. D. Ross and S. Subramanian, Biochemistry, 1981, 20, 3096–3102 CrossRef CAS PubMed.
- M. S. Ali and H. A. Al-Lohedan, Colloids Surf., B, 2015, 134, 392–400 CrossRef CAS PubMed.
- R. Simkovitch and D. Huppert, J. Phys. Chem. B, 2015, 119, 14683–14696 CrossRef CAS PubMed.
- J. J. Wang, B. J. S. Sanderson and H. Wang, Mutat. Res., Genet. Toxicol. Environ. Mutagen., 2007, 628, 99–106 CrossRef CAS PubMed.
- S. Chattopadhyay, S. K. Dash, T. Ghosh, D. Das, P. Pramanik and S. Roy, Cancer Nanotechnol., 2013, 4, 103–116 CrossRef PubMed.
- C. M. Sayes, R. Wahi, P. A. Kurian, Y. Liu, J. L. West, K. D. Ausman, D. B. Warheit and V. L. Colvin, Toxicol. Sci., 2006, 92, 174–185 CrossRef CAS PubMed.
- J. C. Lai, M. B. Lai, S. Jandhyam, V. V. Dukhande, A. Bhushan, C. K. Daniels and S. W. Leung, Int. J. Nanomed., 2008, 3, 533–545 CAS.
- K. Peters, R. E. Unger, C. J. Kirkpatrick, A. M. Gatti and E. Monari, J. Mater. Sci.: Mater. Med., 2004, 15, 321–325 CrossRef CAS PubMed.
Footnote |
| † Electronic supplementary information (ESI) available. See DOI: 10.1039/c9ra02412c |
| This journal is © The Royal Society of Chemistry 2019 |

