 Open Access Article
New transition metal complexes with a pendent indole ring: insights into the antifungal activity and mode of action†
Ovas Ahmad Dara,
Shabir Ahmad Loneb,
Manzoor Ahmad Malika,
Mohmmad Younus Wani c,
Aijaz Ahmad
 *bd and
Athar Adil Hashmi*a
aDepartment of Chemistry, Jamia Millia Islamia, New Delhi 110025, India. E-mail: aah_ch@yahoo.co.in
bClinical Microbiology and Infectious Diseases, School of Pathology, Faculty of Health Sciences, University of the Witwatersrand, Johannesburg, 2193, South Africa. E-mail: aijaz.ahmad@wits.ac.za
cChemistry Department, Faculty of Science, University of Jeddah, P. O. Box 80327, Jeddah 21589, Kingdom of Saudi Arabia
dInfection Control, Charlotte Maxeke Johannesburg Academic Hospital, National Health Laboratory Service, Johannesburg, 2193, South Africa
First published on 14th May 2019
Abstract
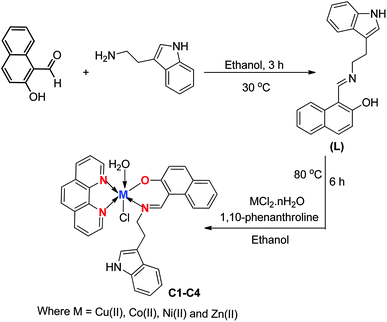
Development of new chemotherapeutic agents to treat multidrug-resistant fungal infections to augment the current treatment options is a must. In this direction, a series of mixed ligand complexes was synthesized from a Schiff base (L) obtained by the condensation of 2-hydroxynapthaldehyde and tryptamine, and 1,10-phenanthroline (1,10-phen) as a secondary ligand. Based on spectral characterization and physical measurements an octahedral geometry was assigned to [Co(phen)LClH2O] (C2), [Ni(phen)LClH2O](C3), and [Zn(phen)LClH2O](C4) complexes while a distorted octahedral geometry was assigned to the [Cu(phen)LClH2O](C1) complex. All the synthesized compounds were tested for antifungal activity against 11 Candida albicans isolates, including fluconazole (FLC) resistant isolates, by determining minimum inhibitory concentrations and studying growth curves. MIC results suggest that all the newly synthesized compounds have potent antifungal activity at varying levels. The rapid action of these compounds on fungal cells suggested a membrane-located target for their action.
1. Introduction
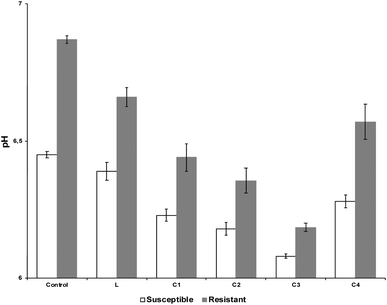
The emergence of drug resistance to almost all of the currently used antifungal medication necessitates the development of new treatment modalities and strategies.1,2 Fungal diseases kill more than 1.5 million and affect over a billion people worldwide.3,4 Among the various modalities that are being pursued, development of metallodrugs seems to be worthy; owing to the multiple pathways that a metallodrug could target to curb drug resistance.5–7 A metal complex usually shows better efficacy compared to the ligand or the metal ion alone, by sometimes, the ligands protecting or stabilizing the otherwise reactive metal ion or the metal undergoing redox events which enhances the overall efficacy of the complex and sometimes the metal and the ligand(s) are mutually responsible for the biological activity of the complex.8 Studies of the coordination chemistry of transition metal ions with several types of ligands have made big strides by the recent advancements in the fields of bioinorganic chemistry and medicine.9 Due to their astonishing structural properties and varied denticities, Schiff bases have received considerable attention for many years and these properties have resulted in their wide application in the clinical, biological, analytical and pharmaceutical fields.10–13 The coordination of transition metals to these scaffolds increases their biological activities and lowers the cytotoxicity of both metal and the ligand.14–16 Schiff base metal complexes are gaining considerable attention due to their potential antifungal, antitumor and antibacterial activities.17–20 Use of labile and auxiliary ligands like 1,10-phenenthroline, 2,2-bipyridyl, imidazole, and pyridine, on the other hand, have been demonstrated to show interesting biological profile with excellent antibacterial, antitumor, antiviral and antifungal activities already reported.21–25 A good number of mixed ligand complexes containing 1,10-phenanthroline as a ligand are identified as potential chemotherapeutic agents and have received much attention in the field of medicine.26–29In view of the promising biological activities of these scaffolds our main intention was to explore whether the incorporation of these important scaffolds in one complex would result in potentiation of activities and therefore would give a new strategy for the development of chemotherapeutic agents. Finding rare instances of literature about the tryptamine based Schiff base ligands and their mixed ligand complexes with 1,10-phenenthroline, bearing an indole ring pendent, we report the synthesis, characterization and antifungal activity of the ligand and its metal complexes. Insight studies into the mechanism of action were done by studying their effect on H+-ATPase pump, a promising target to develop new antifungal drugs because of its important role in fungal cell physiology to maintain electrochemical proton gradient which in turn is important for nutrient uptake. In addition, this enzyme also plays a crucial role to regulate intracellular pH and maintains cell growth. The enzyme has also been reported to play role in the pathogenicity of Candida by regulating the pathogenicity markers such as morphological transition and secretion of hydrolytic enzymes.
2. Experimental
2.1 Materials and methods
All the reagents and chemicals used for the synthesis were of analytical grade and were purchased from commercial sources. They were used as received without further purification. Tryptamine and 2-hydroxynepthaldehyde were purchased from Sigma Aldrich. 1,10-Phenanthroline and metal chlorides were purchased from Merck.Microanalyses (C, H and N) was carried out with FlashEA 1112 elemental analyzer (Thermo Scientific). The molar conductance at room temperature were measured on a Syntronics type 302 conductivity bridge equilibrated at 25 ± 0.01 °C. For conductivity measurements one millimolar solutions in DMSO were prepared. Electrothermal melting point apparatus was used to determine the melting point of the synthesized compounds. FT-IR spectra of the synthesized compounds were recorded using KBr pellets on a Perkin-Elmer 283 spectrophotometer. For 1H NMR and 13C NMR measurements Brucker WH 300 (200 MHz) and Brucker WH 270 (67.93 MHz) were used using CDCl3 or DMSO-d6 as a solvent and trimethylsilane as an internal standard. ESI-MS (AB-Sciex 2000, Applied Biosystem) was used to record mass spectra of the synthesized ligand and complexes.
2.2 Synthesis
Color (yellow) yield: 82%. mp 192 °C; elemental anal. calc. for C21H18N2O: C, 80.23; H, 5.77; N; 8.91; found: C, 79.57; H, 5.69; N, 9.46; IR (KBr Pellet, cm−1): 1618 ν(–CH![[double bond, length as m-dash]](https://www.rsc.org/images/entities/char_e001.gif) N–), 3152 ν(OH), 1264 ν(C–O), 3334 ν(NH), 1H NMR (CDCl3, δ, ppm) 8.25 (s, 1H, NH), 8.42 (s, 1H, CH
N–), 3152 ν(OH), 1264 ν(C–O), 3334 ν(NH), 1H NMR (CDCl3, δ, ppm) 8.25 (s, 1H, NH), 8.42 (s, 1H, CH![[double bond, length as m-dash]](https://www.rsc.org/images/entities/char_e001.gif) N), 14.2 (s, 1H, OH), 3.18 (t, 2H, CCH2), 3.89 (t, 2H, NCH2), 6.86–7.65 (m, 11H, ArH). 13C NMR (CDCl3, δ, ppm): 171.22 (C–O), 163.44 (C
N), 14.2 (s, 1H, OH), 3.18 (t, 2H, CCH2), 3.89 (t, 2H, NCH2), 6.86–7.65 (m, 11H, ArH). 13C NMR (CDCl3, δ, ppm): 171.22 (C–O), 163.44 (C![[double bond, length as m-dash]](https://www.rsc.org/images/entities/char_e001.gif) N), 58.25 (C–N), 27.37 (CH2–C), 111.99–138 (Ar C's), mass spectrum (ESI) [M + H]+ = 315.0.
N), 58.25 (C–N), 27.37 (CH2–C), 111.99–138 (Ar C's), mass spectrum (ESI) [M + H]+ = 315.0.
2.2.2.1 [Cu(phen)LClH2O] (C1). Color (yellow green) yield: 68%; mp: 252 °C; elemental anal. calc. for (C33H27ClCuN4O2): C, 64.91; H, 4.46; N, 9.18; found: C, 64.72; H, 4.87; N, 9.28; IR (KBr pellet, cm−1): 1582 ν(CH
![[double bond, length as m-dash]](https://www.rsc.org/images/entities/char_e001.gif) N), 1289 ν(C–Ophenol), 1178 ν(C–N1,10-phen), 3310 ν(N–H), 735 δ(C
N), 1289 ν(C–Ophenol), 1178 ν(C–N1,10-phen), 3310 ν(N–H), 735 δ(C![[double bond, length as m-dash]](https://www.rsc.org/images/entities/char_e001.gif) N1,10-phen), 3505 ν(OH), 520 ν(Cu–O), 478 ν(Cu–N). Mass spectrum (ESI) [M + H]+ = 609.5.
N1,10-phen), 3505 ν(OH), 520 ν(Cu–O), 478 ν(Cu–N). Mass spectrum (ESI) [M + H]+ = 609.5.
2.2.2.2 [Co(phen)LClH2O](C2). Color (brown) yield: 65%. mp: 242 °C; elemental anal. calc. for [C33H27ClCoN4O2]: C, 65.41; H, 4.49; N, 9.25; found: C, 65.20; H, 4.37; N, 9.18; IR (KBr pellet, cm−1): 1585 ν(CH
![[double bond, length as m-dash]](https://www.rsc.org/images/entities/char_e001.gif) N), 1289 ν(C–Ophenol), 1170 ν(C–N1,10-phen), 3320 ν(N–H), 728 δ(C
N), 1289 ν(C–Ophenol), 1170 ν(C–N1,10-phen), 3320 ν(N–H), 728 δ(C![[double bond, length as m-dash]](https://www.rsc.org/images/entities/char_e001.gif) N1,10-phen), 3510 ν(OH), 527 ν(Co–O), 476 ν(Co–N). Mass spectrum (ESI) [M + H]+ = 605.9.
N1,10-phen), 3510 ν(OH), 527 ν(Co–O), 476 ν(Co–N). Mass spectrum (ESI) [M + H]+ = 605.9.
2.2.2.3 [Ni(phen)LClH2O](C3). Color (reddish brown) yield: 69%; mp: 220 °C; elemental anal. calc. for [C33H27ClN4NiO2]: C, 65.43; H, 4.49; N, 9.25; found: C, 65.39; H, 4.52; N, 9.17; IR (KBr pellet, cm−1): 1585 ν(CH
![[double bond, length as m-dash]](https://www.rsc.org/images/entities/char_e001.gif) N), 1286 ν(C–Ophenol), 1178 ν(C–N1,10-phen), 3304 ν(N–H),3508 ν(OH), 730 δ(C
N), 1286 ν(C–Ophenol), 1178 ν(C–N1,10-phen), 3304 ν(N–H),3508 ν(OH), 730 δ(C![[double bond, length as m-dash]](https://www.rsc.org/images/entities/char_e001.gif) N1,10-phen), 524 ν(Ni–O), 478 ν(Ni–N). Mass spectrum (ESI) [M + H]+ = 605.5.
N1,10-phen), 524 ν(Ni–O), 478 ν(Ni–N). Mass spectrum (ESI) [M + H]+ = 605.5.
2.2.2.4 [Zn(phen)LClH2O](C4). Color (beige) yield: 70%; mp: 222 °C; elemental anal. calc. for [C33H27ClN4O2Zn]: C, 64.71; H, 4.43; N, 9.15; found: C, 64.52; H, 4.88; N, 9.10; IR (KBr pellet, cm−1): 1590 ν(CH
![[double bond, length as m-dash]](https://www.rsc.org/images/entities/char_e001.gif) N), 1288 ν(C–Ophenol), 1176 ν(C–N1,10-phen), 3312 ν(N–H), 729 δ(C
N), 1288 ν(C–Ophenol), 1176 ν(C–N1,10-phen), 3312 ν(N–H), 729 δ(C![[double bond, length as m-dash]](https://www.rsc.org/images/entities/char_e001.gif) N1,10-phen), 3507 ν(OH), 530 ν(Zn–O), 480 ν(Zn–N).1H NMR (DMSO-d6, δ, ppm), 10.75 (s, 1H, NH), 8.53 (s, 1H, CH
N1,10-phen), 3507 ν(OH), 530 ν(Zn–O), 480 ν(Zn–N).1H NMR (DMSO-d6, δ, ppm), 10.75 (s, 1H, NH), 8.53 (s, 1H, CH![[double bond, length as m-dash]](https://www.rsc.org/images/entities/char_e001.gif) N), 8.39 (s, 2H, CH
N), 8.39 (s, 2H, CH![[double bond, length as m-dash]](https://www.rsc.org/images/entities/char_e001.gif) N1,10-phen), 3.30 (t, 2H, CCH2), 3.92 (t, 2H, NCH2), 3.57 (s, 2H, H2O), 6.51–8.19 (m, 18H, ArH). 13C NMR (DMSO-d6, δ(ppm)): 172.26 (C–O), 164.10 (CH
N1,10-phen), 3.30 (t, 2H, CCH2), 3.92 (t, 2H, NCH2), 3.57 (s, 2H, H2O), 6.51–8.19 (m, 18H, ArH). 13C NMR (DMSO-d6, δ(ppm)): 172.26 (C–O), 164.10 (CH![[double bond, length as m-dash]](https://www.rsc.org/images/entities/char_e001.gif) N), 149.83 (CH
N), 149.83 (CH![[double bond, length as m-dash]](https://www.rsc.org/images/entities/char_e001.gif) N1,10-phen), 60.28 (N–CH2), 28.06 (CH2–C), 146.47 (C–N), 107.93–136.69 (Ar C's), mass spectrum (ESI) [M + H]+ = 611.4.
N1,10-phen), 60.28 (N–CH2), 28.06 (CH2–C), 146.47 (C–N), 107.93–136.69 (Ar C's), mass spectrum (ESI) [M + H]+ = 611.4.
2.3 Microbiological analysis
2.3.2.1 Determination of minimum inhibitory concentrations. To determine the antifungal activity of the newly synthesized ligand (L) and its four mixed ligand complexes (C1–C4), Minimum Inhibitory Concentrations (MIC) were determined against tested FLC susceptible and FLC resistant C. albicans isolates by serial micro-broth dilution method following Clinical and Laboratory Standards Institute (CLSI) recommended guidelines M27-A3,30 with modifications. Briefly, microtiter plates were prepared by adding 100 μL of SD broth into each of the wells followed by an addition of the test substance at a volume of 100 μL in the first column with an initial concentration of 1000 μg mL−1. The test compounds were serially diluted to yield a final concentration of 250, 125, 62.5, 31.25, 16, 8, 4, 2, 1, 0.5, 0.25 and 0.12 μg mL−1. The positive control FLC (2000 μg mL−1) and the negative vehicle control (1% DMSO) were also included in every set of experiments. Media and culture controls were included to confirm the sterility and viability, respectively. Following serial dilution, test organisms with an approximate final inoculum size of 1 × 10⁶ colony forming units (CFU) per mL, were then added to each well, at a volume of 100 μL. The microtiter plates were sealed and incubated under 37 °C for 24 h. After incubation, 400 μg mL−1 of p-iodonitrotetrazolium violet solution (INT) was added to each well (40 μL). Viable micro-organisms interact with INT to create a colour change from clear to a red-purple colour. Thus, the lowest dilution with no colour change was considered as the MIC for that test compound. All the results were calculated as a mean of the experiments done in duplicate and all the results were expressed in μg mL−1.
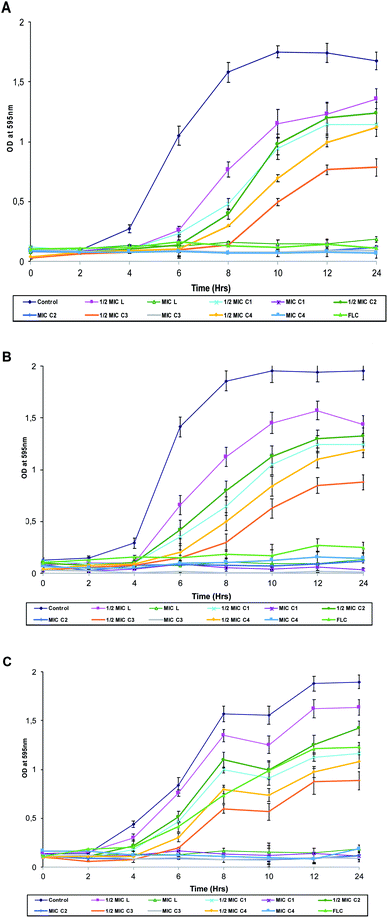
2.3.2.2 Growth studies. To further confirm the antifungal activity of the test compounds, growth curve studies were performed as described previously.31 Prior to the experiment, all Candida species were sub-cultured and 50 μL (1 × 10⁶ CFU mL−1) were added to 50 mL SD broth. To test the effect of the compounds under study, MIC and ½MIC of these compounds were added to the respective tubes. All the tubes including control (no test compound) were incubated at 37 °C with agitation. At a pre-determined time (0, 2, 4, 6, and 24 h), 2 mL aliquots were taken and growth was followed turbidometrically at 595 nm using Shimadzu UV-1800 spectrophotometer. Optical density was recorded for each concentration against time in hours. The growth rate is equivalent to the slope of log(optical density) versus time during the exponential phase. Average growth rate of untreated versus treated C. albicans were represented as line charts.
3. Results and discussion
3.1 Chemistry
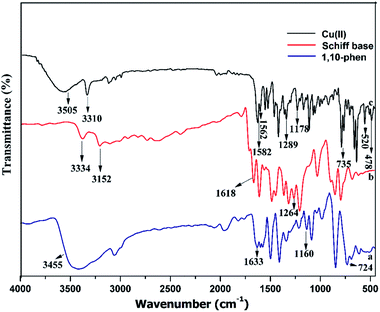
The mixed ligand complexes with an indole pendent were prepared by reacting equimolar amounts of the ligand, obtained by condensation of tryptamine with 2-hydroxynapthaldehyde and the corresponding metal salts, and 1,10-phenanthroline in presence of triethylamine. All the resulting metal complexes were neutral, colored, air stable and remarkably soluble in DMF and DMSO. The ligand and metal complexes were analyzed using various physico-chemical properties like melting point, yield, color, elemental analysis and conductivity measurements as reported in Table 1. The molar conductivity of the complexes was carried out using DMSO (10−3M) at room temperature. The results obtained were in the range of 18–27 Ω−1 cm2 m−1 which indicated their non-electrolytic nature. All the compounds were thoroughly characterized using various spectral techniques like FT-IR, NMR and mass spectrometry. The analytical data of the ligand and metal complexes were in good agreement with their proposed formula. The ESI MS of the Schiff base ligand (L) and complexes (C1–C4) in MeOH were recorded and found in good agreement with the calculated m/z values (Fig. S1–S5†). The FT-IR spectrum of the Schiff base ligand (L) displayed a strong band at 1618 cm−1 corresponding to ν(CH![[double bond, length as m-dash]](https://www.rsc.org/images/entities/char_e001.gif) N) of azomethine group. In complexes the azomethine (–CH
N) of azomethine group. In complexes the azomethine (–CH![[double bond, length as m-dash]](https://www.rsc.org/images/entities/char_e001.gif) N–) band got shifted to lower frequencies due to the withdrawal of electron density from the nitrogen atom indicating the coordination of CH
N–) band got shifted to lower frequencies due to the withdrawal of electron density from the nitrogen atom indicating the coordination of CH![[double bond, length as m-dash]](https://www.rsc.org/images/entities/char_e001.gif) N group to metal ions (Fig. 1).33 The band present in Schiff base (L) at 3152 cm−1 attributed to –OH stretching vibrations was absent in complexes due to deprotonation upon complexation.34 In complexes (C1–C4) the broad band at 3505–3510 cm−1 was attributed to ν(OH) of the coordinated water present in these complexes.18 In 1,10-phenanthroline the band at 1633 cm−1corresponds to pyridyl nitrogen stretching vibration and in complexes this band was shifted to lower frequencies which clearly indicate the coordination of two nitrogen atoms to metal ions upon complexation. The low frequency region of the spectra in complexes showed the presence of new bands in the region of 476–480 cm−1and 520–530 cm−1assigned to ν(M–N) and ν(M–O) stretching vibrations respectively (Fig. S6–S8†).35 In addition, further evidence for the formation of Schiff base (L) and C4 complex was obtained from the NMR spectra. The attained 1H and 13C NMR values of C4 complex were compared with the corresponding ligand and were in good agreement with the proposed structure of the C4 complex. The 1H and 13C NMR spectra of the ligand and C4 complex have been given in ESI.† Complexes C1, C2 and C3 did not furnish good and presentable NMR spectra due to the paramagnetic nature of the complexes.
N group to metal ions (Fig. 1).33 The band present in Schiff base (L) at 3152 cm−1 attributed to –OH stretching vibrations was absent in complexes due to deprotonation upon complexation.34 In complexes (C1–C4) the broad band at 3505–3510 cm−1 was attributed to ν(OH) of the coordinated water present in these complexes.18 In 1,10-phenanthroline the band at 1633 cm−1corresponds to pyridyl nitrogen stretching vibration and in complexes this band was shifted to lower frequencies which clearly indicate the coordination of two nitrogen atoms to metal ions upon complexation. The low frequency region of the spectra in complexes showed the presence of new bands in the region of 476–480 cm−1and 520–530 cm−1assigned to ν(M–N) and ν(M–O) stretching vibrations respectively (Fig. S6–S8†).35 In addition, further evidence for the formation of Schiff base (L) and C4 complex was obtained from the NMR spectra. The attained 1H and 13C NMR values of C4 complex were compared with the corresponding ligand and were in good agreement with the proposed structure of the C4 complex. The 1H and 13C NMR spectra of the ligand and C4 complex have been given in ESI.† Complexes C1, C2 and C3 did not furnish good and presentable NMR spectra due to the paramagnetic nature of the complexes.
| Compound | Color | Mol. formula | Mol. wt | (m/z) ratio | Yield (%) | Λm (Ω −1 cm2 mol−1) | Mp (°C) |
|---|---|---|---|---|---|---|---|
| L | Yellow | C21H17N2O | 313 | 315 | 82 | — | 192 |
| C1 | Yellow green | [C33H27ClCuN4O2] | 609.1 | 609.5 | 68 | 27 | 252 |
| C2 | Brown | [C33H27ClCoN4O2] | 605.1 | 605.9 | 65 | 19 | 242 |
| C3 | Reddish brown | [C33H27ClN4NiO2] | 604.1 | 605.5 | 69 | 18 | 220 |
| C4 | Beige | [C33H27ClN4O2Zn] | 610.1 | 611.4 | 70 | 20 | 222 |
3.2 Biological studies
| Strains | Minimum inhibitory concentrations (μg mL−1) | ||||||
|---|---|---|---|---|---|---|---|
| L | C1 | C2 | C3 | C4 | FLC | ||
| C. albicans SC5314 | 250 | 62.5 | 1 | 0.25 | 62.5 | 0.25 | |
| FLC susceptible strains | 4175 | 500 | 250 | 0.50 | 0.50 | 250 | 0.12 |
| 4179 | 500 | 250 | 2 | 0.50 | 250 | 0.25 | |
| 4180 | 250 | 62.5 | 2 | 0.50 | 125 | 0.25 | |
| 4251 | 125 | 125 | 1 | 0.25 | 125 | 0.25 | |
| 4554 | 500 | 250 | 2 | 0.50 | 250 | 0.25 | |
| 4563 | 125 | 62.5 | 0.50 | 0.25 | 62.5 | 0.25 | |
| 4576 | 250 | 250 | 2 | 0.50 | 250 | 0.25 | |
| FLC resistant strains | 4085 | 250 | 125 | 4 | 0.5 | 125 | 16 |
| 4122 | 500 | 250 | 8 | 1 | 250 | 32 | |
| 4135 | 500 | 250 | 8 | 0.5 | 250 | 32 | |
4. Conclusions
A series of metal complexes obtained from a Schiff base bidentate ligand and 1,10-phenenthroline as a co-ligand was obtained, structurally characterized and evaluated for their antifungal potential. Based on various physical and spectroscopic techniques octahedral geometry was assigned to C2, C3 and C4 complexes while as distorted octahedral geometry was assigned to C1 complex. Evaluation of the antifungal potential against both resistant and susceptible Candida albicans showed that these complexes have a great potential to lead as antifungal agents; C3 being the most active against the resistant strains. The collection of results presented herein are especially useful in antifungal drug development targeting proton pumping ATPase pump. The results of this study revealed that these complexes have a targeted activity, although, other modes of action cannot be ruled out because metal complexes are known to target multiple pathways to evade drug resistance.Conflicts of interest
The authors declare that they have no competing interests.Acknowledgements
The author OAD is thankful to University Grants Commission (UGC), Government of India for financial assistance through Central University PhD Students Fellowship. AA acknowledges financial support from University Research Committee Grant for 2019 – Friedel Sellschop Award (Grant No: AZMD019).References
- N. Wiederhold, Infect. Drug Resist., 2017, 10, 249–259 CrossRef CAS PubMed.
- M. C. Fisher, N. J. Hawkins, D. Sanglard and S. J. Gurr, Science, 2018, 360, 739–742 CrossRef CAS PubMed.
- D. W. Denning, Philos. Trans. R. Soc., B, 2016, 371, 20150468 CrossRef PubMed.
- M. A. Pfaller, D. J. Diekema, D. L. Gibbs, V. A. Newell, J. F. Meis, I. M. Gould, W. Fu, A. L. Colombo and E. Rodriguez-Noriega, J. Clin. Microbiol., 2007, 45, 1735–1745 CrossRef CAS PubMed.
- K. D. Mjos and C. Orvig, Chem. Rev., 2014, 114, 4540–4563 CrossRef CAS PubMed.
- Y. C. Ong, S. Roy, P. C. Andrews and G. Gasser, Chem. Rev., 2019, 119, 730–796 CrossRef CAS PubMed.
- M. Zaki, F. Arjmand and S. Tabassum, Inorg. Chim. Acta, 2016, 444, 1–22 CrossRef CAS.
- K. J. Kilpin and P. J. Dyson, Chem. Sci., 2013, 4, 1410 RSC.
- S. A. Hosseini-Yazdi, P. Samadzadeh-Aghdam, A. Mirzaahmadi, A. A. Khandar, G. Mahmoudi, M. Ruck, T. Doert, S. S. Balula and L. Cunha-Silva, Polyhedron, 2014, 80, 41–46 CrossRef CAS.
- L. Li, Q. Guo, J. Dong, T. Xu and J. Li, J. Photochem. Photobiol., B, 2013, 125, 56–62 CrossRef CAS PubMed.
- N. Shahabadi, S. Kashanian and F. Darabi, Eur. J. Med. Chem., 2010, 45, 4239–4245 CrossRef CAS PubMed.
- S. Kathiresan, S. Mugesh, J. Annaraj and M. Murugan, New J. Chem., 2017, 41, 1267–1283 RSC.
- A. Palanimurugan and A. Kulandaisamy, J. Organomet. Chem., 2018, 861, 263–274 CrossRef CAS.
- Z. Travnıicek, M. Malon, Z. Sindelar, K. Dolezal, J. Rolcík, V. Krystof, M. Strnad and J. Marek, J. Inorg. Biochem., 2001, 84, 23–32 CrossRef.
- P. Tyagi, M. Tyagi, S. Agrawal, S. Chandra, H. Ojha and M. Pathak, Spectrochim. Acta, Part A, 2017, 171, 246–257 CrossRef CAS PubMed.
- M. A. Malik, O. A. Dar, P. Gull, M. Y. Wani and A. A. Hashmi, MedChemComm, 2018, 9, 409–436 RSC.
- I. M. Mustafa, M. A. Hapipah, M. A. Abdulla and T. R. Ward, Polyhedron, 2009, 28, 3993–3998 CrossRef CAS.
- A. A. S. Al-Hamdani and W. Al Zoubi, Spectrochim. Acta, Part A, 2015, 137, 75–89 CrossRef CAS PubMed.
- M. Ibrahim, H. Ali, M. Abdullah and P. Hassandarvish, Molecules, 2012, 17, 12449–12459 CrossRef CAS PubMed.
- J. Ki, A. Mukherjee, S. Rangasamy, B. Purushothaman and J. M. Song, RSC Adv., 2016, 6, 57530–57539 RSC.
- C. M. Sharaby, M. F. Amine and A. A. Hamed, J. Mol. Struct., 2017, 1134, 208–216 CrossRef CAS.
- J. Dutta, S. Datta, D. Kumar Seth and S. Bhattacharya, RSC Adv., 2012, 2, 11751 RSC.
- Z. A. Siddiqi, M. Khalid, S. Kumar, M. Shahid and S. Noor, Eur. J. Med. Chem., 2010, 45, 264–269 CrossRef CAS PubMed.
- Y. Prashanthi, K. Kiranmai, Ira, S. K. kumar, V. kumar Chityala and Shivaraj, Bioinorg. Chem. Appl., 2012, 2012, 1–8 CrossRef PubMed.
- M. Aljahdali and A. A. EL-Sherif, Inorg. Chim. Acta, 2013, 407, 58–68 CrossRef CAS.
- S. I. Mostafa, Transition Met. Chem., 2007, 32, 769–775 CrossRef CAS.
- H. F. Abd El-Halim, G. G. Mohamed and E. A. M. Khalil, J. Mol. Struct., 2017, 1146, 153–163 CrossRef CAS.
- W. H. Mahmoud, G. G. Mohamed and S. Y. A. Mohamedin, J. Therm. Anal. Calorim., 2017, 130, 2167–2184 CrossRef CAS.
- S. Baskaran, M. Murali Krishnan and M. N. Arumugham, Inorg. Nano-Met. Chem., 2017, 47, 269–277 CrossRef CAS.
- CLSI, Clinical and Laboratory Standards Institute Reference method for broth dilution antifungal susceptibility testing of yeast, Approved Standard M27-A3, Wayne, PA, USA, 2008, p. 40 Search PubMed.
- A. Khan, A. Ahmad, N. Manzoor and L. A. Khan, Nat. Prod. Commun., 2010, 5, 345–349 CAS.
- A. Ahmad, A. Khan, S. Yousuf, L. A. Khan and N. Manzoor, Fitoterapia, 2010, 81, 1157–1162 CrossRef CAS PubMed.
- M. A. Malik, M. K. Raza, O. A. Dar, Amadudin, M. Abid, M. Y. Wani, A. S. Al-Bogami and A. A. Hashmi, Bioorg. Chem., 2019, 87, 773–782 CrossRef CAS PubMed.
- M. M. Abo-Aly, A. M. Salem, M. A. Sayed and A. A. Abdel Aziz, Spectrochim. Acta, Part A, 2015, 136, 993–1000 CrossRef CAS PubMed.
- W. H. Mahmoud, N. F. Mahmoud and G. G. Mohamed, J. Organomet. Chem., 2017, 848, 288–301 CrossRef CAS.
- Y. Jia and J. Li, Chem. Rev., 2015, 115, 1597–1621 CrossRef CAS PubMed.
- Clinical and Laboratory Standards Institute (CLSI), Reference method for broth dilution antifungal susceptibility testing of yeasts, Wayne, 2012, document M27-S4 Search PubMed.
- Z. Shokohi-pour, H. Chiniforoshan, A. A. Momtazi-borojeni and B. Notash, J. Photochem. Photobiol., B, 2016, 162, 34–44 CrossRef CAS PubMed.
Footnote |
| † Electronic supplementary information (ESI) available. See DOI: 10.1039/c9ra02600b |
| This journal is © The Royal Society of Chemistry 2019 |


