DOI:
10.1039/C9RA02648G
(Paper)
RSC Adv., 2019,
9, 23560-23569
Synergistic effect of Pd content and polyelectrolyte multilayer structure on nitrobenzene hydrogenation in a microreactor
Received
9th April 2019
, Accepted 25th July 2019
First published on 30th July 2019
Abstract
In this study, we proposed a Pd–polyelectrolyte multilayer (PEM) hybrid film grafted on the polydopamine coated interior wall of a microreactor for nitrobenzene hydrogenation. Here, Pd nanoparticles were in situ synthesized in the PEMs consisting of poly(diallyldimethylammonium chloride) and poly(styrene sulfonate) via a two-stage ion-exchange and reduction process. The preparation process was monitored by UV-vis spectroscopy, which confirmed the formation of Pd in the PEM film. In addition, SEM and ICP-OES results indicated that the Pd content in the PEM film could be controlled by the number of the ion exchange and reduction cycles. Experimental results also showed that the prepared Pd–PEM hybrid film was active for the hydrogenation of nitrobenzene. The microreactor with the Pd–PEM hybrid film via multiple times had the increased catalyst loading, leading to a high yield of aniline and much better durability. In addition, it was also found that the NaCl concentration in the polyelectrolyte solution could affect the structure of the PEM film and therefore the Pd loading and catalytic performance.
1. Introduction
In the past few decades, microreactors have aroused considerable attention due to their inherent merits of high specific surface area, efficient mass and heat transfer performance and excellent operating safety.1–6 To increase the rate of the desired reaction,7 the catalyst preparation becomes significantly important. Unlike the catalysts suspended in microreactors, the deposition of catalyst on the interior microreactor walls can reduce catalyst waste and avoid potential blockage of the microchannel and catalyst recycling. Therefore, immobilizing catalysts onto the inner walls of microreactors is crucial for the development of the microreactor technology and has attracted widespread attention.8 In practical applications, metal nanoparticles have long been used as catalysts because of their inherently high activity and/or selectivity for numerous chemical reactions.9 To efficiently use catalytically active components and inhibit the agglomeration of metal nanoparticles, metal nanoparticles with fine dispersion are also immobilized on different support materials.10,11 However, depositing support materials on the inner walls of microreactors usually requires surface functionalization to strengthen the adhesive force between the support materials and substrate.12 Most methods involve rather harsh conditions that will break surface bonds under the influence of radiation, reactive radicals and aggressive reagents.13 Hence, a facile and simple method to facilitate simultaneous support material preparation and metal nanocatalyst synthesis is essential to promote the practical applications of microreactor technologies.
Previous studies14–17 have shown that polyelectrolyte multilayer (PEM) films, formed by an electrostatic assembly with a charged polyelectrolyte through a layer-by-layer mode, can be an efficient support for metal nanoparticles. Their composition and thickness can be manipulated conveniently by polyelectrolyte type and concentration, polyelectrolyte layer number, salt type and concentration, as well as the pH of polyelectrolyte solution in the presence of a weak polyelectrolyte. Meanwhile, since the procedure for preparing PEM film on the substrate only involves the simple repetition of the immersion step for the alternating the formation of anionic and cationic polyelectrolyte layers, it is not restricted by the geometry of the substrate. Furthermore, the inherent surface charges of the PEM film can pre-concentrate the metal ions through electrostatic interactions and then be used to anchor nanoparticles that are subsequently in situ reduced. In addition, the permeability of reactants/products in the PEM film can be regulated by adjusting the preparation parameters to improve the catalyst utilization. These properties make the PEM promising for catalyst preparation in a microreactor. To date, PEM film immobilized on the interior surfaces of microreactors has been broadly applied to various fields.18–20 Various metal nanoparticles, such as Au, Ag, Pt and Pd and their alloy nanoparticles, which were in situ synthesized on PEMs deposited on various substrates used for catalytic applications, have been reported.8,21–24 However, there have been few reports on in situ synthesis of metal nanoparticles on the PEM film deposited on the inner wall of a microreactor. In particular, the effects of polyelectrolyte layer number and salt concentration on metal loading and distribution and the structure of the catalyst layer have not been reported.
The goal of this paper is to design a series of Pd nanocatalysts supported by the multi-layered PEM film for the hydrogenation of nitrobenzene to aniline. In this study, we prepared Pd nanoparticles by ion-exchange/reduction in situ over PEM film comprised of poly(diallyldimethylammonium chloride), i.e., PDDA, and poly(styrene sulfonate), i.e., PSS, which was formed by the layer-by-layer (LbL) self-assembly method. PdCl42− complex ions serving as a precursor of Pd nanoparticles were bound to the PEM film using an ion-exchange method. Lastly, a strong reducing agent, NaBH4, was used to synthesize Pd nanoparticles. The size and content of Pd nanoparticles dispersed in the PEMs were readily controlled, and the catalytic activity and long-term stability for nitrobenzene hydrogenation were evaluated.
2. Experimental section
2.1 Chemical and materials
Dopamine hydrochloride, poly(sodium styrene sulfonate) (PSS, 30 wt% in water, MW ∼ 70![[thin space (1/6-em)]](https://www.rsc.org/images/entities/char_2009.gif) 000) and poly(diallyldimethylammonium chloride) (PDDA, 20 wt% in water, MW 200
000) and poly(diallyldimethylammonium chloride) (PDDA, 20 wt% in water, MW 200![[thin space (1/6-em)]](https://www.rsc.org/images/entities/char_2009.gif) 000–350
000–350![[thin space (1/6-em)]](https://www.rsc.org/images/entities/char_2009.gif) 000) were employed for preparing the polydopamine (PDA) coating, PSS layer and PDDA layer, respectively. All were purchased from Sigma-Aldrich. The buffer and reducing agents of the Tris (tris(hydroxymethyl)aminomethane) and sodium borohydride (NaBH4) were acquired from Sigma-Aldrich. Palladium chloride (PdCl2) used for the preparation of the Pd nanocatalysts was obtained from Sino-Platinum Metals Co. LTD (Kunming, China). The liquid reactant of nitrobenzene was supplied by Aladdin. All chemicals were analytical grade and used as received. Water used throughout the experiments was achieved with an Ultrapure Water System (resistivity ∼ 18.2 MΩ cm, Hitech, Smart-S15UVF, Shanghai, China). A commercial PTFE capillary tube with an inner diameter of 0.6 mm, an outer diameter of 1.0 mm and a length of 55.0 cm was used to fabricate the micro-reactors.
000) were employed for preparing the polydopamine (PDA) coating, PSS layer and PDDA layer, respectively. All were purchased from Sigma-Aldrich. The buffer and reducing agents of the Tris (tris(hydroxymethyl)aminomethane) and sodium borohydride (NaBH4) were acquired from Sigma-Aldrich. Palladium chloride (PdCl2) used for the preparation of the Pd nanocatalysts was obtained from Sino-Platinum Metals Co. LTD (Kunming, China). The liquid reactant of nitrobenzene was supplied by Aladdin. All chemicals were analytical grade and used as received. Water used throughout the experiments was achieved with an Ultrapure Water System (resistivity ∼ 18.2 MΩ cm, Hitech, Smart-S15UVF, Shanghai, China). A commercial PTFE capillary tube with an inner diameter of 0.6 mm, an outer diameter of 1.0 mm and a length of 55.0 cm was used to fabricate the micro-reactors.
2.2 In situ synthesis of the PEM-supported Pd nanoparticles
Fig. 1 schematically illustrates the processes for catalyst layer preparation in the microreactor. Since the charged surface of the pristine interior wall is required to complete surface charge inversion and facilitate the assembly of the polyelectrolyte layers, the modification of the microreactor inner wall with a PDA coating, which can provide ideal charged surfaces for the subsequent polyelectrolyte graft, was conducted prior to PEM deposition.25–28 In detail, dopamine hydrochloride solution (2.0 mg mL−1 in 10 mM Tris buffer at pH 8.5) was pumped into the PTFE capillary tube at a flow rate of 1 mL h−1 for 12 h, and then deionized water was injected into the modified PTFE capillary tube to remove the residual. Because the amine and catechol functional groups of PDA can present zwitterionic properties, the PDA coating can then provide a pathway to adhere the PEM film onto the internal wall of the microreactor by electrostatic attraction.25–28 During the LbL self-assembly, PSS (2.0 mg mL−1) and PDDA (2.0 mg mL−1) aqueous solutions were sequentially pumped into the PDA-coated capillary tube at a flow rate of 1.2 mL h−1 for 0.5 h, which was followed by washing the modified PTFE tube with sufficient deionized water at a flow rate of 2.4 mL h−1 for 0.5 h between each deposition step to remove excess polymer and salt. All polyelectrolyte solutions contained 1.0 M NaCl unless indicated otherwise.
 |
| | Fig. 1 Schematic illustration of the catalyst layer preparation process. | |
For the Pd catalyst deposition, H2PdCl4 solution (5.0 mM) was pumped into the PEM film coated PTFE capillary tube at a flow rate of 0.3 mL h−1 for 1 h; then, the capillary tube was thoroughly rinsed with deionized water to remove residual ions. Finally, a freshly prepared aqueous solution of NaBH4 (10.0 mM) was pumped into the capillary tube at a flow rate of 2.4 mL h−1 for 1 h to reduce the PdCl42− complex ions to Pd nanoparticles, followed by rinsing with deionized water at a flow rate of 2.4 mL h−1 for 0.5 h. The resultant hybrid film is denoted as (PSS–PDDA)m–Pdn, where m corresponds to the number of PSS–PDDA bilayer and n corresponds to the number of ion-exchange and reduction cycle.
2.3 Characterization
X-ray photoelectron spectroscopy (XPS) characterization was performed on a Thermo-Electron ESCALAB 250 spectrometer (Thermo, USA) using Al Kα (1486.6 eV) radiation as the X-ray source for excitation. Inductively coupled plasma-optical emission spectroscopy (ICP-OES) (ICP-OES 730, Agilent, USA) was employed to verify the exact Pd catalyst loading in the microreactor. The morphologies of the Pd nanocatalyst coated on the surface of microreactor were analysed by using a field emission scanning electron microscope (FESEM, Zeiss Sigma 500, Carl Zeiss Group, Germany). Prior to the observation, all the samples were coated by gold. The element distributions of the samples were characterized by the energy dispersive X-ray spectrometer (Bruker AXS, Karlsruhe, Germany). Besides, to more clearly characterize the PEMs containing Pd nanoparticles, we also prepared the PEMs containing Pd nanoparticles deposited on quartz slides, whose UV-vis spectra were acquired by a T6-1650E spectrometer (Persee, China). High-resolution TEM (HRTEM) images were recorded with a field-emission transmission electron microscope (JEOL, JME-2100F) operated at an accelerating voltage of 200 kV.
2.4 Nitrobenzene hydrogenation
In this work, nitrobenzene hydrogenation was used as a probe reaction to characterize the catalytic performance of the microreactor with the prepared catalyst layer, and the reaction was operated at room temperature and under an atmospheric pressure of 0.1 MPa. During the experiment, nitrobenzene solution with a concentration of 60.0 mM and high-purity H2 were respectively used as the liquid and gas reactants and continuously fed into the microreactor through a homemade T-connector. The flow rates of the liquid and gas phases were respectively controlled by a syringe pump (LSP01-2A, Longer-Pump, China) and a mass-flow controller (FMA-2602A-1, Omega, USA). Considering that the Taylor flow has the suitable gas and liquid flow rate ratio, which can avoid insufficient H2 gas in the case of bubbly flow and excess H2 gas in the case of annular flow,29 the liquid and gas flow rates for the whole experiment were respectively set at 15 μL min−1 and 0.15 sccm. The effluent was collected every 1 h to detect the concentrations of the reactants and products using a gas chromatograph (7890B, Agilent, USA) equipped with HP-5 capillary column and FID. The yield of the desired product of aniline was calculated based on eqn (1),| |
 | (1) |
where Cnb is the inlet nitrobenzene concentration and Can denotes the aniline concentration in the collected efflux.
3. Results and discussion
3.1 Materials characterization
Since the catalyst deposition in the microreactor is closely related to the polyelectrolyte layers, the characterization of PEM film formed via the LbL self-assembly of PSS and PDDA on the PDA modified interior wall of microreactors is discussed. To verify that the anion polyelectrolyte of PSS and the cation polyelectrolyte of PDDA can be alternately assembled in the microreactor, the UV-vis measurement was first performed based on the variation in the sulfonate group intensity corresponding to different numbers of PSS–PDDA bilayer. Fig. 2a shows the relationship between the number of the PSS–PDDA bilayer and the UV-vis absorption of PSS and PDDA and Fig. 2b shows the dependence of the absorbance at 228 nm on the number of the PSS–PDDA bilayer. Results show that the absorbance intensity at 228 nm, corresponding to sulfonate groups of the PSS, was gradually intensified as the number of assembly layer increased, indicating that the multilayered PSS–PDDA was successfully adsorbed onto the PDA. To further examine the surface chemical composition, X-ray photoelectron spectroscopy (XPS) measurements were performed for the (PDDA–PSS)/PDA samples with and without the ion-exchange process, i.e., the precursor ions adsorption, over the range of 100–800 eV. The survey spectrum in Fig. 3 shows that five elements including S, C, O, N and F co-existed in the (PDDA–PSS)/PDA film (green line). O peaks were attributed to the PSS and PDA, and the S peak was attributed to the PSS, and the N peak belonged to the PDDA and PDA and the F peak pertained to the PTFE capillary; but the detected Cl has a very weak peak. This is mainly because there are some quaternary amine groups at the surface of the PDDA with Cl− ions in the assembly process, although the charges on the PSS and PDDA were balanced with each other quantitatively in the multi-layered structure. However, due to the interpenetration of the PSS and PDDA chains in the assembly, the PEMs can be considered as a mixture surface with components of both the PSS and PDDA layers, i.e., the surface is not completely covered by Cl− ions. This is especially true when there is only one bilayer of PSS–PDDA. Thus, there is a very weak Cl element peak in the PEM film before the ion-exchange process. However, after the ion exchange process with the PdCl42− complex ions, except for the Pd element peak, the Cl element peaks also appeared (red line). Actually, during the ion-exchange process, two ammonium units in PDDA are needed to anchor one PdCl42− complex ion to maintain the charge balance, resulting in the introduction of two excess Cl atoms even though two counter Cl− ions in the PEMs were exchanged. Hence, the peak intensity of the Cl species was slightly intensified after the ion exchange process, which is similar to the investigation by Zhang et al.15
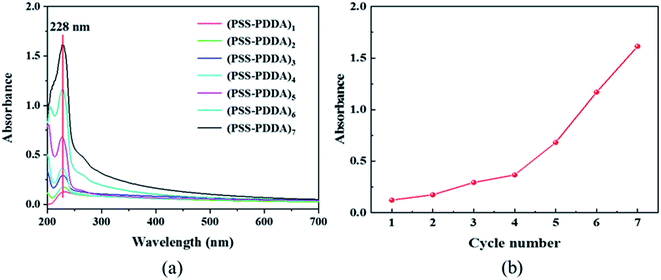 |
| | Fig. 2 (a) Cycle-dependent UV-vis absorption spectra of PSS–PDDA bilayer, (b) the dependence of the absorbance at 228 nm on the number of bilayer. | |
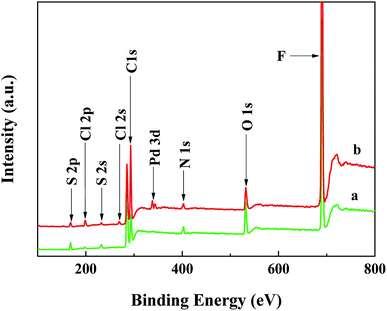 |
| | Fig. 3 XPS survey spectrum of the PEM film before (a) and after (b) supplying with H2PdCl4 solution. | |
3.2 In situ growth of Pd nanocatalyst
Because the Pd species adsorption on the PEMs is realized by counter ion exchange and the charged groups in PEMs can be recovered after the Pd precursor ions are reduced to the element state, the released groups then cause the PEMs to still possess ion-exchange capability. To clarify the growth process of the Pd catalyst on the PEMs, multiple ion-exchange and reduction cycles (IERCs) for the catalyst preparation were investigated. Fig. 4 shows the UV-vis spectra of Pd nanoparticles embedded in PEMs. For the PSS–PDDA film loaded with Pd nanoparticles, the surface plasmon resonance (SPR) peak emerges at 261 nm, confirming the formation of Pd nanoparticles in the PEM matrix. At the same time, it is also apparent that the intensity of the Pd nanoparticles gradually increased as the number of IERC increased. In addition, the mechanism of nanoparticle nucleation and growth is critical for the desired sizes and morphologies of the synthesized nanoparticles as well as some other physiochemical properties. When increasing the number of IERC, the previously formed Pd nanoparticles could be used as seeds to continuously adsorb PdCl42− complex ions, leading to the formation of large nanoparticles. Namely, the overall size of Pd nanoparticles can be controlled by varying the number of IERC. Subsequently, inductively coupled plasma-optical emission spectroscopy (ICP-OES 730, Agilent, USA) was further employed to verify the exact Pd catalyst loading in the microreactors. The results shown in Fig. 5 indicated that the Pd loading first increased dramatically from 15.37 ± 0.14 μg (one IERC) to 27.08 ± 0.01 μg (two IERCs), and then increased slightly from 27.08 ± 0.01 μg to 32.07 ± 1.65 μg (four IERCs). Due to the reduction of PdCl42−, the generated Pd nanoparticles allow some of the ammonium groups to be released, so that they can continue to be involved in ion exchange. However, a strong reducing agent, NaBH4, was used in all subsequent reductions so that the reduction of the PdCl42− ion not only occurred on existing Pd nanoparticles but also occurred on the quaternary amine groups, leading to the formation of new Pd nanoparticles. Hence, the amount of effective quaternary amine groups gradually decreased and the exchange ability was reduced. For these Pd nanoparticles, they were generated as seeds in the first reduction cycle, and the following reduction cycles resulted in sequential nanoparticle growth.
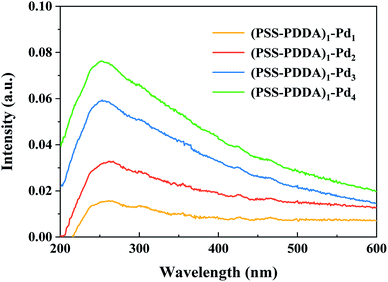 |
| | Fig. 4 UV-vis spectra of (PSS–PDDA)1 film containing Pd nanoparticles under different numbers of the ion-exchange and reduction cycle. | |
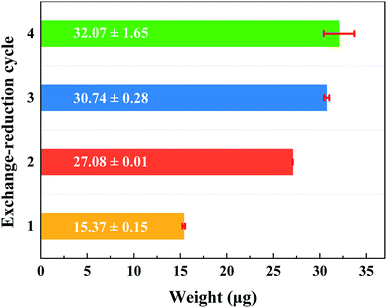 |
| | Fig. 5 The actual content of Pd for (PSS–PDDA)1 film containing Pd nanoparticles under different numbers of the ion-exchange and reduction cycle. | |
Fig. 6 shows the SEM and TEM characterization results of the samples with different IERCs. From Fig. 6a, it is observed that nanoparticles existed on the PEM film, and the dispersion was quite good. EDX element mapping of Pd is also provided (see Fig. 6b), which confirms that they are Pd nanoparticles. The Pd loadings obtained from EDX results are 20.94 wt%, 37.28 wt%, 46.92 wt% and 46.72 wt%, respectively, which are in good agreement with those from the ICP-OES data (Fig. 5). To determine the size of Pd nanoparticles, the TEM characterization was also performed. From the TEM images (Fig. 6c) and corresponding size distribution (Fig. 6d), it can be found that the size of Pd nanoparticles gradually increased with the number of ion-exchange and reduction cycle. The average Pd nanoparticles size increased from 2.2 ± 0.4 to 3.3 ± 0.5 nm as the cycle number increased from 1 to 4, indicating the correlation between Pd nanoparticle size and the number of IERC. Fig. 7 shows the TEM images of the (PSS–PDDA)1–Pd1 (Fig. 7a), (PSS–PDDA)3–Pd1 (Fig. 7c) and (PSS–PDDA)5–Pd1 (Fig. 7e) and their corresponding particle size distributions (Fig. 7b, d and f). The nanoparticle size distributions indicate that the average particle sizes are 2.2 ± 0.4 nm, 2.5 ± 0.3 nm and 2.7 ± 0.3 nm, respectively. Apparently, the obtained nanoparticle sizes are related to the number of PSS–PDDA bilayer. A larger number of PSS–PDDA leads to a larger particle size. This is because the Pd nanoparticle size is determined by the amount of exchanged PdCl42− complex ions.30
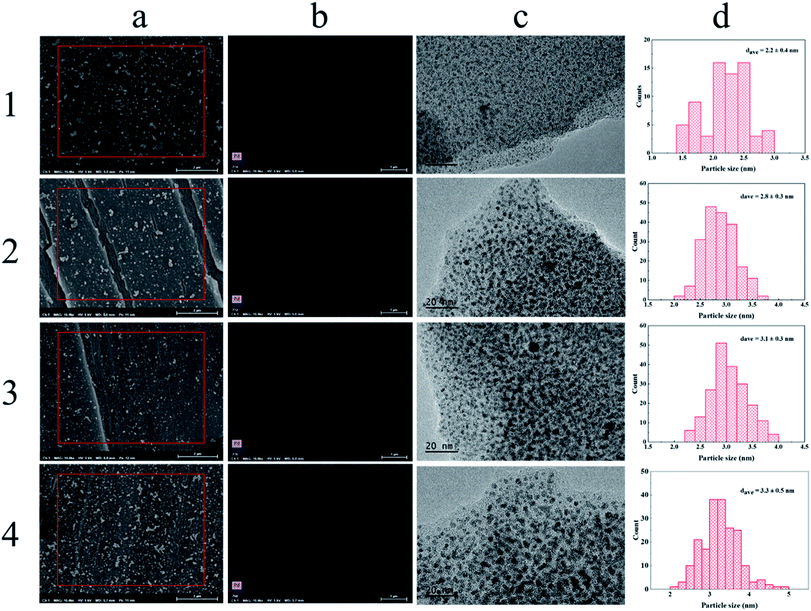 |
| | Fig. 6 (a) SEM images of (PSS–PDDA)1–Pd hybrid film, (b) EDX elemental mapping of Pd in the marked region, (c) TEM images of Pd nanoparticles and (d) corresponding size distribution. The number on the left represents the number of the ion-exchange and in situ reduction cycle. | |
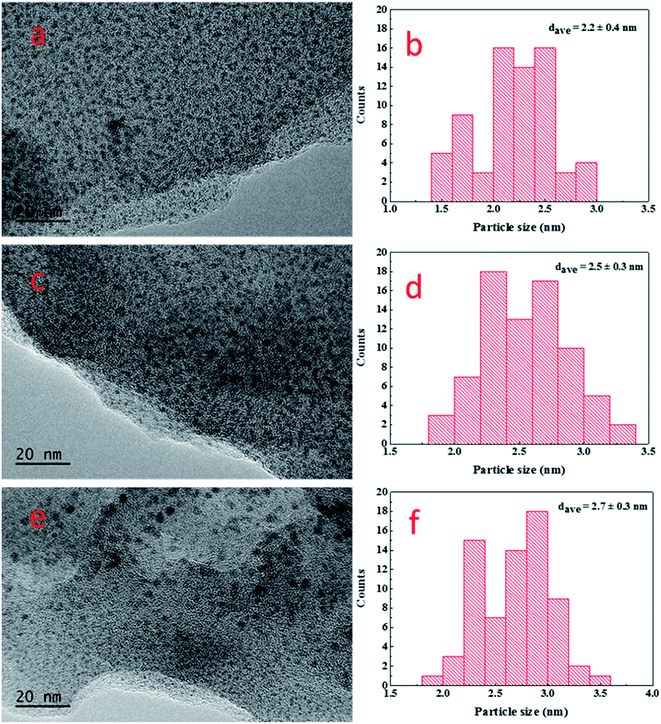 |
| | Fig. 7 TEM images and corresponding size distributions of (a) and (b) (PSS–PDDA)1–Pd1; (c) and (d) (PSS–PDDA)3–Pd1; (e) and (f) (PSS–PDDA)5–Pd1. | |
3.3 Catalytic performance evaluation
In this section, the catalytic activities of various Pd–PEM catalysts for nitrobenzene hydrogenation to aniline were examined in microreactors. Fig. 8 shows the catalytic performances of Pd catalysts prepared under different numbers of IERC. As shown in Fig. 8, the yield of aniline all reached 100% in the first hour, and the 100%-yield durability of the microreactor increased with the number of IERC. For (PSS–PDDA)1–Pd1, the yield was quickly decreased after the first hour. In the case of (PSS–PDDA)1–Pd2, the 100% yield was maintained for 6 h and then rapidly decreased. The increase in duration might be ascribed to increased loading of Pd nanocatalyst. Namely, the loading of Pd catalyst decisively affects the durability of the microreactor. In the case of (PSS–PDDA)1–Pd3, the duration of the microreactor with a high yield can be maintained for 8 h and then rapidly decrease. Obviously, the increase in durability of the microreactor is also associated with the increase of Pd catalyst loading from 27.08 ± 0.01 μg to 30.74 ± 0.28 μg, as shown in Fig. 5. However, after 4 cycles of ion-exchange and reduction, the durability of the microreactor had no clear improvement compared to the case of 3 IERCs because the catalyst loading was just slightly increased. This can be evidenced by the ICP-OES results, which revealed that the loading of the Pd catalyst increased from 30.74 ± 0.28 μg to 32.07 ± 1.65 μg when increasing the number of IERCs from 3 to 4. The agreement between ICP-OES results and the duration of the microreactor shows that the Pd content in the PEMs substantially influenced the duration of the microreactors. Based on these results, it is reasonable to infer that the Pd content in the hybrid films cannot allow a continuous and sharp increase because of the continuous consumption of exchangeable Cl− ions. Additionally, the formation of larger Pd nanoparticles will reduce the fraction of active surface area, and will subsequently decrease its catalytic activity. Moreover, existing nanoparticles will occupy a large proportion of the surface of the PEM film and shield the accessibility of the quaternary amine groups from incoming PdCl42− complex ions. Eventually, this will decrease the ion-exchange capacity. In this study, we also made comparison of the catalytic performance and durability between the microreactor with the (PSS–PDDA)1–Pd2 catalyst and reported data. As listed in Table 1, the aniline yield from this study was slightly higher than previous studies. However, because of the relatively low Pd loading and short residence time, the durability is lower than previous studies, suggesting that further optimization is needed in the future.
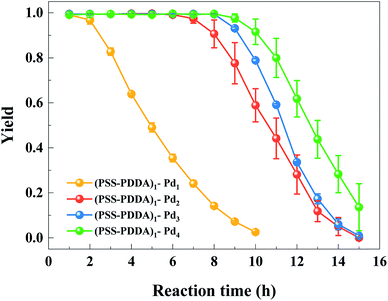 |
| | Fig. 8 The yield of nitrobenzene hydrogenation by microreactors with (PSS–PDDA)1–Pdn catalysts, n = 1, 2, 3 and 4. | |
Table 1 Comparison of the catalytic performance and durabilitya
| Entry |
Catalyst |
Load/μg |
Temperature/°C |
Cnb/mM |
t/s |
Yield (AN) |
Durability/h |
Ref. |
| Cnb: inlet nitrobenzene concentration; yield (AN): yield of aniline; t: residence time. Iso-propanol was used as the reaction solvent. |
| 1b |
Pt/TiO2 |
0.843 |
40 |
50 |
12 |
93% |
8 |
3 |
| 2 |
Pd film |
ca. 90 |
25 |
60 |
308 |
97.2% |
40 |
4 |
| 3 |
Pd film |
ca. 360 |
25 |
60 |
57 |
99% |
10 |
5 |
| 4 |
Pd film |
27.08 |
25 |
60 |
57 |
100% |
6 |
This work |
3.4 Effect of salt concentration
The PEM film thickness and composition highly depend on the preparation conditions. In the case of strong polyelectrolytes, the film properties can be controlled by changing the salt concentration of the polyelectrolyte solutions. Under salt-free or low-salt conditions, strong electrostatic interactions between PSS and PDDA leads to a stable and dense PEM film. At the same time, most ionized PSS and PDDA in the PEM film are partnered with each other, thereby leaving few binding sites available for subsequent ion-exchange. However, under certain conditions of high salt concentration, the change of the conformation of polyelectrolytes makes the adsorbed amount of polyelectrolyte increase and the adsorbed layer becomes thicker, resulting in the PEM film with a loose network. As a consequence, much more binding sites are compensated by the counter-ions rather than the oppositely charged polyelectrolyte, which then can be exchanged for the following PdCl42− complex ions. In contrast, when the NaCl concentration is higher than the critical salt concentration, the lower contact between PSS and PDDA leads to difficulty in binding them together, and thus the deposited amounts of PSS and PDDA decrease quickly.30,31 The principle is illustrated in Fig. 9. In this context, the relationship between the NaCl content in the assembly solution and the Pd content in the final Pd/PEM hybrid film can be verified by setting the number of bilayer as 5, denoted as (PSS–PDDA)5, and defining the capping layer as PDDA. The 5.0 mM H2PdCl4 solution was used to exchange with the Cl− ions for the in situ synthesis of Pd nanoparticles on/in the PEM film. Evidently, the Pd nanoparticles are dispersed randomly on the PEM film. Fig. 10 shows that the Pd content in the PEM is the lowest in the absence of salt contained in the assembly solutions. This is mainly because polyelectrolyte adsorbs onto the PDA surface, adopting very flat conformations; consequently, this results in more compact and fewer counter-ions films. In addition, it is also apparent that when the concentration of NaCl is greater than 1.0 M, the Pd content in the PEM gradually decreased, which is probably because the amount of PSS and PDDA deposited on the PDA surface decreased due to ion screening effects during the assembly process. Fig. 11 shows the variation in the yield of aniline under different NaCl concentrations as a function of reaction time. It was found that the yield of aniline in the first hour for all microreactors could not reach 100%. As can be seen from in Fig. 5, the PEMs comprised of 5 PSS–PDDA bilayers can increase the Pd content (19.72 ± 0.14 μg) compared to the 1 PSS–PDDA bilayer case (15.37 ± 0.14 μg). Even so, the yield of aniline in the first hour is still less than 100%. The reason is discussed in Section 3.5. In addition, it is apparent from Fig. 11 that from salt-free to 3.0 M NaCl in the assembly solution, the performance of the catalytic reaction shows a slight optimization trend due to the structure of the Pd–PEM hybrid film. Although the Pd content shows a decreasing trend after the concentration of NaCl exceeds 1.0 M, the different salt concentrations in the polyelectrolyte solution lead to a difference in the structure of PEMs, which may play a positive role in enhancing reactant transfer, and thus lead to a relatively high yield. All results confirm that both the Pd loading and the PEM structure can affect the yield of aniline. Furthermore, when the concentration of NaCl reached 4.0 M, because the external salt ion interactions between PSS and PDDA are weakened, the adsorbed amount of polyelectrolyte decreases. Although the formed PEM structure becomes relatively loose and benefits for reactants transfer, the loading of Pd catalysts decreases, leading to the decreased yield of aniline. This result is consistent with previous reports, which gave a critical concentration for the decomposition of PSS–PDDA multilayers at approximately 3.6 M.32,33
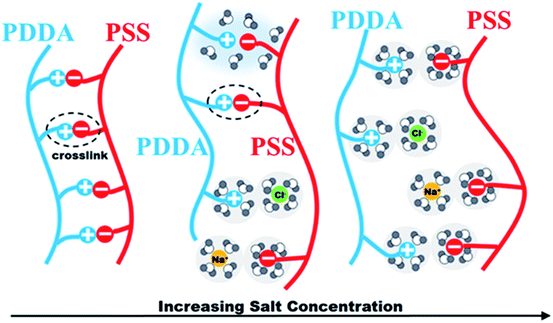 |
| | Fig. 9 Illustration of the assembly mechanisms under various salt concentrations. | |
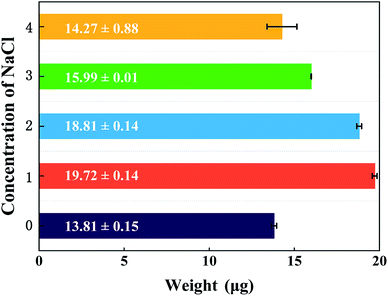 |
| | Fig. 10 The actual Pd loadings for the (PSS–PDDA)5 film containing Pd nanoparticles under different NaCl concentrations. | |
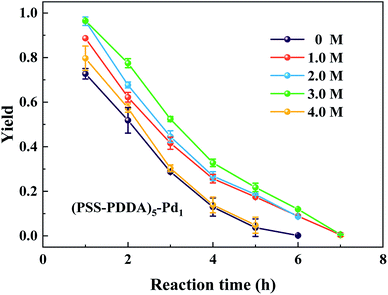 |
| | Fig. 11 Effect of the NaCl concentration on the aniline yield. | |
3.5 Effect of the number of PSS–PDDA bilayer
To study the catalytic performance of PEMs supported by a Pd nanocatalyst under different numbers of PSS–PDDA bilayer, three samples were prepared, i.e., (PSS–PDDA)1–Pd1, (PSS–PDDA)3–Pd1 and (PSS–PDDA)5–Pd1. Fig. 12 shows that the yield of aniline in the first hour was 99.1% for (PSS–PDDA)1–Pd1 and gradually deceased as a function of time. But the yield was only 90.9% for (PSS–PDDA)3–Pd1 and 88.7% for (PSS–PDDA)5–Pd1. Although the Pd content in the hybrid film increased with the number of PSS–PDDA bilayer, i.e., from 15.37 ± 0.14 μg to 16.98 ± 0.35 μg and up to 19.72 ± 0.14 μg, which corresponded to the number of PSS–PDDA bilayer from 1 to 3 and go on to 5, as shown in Fig. 13. The increment of Pd loading is very small, i.e., 1.61 and 2.74 μg, which may be ascribed to the dense structure of the PEM film, which blocks the PdCl42− complex ions diffusion pathway and thus allows ion-exchange and Cl− ion dispersion on surface layers. On the other hand, the PEMs composed of strong polyelectrolytes in the 1.0 M NaCl condition leads to a relatively small number of exchangeable Cl− ions, which is also responsible for the low loading of Pd nanocatalyst. Actually, to ensure catalytic activity, metal surface active sites must remain accessible to nitrobenzene molecules. However, a relatively thick Pd–PEM hybrid film could hinder the transport of the nitrobenzene molecules to the active sites of Pd nanoparticles embedded in the hybrid film. In other words, only the Pd nanoparticles on the surface of PEMs play an important role in the catalytic hydrogenation reaction, while it is difficult for those below the subsurface to have the opportunity to act as a catalyst. Besides, the Pd nanoparticle size gradually increases with the number of PSS–PDDA bilayer shown in Fig. 7, so that the decrease in active sites caused by the increased particle size is also a reason for the decrease of catalytic activity. Hence, the yield of aniline is limited by the following two factors: (1) low Pd loading affords less active sites, and (2) reactants encounter the diffusion limitation in the Pd–PEM hybrid film. In light of the aforementioned reasons, it can be interpreted that the deposition of multiple PSS–PDDA bilayers did not result in enhanced catalytic activity of Pd–PEM hybrid film, as only Pd nanoparticles within the outermost film layer retained their availability. As a consequence, both the Pd nanocatalysts content and the PEM film structure simultaneously influence catalytic activity.
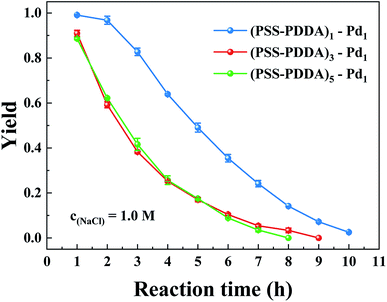 |
| | Fig. 12 Effect of the number of the PSS–PDDA bilayer on the aniline yield. | |
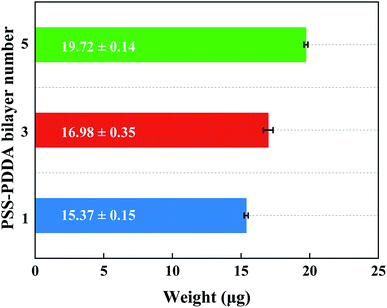 |
| | Fig. 13 Variation of the amount of Pd nanocatalyst in microreactor with the number of the PSS–PDDA bilayer. | |
4. Conclusions
In this work, the Pd–PEM hybrid films have been successful immobilized on the interior walls of microreactors using the LbL self-assembly and in situ reduction. The microreactors with the prepared hybrid films were evaluated by nitrobenzene hydrogenation, and exhibited effective catalytic performance. Results showed that the microreactor performance was predominated by the Pd catalyst loading and mass transfer. In the case of one PSS–PDDA bilayer, higher Pd loading can lead to better durability. But part of the Pd nanoparticles was embedded in the case of multilayered PSS–PDDA bilayers, diminishing the catalyst utilization. In addition, the influences of salt concentration and the number of bilayer on the aniline yield were investigated. The Pd loading and the structure of the hybrid film can be controlled by the salt concentration. It was found that there was a critical concentration, below which the aniline yield can be improved as the salt concentration increased. In addition, it was found that Pd nanoparticles were well dispersed on the surface of PEMs, facilitating nitrobenzene hydrogenation. The obtained results can provide more opportunities for the preparation of noble metal nanocatalysts in microreactors.
Conflicts of interest
There are no conflicts to declare.
Acknowledgements
The authors gratefully acknowledge the financial supports of National Natural Science Foundation of China (No. 51620105011, No. 51576021 and No. 51776026) and Fundamental Research Funds for the Central Universities (No. 2018CDXYDL0001).
References
- J. Kobayashi, Y. Mori, K. Okamoto, R. Akiyama, M. Ueno, T. Kitamori and S. Kobayashi, Science, 2004, 304, 1305–1308 CrossRef CAS PubMed.
- J. Kobayashi, Y. Mori and S. Kobayashi, Adv. Synth. Catal., 2005, 347, 1889–1892 CrossRef CAS.
- S. Kataoka, Y. Takeuchi, A. Harada, T. Takagi, Y. Takenaka, N. Fukaya, H. Yasuda, T. Ohmori and A. Endo, Appl. Catal., A, 2012, 427–428, 2919–2929 Search PubMed.
- H. Feng, X. Zhu, R. Chen, Q. Liao, J. Liu and L. Li, Chem. Eng. J., 2016, 36, 1017–1025 CrossRef.
- J. Liu, X. Zhu, Q. Liao, R. Chen, D. D. Ye, H. Feng, M. Liu and G. Chen, Chem. Eng. J., 2018, 332, 174–182 CrossRef CAS.
- N. W. Wang, T. Matsumoto, M. Ueno, H. Miyamura and S. Kobayashi, Angew. Chem., Int. Ed., 2009, 48, 4744–4746 CrossRef CAS PubMed.
- A. Q. Wang, J. Li and T. Zhang, Nat. Rev. Chem., 2018, 2, 100–112 CrossRef.
- S. Kanungo, V. Paunovic, J. C. Schouten and M. F. N. D' Angelo, Nano Lett., 2017, 17, 6481–6486 CrossRef CAS PubMed.
- C. J. Jia and F. Schuth, Phys. Chem. Chem. Phys., 2011, 13, 2457–2487 RSC.
- Z. Yin, M. F. Chi, Q. J. Zhu, D. Ma, J. M. Sun and X. H. Bao, J. Mater. Chem. A, 2013, 1, 9157–9163 RSC.
- W. N. Zhang, G. Lu, S. Z. Li, Y. Y. Liu, H. B. Xu, C. L. Cui, W. J. Yan, Y. H. Yang and F. W. Huo, Chem. Commun., 2014, 50, 4296–4298 RSC.
- D. Hetemi and J. Pinson, Chem. Soc. Rev., 2017, 46, 5701–5713 RSC.
- Q. Wei and R. Haag, Mater. Horiz., 2015, 2, 567–577 RSC.
- Y. B. Guo, D. G. Wang and S. H. Liu, Appl. Surf. Sci., 2010, 256, 1714–1719 CrossRef CAS.
- X. Zhang and Z. H. Xu, Adv. Mater., 2012, 24, 4574–4577 CrossRef CAS PubMed.
- T. Kruk, K. Szczepanowica, D. Kregiel, L. Szyk-Warszynska and P. Warszynski, Colloids Surf., B, 2016, 137, 158–166 CrossRef CAS PubMed.
- H. Lee, S. M. Dellatore, W. M. Miller and P. B. Messersmith, Science, 2007, 318, 426–430 CrossRef CAS PubMed.
- T. W. Graul and J. B. Schlenoff, Anal. Chem., 1999, 71, 4007–4013 CrossRef CAS.
- N. Madaboosi, K. Uhlig, M. S. Jager, H. Mohwald, C. Duschl and D. V. Volodkin, Macromol. Rapid Commun., 2012, 33, 1775–1779 CrossRef CAS PubMed.
- Z. Y. Wang, D. Voicu, L. Tang, W. Li and E. Kumacheva, Lab Chip, 2015, 15, 2110–2116 RSC.
- X. Zhang, H. Wang and Z. H. Su, Langmuir, 2012, 28, 15705–15712 CrossRef CAS PubMed.
- D. M. Dotzauer, J. H. Dai, L. Sun and M. L. Brueing, Nano Lett., 2006, 6, 2268–2272 CrossRef CAS PubMed.
- M. Schrinner, S. Proch, Y. Mei, R. Keepe, N. Miyajima and M. Ballauff, Adv. Mater., 2008, 20, 1928–1933 CrossRef CAS.
- X. Yang, H. Zhao and S. Y. Gao, Ind. Eng. Chem. Res., 2017, 56, 3429–3435 CrossRef CAS.
- H. Lee, J. Rho and P. B. Messersmith, Adv. Mater., 2009, 21, 431–434 CrossRef CAS PubMed.
- B. Yu, J. X. Liu, S. J. Liu and F. Zhou, Chem. Commun., 2010, 46, 5900–5902 RSC.
- Y. L. Liu, K. L. Ai and L. H. Lu, Chem. Rev., 2014, 114, 5057–5115 CrossRef CAS PubMed.
- M. Villalba, M. L. Bossi and E. J. Calvo, Phys. Chem. Chem. Phys., 2015, 17, 10086–10092 RSC.
- R. Chen, H. Feng, X. Zhu, Q. Liao, D. D. Ye, J. Liu, M. Liu, G. Chen and K. Wang, Chem. Eng. Sci., 2018, 175, 175–184 CrossRef CAS.
- X. J. Zan and Z. H. Su, Langmuir, 2009, 25, 12355–12360 CrossRef CAS PubMed.
- X. J. Zan, B. Peng, D. A. Hoagland and Z. H. Su, Polym. Chem., 2011, 2, 2581–2589 RSC.
- S. T. Dubas and J. B. Schlenoff, Langmuir, 2001, 17, 7725–7727 CrossRef CAS.
- M. D. Miller and M. L. Bruening, Chem. Mater., 2005, 17, 5375–5381 CrossRef CAS.
|
| This journal is © The Royal Society of Chemistry 2019 |
Click here to see how this site uses Cookies. View our privacy policy here.  Open Access Article
 *ab,
Xun Zhu
 *ab,
Qiang Liaoab,
Dingding Ye
 ab,
Biao Zhangab,
Ming Liuab,
Gang Chenab and
Kun Wangab
![[thin space (1/6-em)]](https://www.rsc.org/images/entities/char_2009.gif) 000) and poly(diallyldimethylammonium chloride) (PDDA, 20 wt% in water, MW 200
000) and poly(diallyldimethylammonium chloride) (PDDA, 20 wt% in water, MW 200![[thin space (1/6-em)]](https://www.rsc.org/images/entities/char_2009.gif) 000–350
000–350![[thin space (1/6-em)]](https://www.rsc.org/images/entities/char_2009.gif) 000) were employed for preparing the polydopamine (PDA) coating, PSS layer and PDDA layer, respectively. All were purchased from Sigma-Aldrich. The buffer and reducing agents of the Tris (tris(hydroxymethyl)aminomethane) and sodium borohydride (NaBH4) were acquired from Sigma-Aldrich. Palladium chloride (PdCl2) used for the preparation of the Pd nanocatalysts was obtained from Sino-Platinum Metals Co. LTD (Kunming, China). The liquid reactant of nitrobenzene was supplied by Aladdin. All chemicals were analytical grade and used as received. Water used throughout the experiments was achieved with an Ultrapure Water System (resistivity ∼ 18.2 MΩ cm, Hitech, Smart-S15UVF, Shanghai, China). A commercial PTFE capillary tube with an inner diameter of 0.6 mm, an outer diameter of 1.0 mm and a length of 55.0 cm was used to fabricate the micro-reactors.
000) were employed for preparing the polydopamine (PDA) coating, PSS layer and PDDA layer, respectively. All were purchased from Sigma-Aldrich. The buffer and reducing agents of the Tris (tris(hydroxymethyl)aminomethane) and sodium borohydride (NaBH4) were acquired from Sigma-Aldrich. Palladium chloride (PdCl2) used for the preparation of the Pd nanocatalysts was obtained from Sino-Platinum Metals Co. LTD (Kunming, China). The liquid reactant of nitrobenzene was supplied by Aladdin. All chemicals were analytical grade and used as received. Water used throughout the experiments was achieved with an Ultrapure Water System (resistivity ∼ 18.2 MΩ cm, Hitech, Smart-S15UVF, Shanghai, China). A commercial PTFE capillary tube with an inner diameter of 0.6 mm, an outer diameter of 1.0 mm and a length of 55.0 cm was used to fabricate the micro-reactors.


