 Open Access Article
Control of graphene aerogel self-assembly in strongly acidic solution via solution polarity tuning†
Jinhui Huang a,
Xue Huangb,
Ming He
 b,
Buning Zhangb,
Guangzhu Fengb,
Guoqiang Yin*b and
Yingde Cui*ac
aSchool of Materials Science and Engineering, Northwestern Polytechnical University, Xi'an 710072, PR China
bGuangzhou Key Laboratory for Efficient Utilization of Agricultural Chemicals, Zhongkai University of Agriculture and Engineering, Guangzhou 510225, P. R. China. E-mail: yingq007@163.com; Tel: +86-20-89002328
cGuangzhou Vocational College of Science and Technology, Guangzhou 510550, P. R. China. E-mail: 13602880087@139.com; Tel: +86-20-87411788
First published on 5th July 2019
Abstract
In view of their advantages (plasticity, low density, adjustable pore size, high porosity of >99.9%), three-dimensional graphene aerogels (GAs) are widely used for energy storage and adsorption separation, which has inspired the development and optimization of the corresponding synthetic techniques. In particular, self-assembly in the liquid phase features the benefits of tunability and sustainability and is viewed as a promising strategy of GA synthesis. During hydrothermal GA preparation, hydrophilic graphene oxide (GO) gradually turns lipophilic upon reduction, and the resulting phase transition separation and polarity change induce self-assembly into an aerogel. However, the effect of solution polarity on the structure or state of dispersed GO nanosheets, which affects the final property-determining process of automatic assembly, is still unclear. Herein, we prepared a series of GAs by hydrothermal reduction of unwashed GO with vitamin C in liquid-phase systems of different polarity and investigated the effects of polarity on the self-assembly process and aerogel properties using a range of instrumental techniques. The results showed that GO reduction is slowed down in weakly polar systems and further demonstrated that the shape of partially reduced graphene oxide (rGO) flakes depends on solution polarity. Flaky, layered, and stacked rGO particles obtained in strongly polar media self-assembled into anisotropic gully aerogels that were brittle and almost completely inelastic. Conversely, in weakly polar media, the prepared rGO sheets were twisted, which increased the number of contact points and modes between sheets and resulted in self-assembly into uniform-pore-structure honeycomb aerogels that showed good elasticity and could be repeatedly compressed.
Introduction
The discovery of graphene triggered a wave of research on the preparation and application of new carbon-based materials. Three-dimensional (3D) graphene materials such as graphene aerogels (GAs) are used much more widely than their two-dimensional counterparts because of the high porosity, high specific surface area, high compressibility, high elasticity, low density,1 and excellent mechanical properties of the former. Moreover, GA microstructure control allows this material to be used for energy storage,2–4 water treatment,5–9 environmental remediation,10 insulation,1 electrodes,11–13 pressure sensing,14,15 etc.At present, GAs are usually prepared by template methods in which graphene is deposited on substrates such as metal foam and silica gel16 by chemical vapor deposition17,18 and the substrate is then removed by etching to obtain an aerogel structured similarly to the template. Aerogels prepared in this way exhibit good physical and mechanical properties, preserve the original properties of graphene, and have fewer defects. However, the template approach requires the use of high temperature, involves a multitude of steps and complicated procedures, employs or produces toxic and harmful substances, and is not easily upscaleable. In addition, 3D printing methods have been recently used to prepare graphene oxide (GO) inks19,20 and regular-structure GAs.21 At present, hydrothermal reduction, which exhibits the advantages of low cost, high yield, easy scalability, and controllability, is the most widely reported and upscaleable GA production technique, featuring the steps of GO dispersion in aqueous solution, hydrothermal reduction (direct or in the presence of a reducing agent),1,22,23 and freeze-drying or supercritical drying of the obtained wet gel. GO used in the above techniques can be easily produced by the improved Hummers' method but requires cleaning, i.e., should be washed to neutrality, since acidic conditions adversely affect the self-assembly of aerogels into 3D structures.24–26 Typically, as-prepared GO is first washed with aqueous HCl until no sulfate ions are detected in the filtrate by the BaSO4 precipitation test. Next, acetone or other solvents are used to remove hydrochloric acid, and then is washed with deionized water until the filtrate is neutral. Importantly, GO does not swell under acidic conditions and is therefore easy to filter or centrifuge, while swelling into a sol under close-to-neutral conditions complicates filtration and necessitates the utilization of time-consuming purification procedures (ion exchange or ultra-high-speed centrifugation), which results in low yields.
GO is amphiphilic, featuring hydrophilic edges and hydrophobic graphene structure. As in the case of ionic surfactants, the amphiphilicity of GO depends on the ionization degree of boundary –COOH groups or the pH of the dispersion solution. For example, higher pH may result in increased charge accumulation on flake edges and hence, in increased hydrophilicity, while lower pH reduces the amount of charge at edges and thus results in poor dispersibility in water. Generally, the self-assembly process is complicated by the concomitant occurrence of agglomeration. Although this problem can be mitigated by pH adjustment, this strategy involves the introduction of other atoms and results in aerogel preparation and property uncertainties, e.g., when pH is adjusted to 11 with aqueous ammonia, the N content of aerogels can reach 7%.24
According to literature, the process of hydrothermal GA preparation features the gradual reduction of GO and the concomitant change of its properties from hydrophilic to lipophilic. The above polarity change results in phase separation, i.e., individual flakes are attracted to each other by van der Waals forces and randomly assemble into a 3D gel.27 Since the polarity of rGO decreases with increasing extent of GO deoxygenation, the aggregation behavior of the former should be affected by solvent polarity. However, the effects of solvent polarity on the self-assembly of GO into GAs have not been reported yet.
Herein, we prepare GAs in media of different polarity, aiming to reduce the agglomeration tendency of graphene and change its solution-phase morphology and thus prepare GAs with good physical and mechanical properties under acidic conditions.
Experimental
GO was prepared by an improved Hummers' method.28 Expanded graphite (5 g) was added to a conical flask containing concentrated H2SO4 (450 mL) and concentrated H3PO4 (50 mL), and the mixture was stirred for 30 min at room temperature. Subsequently, KMnO4 (30 g) was slowly added over 30 min in small portions upon fast stirring, and the mixture was slowly heated to 50 °C, kept at this temperature for 3 h, and cooled to below 5 °C in an ice bath. Next, water (600 mL) was slowly added while maintaining the temperature at ≤5 °C. Finally, H2O2 (30 wt%, 30 mL) was added, and the solid was washed several times with 10 vol% HCl and then with 2 vol% HCl (by centrifugation) until no BaSO4 precipitation was detected. Finally, the washed precipitate was dispersed in deionized water (1 L), and the dispersion was filled into 10 × 12 × 17 cm3 bags and freeze-dried to afford GO.As shown in Fig. 1 the obtained GO was dispersed in aqueous ethanol (ET) or deionized water (50 mL, 1.5 mg mL−1) by sonication for 1 h. Vitamin C (VC; 100 μL, 100 mg mL−1) was added into brown dispersions. After stirring, the homogeneous suspension was added into a glass-lined Teflon reactor. And then the reactor was placed into an oven held at 95 °C for a certain time to induce reduction, and the obtained wet gel was freeze-dried to afford GA. Aerogels prepared from aqueous solutions were denoted as GA-W, while those prepared from ethanolic solutions were denoted as GA-ET. Alcohol content (x, vol%) and hydrothermal reduction time (y, h) were recorded as GA-ET-x-y.
Gel volume (Vw) was calculated by measuring the diameter (d) and height (h) of the gel cylinder as Vw = 0.25πd2h.
Thermogravimetric analysis (TGA; Mettler Toledo TGA 2) of GAs was performed by heating ∼5 mg samples in an alumina crucible from 50 to 300 or 600 °C at a rate of 10 °C min−1 in a flow of N2 (50 mL min−1).
X-ray photoelectron spectroscopy (XPS; ESCALAB 250Xi, Thermo Scientific) analysis was performed using monochromatized Al Kα (1486.6 eV) radiation at a power of 150 W. Binding energies were calibrated using the C 1s peak at 284.8 eV. XPSPeak41 software was used to perform peak fitting (20% Gaussian and 80% Lorentzian) employing the Shirley background mode.
Scanning electron microscopy (SEM) images were acquired on a Carl Zeiss EVO18 microscope (Germany). Samples were pasted on a conductive adhesive without spraying Au and directly imaged at different angles by controlling the rotating roll of the sample platform.
Raman spectra were recorded on a Horiba Jobin Yvon LabRAM HR800 microconfocal Raman spectrometer (France) using a detection wavelength of 612 nm.
Results and discussion
As mentioned above, this work mainly aimed to investigate the influence of solution polarity on the properties of GAs and discuss their formation mechanism. Table 1 lists the dielectric constants (i.e., measures of polarity) of solutions used for GA preparation, while Table 2 lists the corresponding pH values for a GO concentration of 1.5 mg mL−1, rdelim revealing that all solutions were strongly acidic (pH = 2.5–2.8).| Ethanol content (wt%) | Dielectric constant | Ethanol content (wt%) | Dielectric constant |
|---|---|---|---|
| 0 | 80.14 | 50 | 50.4 |
| 10 | 74.6 | 60 | 44.7 |
| 20 | 68.7 | 70 | 39.1 |
| 30 | 62.6 | 80 | 33.9 |
| 40 | 56.5 | 100 | 24.55 (ref. 30) |
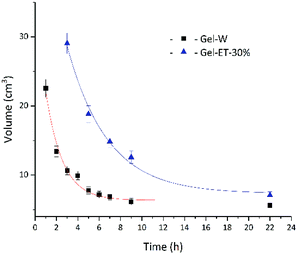
The dispersion law of GO is similar to the principle of similar compatibility, with GO/rGO acting as the solute, and the hydrothermal system acting as the solvent. Thus, with the decrease of solution polarity, the tendency of rGO to aggregate with each other will decrease. The tendency of rGO to dissolve and aggregate is balanced where it cannot aggregate to form a stable 3D shape. As shown in Fig. 2, under the experimental conditions of this paper, solvent polarity gradually decreased, and gel volume linearly increased with increasing ET content, while no self-assembly into a stable-shape gel was observed in 100% ET. That is to say, although rGO polarity is determined only by the degree of reduction, solvent polarity affects the mutual attraction of graphene sheets and their aggregation degree, therefore influencing gel volume. Fig. 3 shows the change of gel volume with reduction time at constant solvent polarity, revealing a power-law-type dependence. With increasing time, the reduction degree and lipophilicity increased, while the polarity decreased, and the final volume was negatively correlated with solvent polarity.
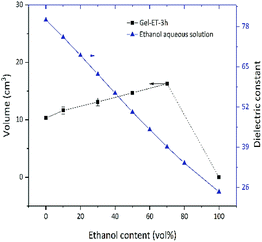 | ||
| Fig. 2 Dependence of wet gel volume and solution dielectric constant on the ET content of the precursor solvent. | ||
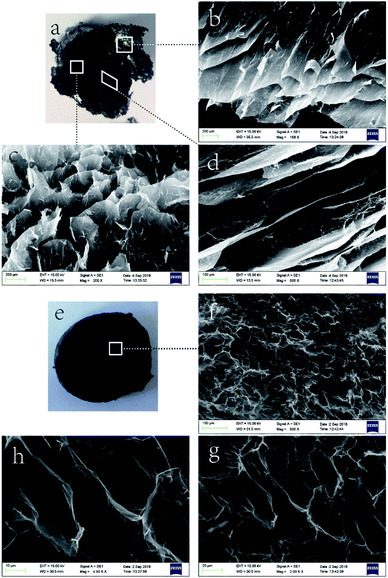
On the macro level, the wet gel volume change was very obvious, which indicated that system polarity greatly influenced gel formation. The effect of solvent polarity on gel microstructure was probed by SEM imaging, as shown in Fig. 4 and 5. Notably, GA-W exhibited a flake-like texture, while rGO featured a flake-like cascade and showed certain anisotropy, in agreement with previous reports.24–26 With increasing reaction time (i.e., with increasing reduction degree), the content of hydrophilic groups decreased, the pores between sheets became smaller, and the cross-linkages between sheets became closer. As a result, the sheet was somewhat deformed, the whole assembly became more compact, and a gully was finally formed (Fig. 4b). Conversely, completely different behavior was observed for GA-ET. In this system, partially reduced graphene sheets were bent and twisted, which increased the number of contact modes and contact points between sheets to form a honeycomb aerogel with random pore characteristics and a relatively uniform structure. With increasing reduction time, the connected ones became closer, and the pores became smaller (Fig. 4d). However, the GO sheets became progressively more deformed with increasing solvent polarity, exhibited a decreased aggregation tendency to form a aerogel and the pores therefore concomitantly became larger (Fig. 4e and f). The results of the above analysis were consistent with the change of wet gel volume. Fig. 5 compares differences between the two solution systems in greater detail, revealing that in aqueous solution, graphene sheets were obviously stacked31 and exhibited increased thickness, which made them easily observable from a side-on perspective (Fig. 5b and d). GAs formed in ethanolic solutions were uniform and were characterized by numerous contact modes and contact points between sheets, which were cross-linked and self-assembled into aerogels with a honeycomb pore structure upon reduction (Fig. 5g and h).
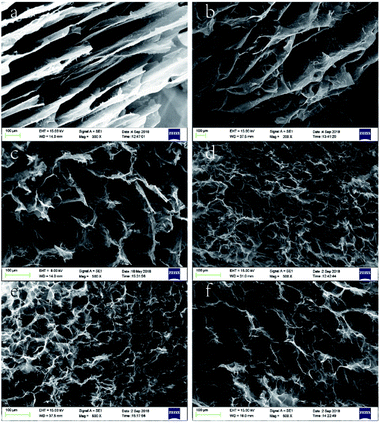 | ||
| Fig. 4 SEM images of (a) GA-W-3 h, (b) GA-W-5 h, (c) GA-ET-30%-1 h, (d) GA-ET-30%-5 h, (e) GA-ET-30%-3 h, and (f) GA-ET-50%-3 h. | ||
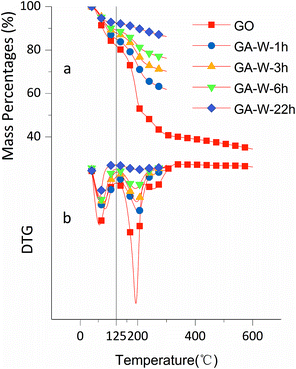
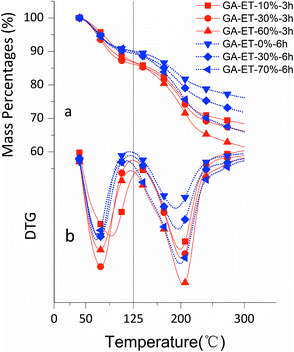
The effects of solvent system on aerogel chemical properties were probed by TGA, XPS, and Raman spectroscopy analyses of freeze-dried samples. Fig. 6a shows TGA curves of GA-W samples prepared using different reduction times, while Fig. 6b shows the corresponding DTG curves, revealing the occurrence of two rapid weight losses at 70 °C (volatilization of adsorbed moisture) and 180 °C (decomposition of oxygen-containing groups). The weight loss below 125 °C was ascribed to the evaporation of adsorbed/bound water or other volatile substances such as ethanol and hydrogen chloride, and the decomposition of oxygen-containing groups was concluded to be complete at 300 °C, since almost no weight loss was observed between 300 and 600 °C. Fig. 6a shows that weight loss above 125 °C decreased with increasing reduction time, which was attributed to the concomitant reduction of oxygenated group content, i.e., the weight losses of GO and GA-W-22 h in the range of 125–300 °C equaled 49.95 and 6.76%, respectively. Fig. 7a and b show the TGA and DTG curves of GA-ET samples, respectively, revealing that weight loss was negatively correlated with reduction time and water content (i.e., with solution polarity). In conclusion, since the decomposition of oxygenated groups led to GA weight loss, the latter parameter was negatively correlated with the degree of reduction. Therefore, it was inferred that the presence of weakly polar substances delays or interferes with GO reduction, and the extent of this delay was concluded to increase with decreasing solvent polarity, as was verified by subsequent analysis.
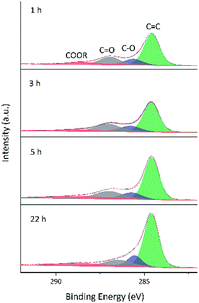
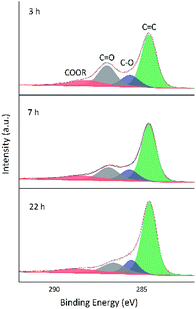
As GO contains numerous oxygenated groups such as –C(OH), –COOH, –COOR, –COC–, and –C![[double bond, length as m-dash]](https://www.rsc.org/images/entities/char_e001.gif) O, changes in the relative contents of these groups upon reduction were detected and analyzed using XPS. Further information is obtained from the fitting of XPS peaks according to the literature.32–34 Table 3 lists the literature-reported positions of C 1s and O 1s peaks for different functional groups, and Fig. 8 and 9 show fitted C 1s spectra of GA-W and GA-ET-30% samples. As can be seen from the change of peak shape, the content of graphene C
O, changes in the relative contents of these groups upon reduction were detected and analyzed using XPS. Further information is obtained from the fitting of XPS peaks according to the literature.32–34 Table 3 lists the literature-reported positions of C 1s and O 1s peaks for different functional groups, and Fig. 8 and 9 show fitted C 1s spectra of GA-W and GA-ET-30% samples. As can be seen from the change of peak shape, the content of graphene C![[double bond, length as m-dash]](https://www.rsc.org/images/entities/char_e001.gif) C bonds increased with increasing reduction time, while the contents of other carbon-containing groups concomitantly decreased. This decrease was most pronounced for C
C bonds increased with increasing reduction time, while the contents of other carbon-containing groups concomitantly decreased. This decrease was most pronounced for C![[double bond, length as m-dash]](https://www.rsc.org/images/entities/char_e001.gif) O bonds, i.e., a large number of these bonds were reduced by VC. Comparison of the above two figures demonstrates that reduction was relatively rapid in aqueous solution (Fig. 8), for which a very high degree of reduction was achieved after 3 h and did not change much as the reduction time was extended to 5 h, in agreement with the results of TGA. Conversely, reduction in 30 vol% ethanol was slow, and the relative content of C
O bonds, i.e., a large number of these bonds were reduced by VC. Comparison of the above two figures demonstrates that reduction was relatively rapid in aqueous solution (Fig. 8), for which a very high degree of reduction was achieved after 3 h and did not change much as the reduction time was extended to 5 h, in agreement with the results of TGA. Conversely, reduction in 30 vol% ethanol was slow, and the relative content of C![[double bond, length as m-dash]](https://www.rsc.org/images/entities/char_e001.gif) O moieties was still high after 3 h, with a value similar to that achieved after 3 h reduction in water realized only after 22 h. Fig. 10 shows the fitted C 1 s spectra of GA-ET-3 h prepared in solutions with variable ethanol contents, demonstrating that with increasing ethanol content, the content of C
O moieties was still high after 3 h, with a value similar to that achieved after 3 h reduction in water realized only after 22 h. Fig. 10 shows the fitted C 1 s spectra of GA-ET-3 h prepared in solutions with variable ethanol contents, demonstrating that with increasing ethanol content, the content of C![[double bond, length as m-dash]](https://www.rsc.org/images/entities/char_e001.gif) C groups was somewhat reduced, while that of C
C groups was somewhat reduced, while that of C![[double bond, length as m-dash]](https://www.rsc.org/images/entities/char_e001.gif) O moieties increased. Thus, reduction degree was negatively correlated with ethanol content.
O moieties increased. Thus, reduction degree was negatively correlated with ethanol content.
| Group | Binding energy (eV) |
|---|---|
| C 1s | |
C![[double bond, length as m-dash]](https://www.rsc.org/images/entities/char_e001.gif) C C |
284.6 |
| C–O | 286.3 |
C![[double bond, length as m-dash]](https://www.rsc.org/images/entities/char_e001.gif) O O |
287.2 |
| COOR | 288.9 |
![[thin space (1/6-em)]](https://www.rsc.org/images/entities/char_2009.gif) |
|
| O 1s | |
C![[double bond, length as m-dash]](https://www.rsc.org/images/entities/char_e001.gif) O, conjugated38 O, conjugated38 |
530.7 |
C![[double bond, length as m-dash]](https://www.rsc.org/images/entities/char_e001.gif) O O |
531.5 |
| C–O–C | 532.6 |
| C–O | 533.5 |
| H2O | 534.0 |
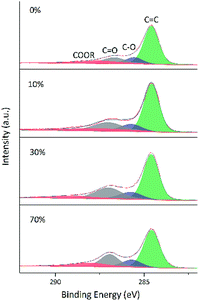 | ||
| Fig. 10 Fitted C 1s spectra of GA-ET-3 h samples prepared in solutions with different ethanol contents. | ||
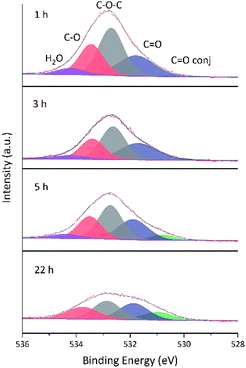
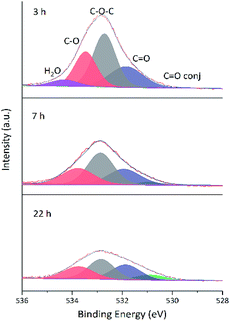
Changes of O 1s spectra were investigated in a similar way. Fig. 11 and 12 show the fitted O 1s spectra of GA-W and GA-ET-30% samples, respectively. With increasing reduction time, the observed peaks became flatter, which indicated that the content of O-containing groups decreased. Based on the changes of oxygen content in Table 4 (The higher the reduction, the lower the oxygen content), it was concluded that the extent of reduction achieved in less than 2 h in water could only be reached after 22 h in 30 vol% ethanol, in agreement with previous results. Notably, the relative content of conjugated C![[double bond, length as m-dash]](https://www.rsc.org/images/entities/char_e001.gif) O moieties increased with increasing extent of reduction, which was caused by the conjugation of C
O moieties increased with increasing extent of reduction, which was caused by the conjugation of C![[double bond, length as m-dash]](https://www.rsc.org/images/entities/char_e001.gif) C and C
C and C![[double bond, length as m-dash]](https://www.rsc.org/images/entities/char_e001.gif) O groups and agreed with the enhancement of C
O groups and agreed with the enhancement of C![[double bond, length as m-dash]](https://www.rsc.org/images/entities/char_e001.gif) C peak intensity.24 Fig. 13 shows that the O 1s peak shape changed from flat to towering with increasing ethanol content at constant reduction time, indicating a concomitant increase of oxygen content (shown in Table 4). That was the extent of reduction at constant reaction time was negatively correlated with ethanol content.
C peak intensity.24 Fig. 13 shows that the O 1s peak shape changed from flat to towering with increasing ethanol content at constant reduction time, indicating a concomitant increase of oxygen content (shown in Table 4). That was the extent of reduction at constant reaction time was negatively correlated with ethanol content.
| Samples | O (atomic%) | C (atomic%) |
|---|---|---|
| GA-W-1 h | 76.34 | 22.1 |
| GA-W-3 h | 77.62 | 20.29 |
| GA-W-5 h | 81.34 | 17.42 |
| GA-W-22 h | 85.79 | 12.73 |
| GA-ET-30%-3 h | 76.15 | 22.55 |
| GA-ET-30%-7 h | 80.06 | 18.11 |
| GA-ET-30%-22 h | 84.65 | 13.77 |
| GA-ET-3 h-0% | 80.6 | 17.25 |
| GA-ET-3 h-10% | 80.58 | 18.24 |
| GA-ET-3 h-30% | 79.68 | 19.24 |
| GA-ET-3 h-70% | 77.01 | 21.59 |
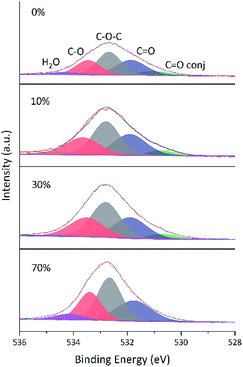 | ||
| Fig. 13 Fitted O 1s spectra of GA-ET-3 h samples prepared in solutions with different ethanol contents. | ||
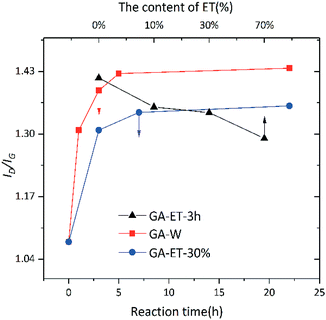
In addition, aerogel composition was probed by Raman spectroscopy. The Raman spectrum of graphene comprises several peaks, namely G, D, and G’ bands.39 The most intense peak, i.e., the G band, corresponds to the in-plane vibration of sp2 carbon atoms and appears at ∼1580 cm−1, effectively reflecting the degree of graphene crystallinity/regularity. The D band, often used to characterize structural defects or edges in graphene samples, is thought to reflect the extent of disorder in graphene and is believed to be caused by lattice vibrations leaving the center of the Brillouin region. Therefore, the intensity ratio of these bands, ID/IG, allows one to roughly estimate the degree of structural integrity in rGO. Fig. 14 shows that ID/IG significantly increased upon reduction, indicating that GA formability after reduction was very poor. This behavior was ascribed to the fact that large pieces of GO were broken into small fragments upon 1 h ultrasonication before reduction, which increased the boundary effect40 and, hence, ID/IG. According to the results of TGA and XPS analyses, the degree of GO reduction increased with time in both water and 30% ethanol, decreasing with increasing ethanol content at constant reduction time. The change of ID/IG was consistent to that of reduction degree, which was ascribed to the reduced effect of cross-linking between sheets and the increased importance of the boundary effect upon reduction. Concomitantly, the relative content of C![[double bond, length as m-dash]](https://www.rsc.org/images/entities/char_e001.gif) O moieties decreased, which resulted in decreased boundary conjugation and enhanced the effect of sp3 carbons. At the same time, as the oxygen-containing groups left, more fragments were generated, which enhanced the boundary effect and led to the increase of ID/IG.
O moieties decreased, which resulted in decreased boundary conjugation and enhanced the effect of sp3 carbons. At the same time, as the oxygen-containing groups left, more fragments were generated, which enhanced the boundary effect and led to the increase of ID/IG.
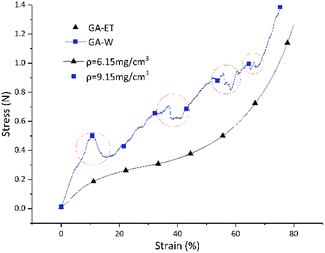
Similarly to chemical properties, the physical properties of aerogels prepared in various polar systems were also different, as exemplified by the stress–strain curves shown in Fig. 15. For both GA-ET-30%-3 h and GA-W-3 h samples, stress increased with increasing strain. However, the GA-W-3 h curve was not smooth and featured zigzags. During the compression process, there were abrupt changes (marked by red circles), i.e. the strain was unchanged or changed very little, while the pressure dropped off precipitously. This was due to the breakage of the aerogel by brittle fracture of the internal pore walls in parallel pressure direction during compression (Fig. 16b). When the aerogel was prepared in water solution, the graphene nanosheets were stacked in sheet forms, resulting in very thick pore walls and loss of flexibility and elasticity as in the single layer graphene. Conversely, the GA-ET-30%-3 h curve was smooth and showed that stress increased with increasing strain, in line with elastic behavior. Compression–decompression tests (Fig. 16) revealed that GA-W-3 h was very brittle and easily lost elasticity during compression (Movie S1†). In contrast, GA-ET-30%-3 h featured good compressibility and elasticity, returning to its original state after decompression and sustaining numerous compression–decompression cycles (Movie S2†). Therefore, GA-ET-30%-3 h was concluded to be well suited for use in adsorption and separation applications. The above phenomenon was explained by considering the results of cross-sectional and SEM imaging (Fig. 5), which demonstrated that rGO nanosheets were obviously stacked and became thickness, therefore became rigid, resulting in loss of elasticity for GA-W, while the pores were uniform, and the rGO nanosheets were cross-linked at the boundary, and no stacking, showed excellent flexibility for GA-ET.
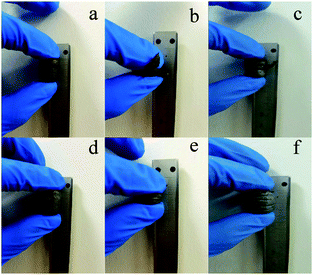 | ||
| Fig. 16 Compression–decompression testing of (a–c) GA-W and (d–f) GA-ET samples; (a and d): before compression; (b and e): during compression, (c and f) after compression. | ||
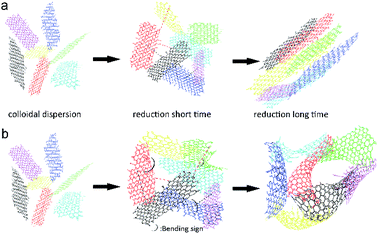
Based on the above results, we concluded that the process of aerogel assembly changed in weakly polar solutions, probably because the concomitant change of the degree of oxygenated group protonation resulted in slow reduction. Moreover, decreased solution polarity caused the distortion and deformation of partially reduced graphene oxide sheets, which were no longer as smooth as those obtained in the aqueous solution. Concomitantly, the structure of these sheets changed from two-dimensional (in the aqueous system) to distorted three-dimensional, which was accompanied by loss of orientation. As a result, a larger number of contact modes were formed in the assembly process, and the stacking of non-flat sheets eventually afforded aerogels with uniform pores. A possible mechanism of GA formation is shown in Fig. 17. In the beginning, GO sheets randomly float in the solution, and rGO sheets produced by GO reduction remain flat in aqueous solution. Under the action of hydrogen bonding and van der Waals forces, rGO sheets get close to each other and engage in stratified stacking to form the aerogel in Fig. 5a. In weakly polar media, rGO sheets are distorted, probably because of their enhanced lipophilicity and decreased polarity, and are consequently better dispersed, which results in a decreased aggregation tendency and the increase of the number of contact modes, finally furnishing aerogels with uniform pores (Fig. 5e).
Conclusions
Herein, we prepared GAs in media of different polarity by direct reduction of GO that was not washed to neutrality (pH 2.5–2.8, 1.5 mg mL−1), revealing that the chemical/mechanical properties and microstructure of aerogels was broadly variable and showing that wet gel volume increased approximately linearly with solution polarity within a certain range. Instrumental analyses revealed that the decomposition temperature of GA oxygenated groups was close to 180 °C and demonstrated that weight loss upon heating increased with increasing solution polarity. Moreover, XPS spectroscopy revealed that the relative content of graphene C![[double bond, length as m-dash]](https://www.rsc.org/images/entities/char_e001.gif) C bonds decreased with decreasing solvent polarity at constant reduction time, while the oxygen content concomitantly increased. At constant solvent polarity, the degree of reduction increased with increasing reduction time, but the maximal degree of reduction was higher for strongly polar systems, as confirmed by ID/IG ratio changes. The above behavior was ascribed to the progressive loss of boundary cross-links and increasing of the fragments with increasing reduction degree, which resulted in increased boundary defectiveness. Chemical property analysis allowed us to conclude that the extent of reduction in strongly polar systems exceeded that in weakly polar ones, i.e., the presence of a weakly polar component (ethanol) delayed or interfered with the reduction process. The results of SEM observation and compression testing showed that GO nanosheets in the strongly polar solution system were flat and assembled via layer-like stacking with a certain degree of anisotropy, which afforded aerogels with a gully pore structure, high brittleness, and poor elasticity. Conversely, twisted 3D GO sheets were present in weakly polar systems, which increased the number of contact points and modes during assembly and afforded aerogels with a uniform honeycomb-shape pore structure, good elasticity, and compression–decompression cycling stability.
C bonds decreased with decreasing solvent polarity at constant reduction time, while the oxygen content concomitantly increased. At constant solvent polarity, the degree of reduction increased with increasing reduction time, but the maximal degree of reduction was higher for strongly polar systems, as confirmed by ID/IG ratio changes. The above behavior was ascribed to the progressive loss of boundary cross-links and increasing of the fragments with increasing reduction degree, which resulted in increased boundary defectiveness. Chemical property analysis allowed us to conclude that the extent of reduction in strongly polar systems exceeded that in weakly polar ones, i.e., the presence of a weakly polar component (ethanol) delayed or interfered with the reduction process. The results of SEM observation and compression testing showed that GO nanosheets in the strongly polar solution system were flat and assembled via layer-like stacking with a certain degree of anisotropy, which afforded aerogels with a gully pore structure, high brittleness, and poor elasticity. Conversely, twisted 3D GO sheets were present in weakly polar systems, which increased the number of contact points and modes during assembly and afforded aerogels with a uniform honeycomb-shape pore structure, good elasticity, and compression–decompression cycling stability.
Importantly, we successfully prepared a graphene aerogel with good physical and mechanical properties under strongly acidic conditions bypassing the time- and labor-intensive steps of GO cleaning, which ensured the applicability of the developed technique to large-scale production. Aerogels prepared by this method can be used for energy storage, adsorption separation, and other applications, and are expected to be commercialized in the near future.
Conflicts of interest
There are no conflicts to declare.Acknowledgements
This work was supported by the Natural Science Innovation Team projects in Guangdong Universities (2016KCXTD003) and the Characteristic innovation projects of Natural Sciences in Guangdong Universities (2016KTSCX059).Notes and references
- J. H. Li, J. Y. Li, H. Meng, S. Y. Xie, B. W. Zhang, L. F. Li, H. J. Ma, J. Y. Zhang and M. Yu, J. Mater. Chem. A, 2014, 2, 2934–2941 RSC.
- Y. Qu, C. B. Lu, Y. Z. Su, D. X. Cui, Y. F. He, C. Zhang, M. Cai, F. Zhang, X. L. Feng and X. D. Zhuang, Carbon, 2018, 127, 77–84 CrossRef CAS.
- N. Phattharasupakun, J. Wutthiprom, P. Suktha, N. Ma and M. Sawangphruk, J. Electrochem. Soc., 2018, 165, A609–A617 CrossRef CAS.
- J. J. Mao, J. Iocozzia, J. Y. Huang, K. Meng, Y. K. Lai and Z. Q. Lin, Energy Environ. Sci., 2018, 11, 772–799 RSC.
- S. B. Ye, Y. Liu and J. C. Feng, ACS Appl. Mater. Interfaces, 2017, 9, 22456–22464 CrossRef CAS.
- M. C. Yu, H. M. Zhang and F. L. Yang, ACS Appl. Mater. Interfaces, 2017, 9, 33948–33955 CrossRef CAS PubMed.
- S. Y. Dong, L. J. Xia, T. Guo, F. Y. Zhang, L. F. Cui, X. F. Su, D. Wang, W. Guo and J. H. Sun, Appl. Surf. Sci., 2018, 445, 30–38 CrossRef CAS.
- Q. L. Fang and B. L. Chen, J. Mater. Chem. A, 2014, 2, 8941–8951 RSC.
- I. Andjelkovic, D. N. H. Tran, S. Kabiri, S. Azari, M. Markovic and D. Losic, ACS Appl. Mater. Interfaces, 2015, 7, 9758–9766 CrossRef CAS.
- X. Mi, G. B. Huang, W. S. Xie, W. Wang, Y. Liu and J. P. Gao, Carbon, 2012, 50, 4856–4864 CrossRef CAS.
- M. I. Lescano, A. Gasnier, M. L. Pedano, M. P. Sica, D. M. Pasquevich and M. B. Prados, RSC Adv., 2018, 8, 26755–26763 RSC.
- B. Zhao, Z. X. Wang, Y. Gao, L. Chen, M. N. Lu, Z. Jiao, Y. Jiang, Y. Z. Ding and L. L. Cheng, Appl. Surf. Sci., 2016, 390, 209–215 CrossRef CAS.
- P. Hao, Z. H. Zhao, J. Tian, H. D. Li, Y. H. Sang, G. W. Yu, H. Q. Cai, H. Liu, C. P. Wong and A. Umar, Nanoscale, 2014, 6, 12120–12129 RSC.
- J. L. Xiao, Y. Q. Tan, Y. H. Song and Q. Zheng, J. Mater. Chem. A, 2018, 6, 9074–9080 RSC.
- Z. Wang, R. Wei, J. Gu, H. Liu, C. Liu, C. Luo, J. Kong, Q. Shao, N. Wang, Z. Guo and X. Liu, Carbon, 2018, 139, 1126–1135 CrossRef CAS.
- X. Li, J. Wang, Y. B. Zhao and X. T. Zhang, ACS Appl. Mater. Interfaces, 2018, 10, 16901–16910 CrossRef CAS.
- Z. Chen, W. Ren, L. Gao, B. Liu, S. Pei and H. M. Cheng, Nat. Mater., 2011, 10, 424–428 CrossRef CAS.
- Y. Ito, H. J. Qiu, T. Fujita, Y. Tanabe, K. Tanigaki and M. Chen, Adv. Mater., 2014, 26, 4145–4150 CrossRef CAS.
- C. Zhu, T. Y. J. Han, E. B. Duoss, A. M. Golobic, J. D. Kuntz, C. M. Spadaccini and M. A. Worsley, Nat. Commun., 2015, 6, 8 Search PubMed.
- A. Gocha, Am. Ceram. Soc. Bull., 2015, 94, 14–15 Search PubMed.
- Q. Zhang, F. Zhang, S. P. Medarametla, H. Li, C. Zhou and D. Lin, Small, 2016, 12, 1702–1708 CrossRef CAS.
- X. T. Zhang, Z. Y. Sui, B. Xu, S. F. Yue, Y. J. Luo, W. C. Zhan and B. Liu, J. Mater. Chem., 2011, 21, 6494–6497 RSC.
- H. Hu, Z. B. Zhao, W. B. Wan, Y. Gogotsi and J. S. Qiu, Adv. Mater., 2013, 25, 2219–2223 CrossRef CAS.
- E. Garcia-Bordeje, S. Victor-Roman, O. Sanahuja-Parejo, A. M. Benito and W. K. Maser, Nanoscale, 2018, 10, 3526–3539 RSC.
- K. Hu, X. Xie, T. Szkopek and M. Cerruti, Chem. Mater., 2016, 28, 1756–1768 CrossRef CAS.
- H. Bi, K. Yin, X. Xie, Y. Zhou, N. Wan, F. Xu, F. Banhart, L. Sun and R. S. Ruoff, Adv. Mater., 2012, 24, 5123 CrossRef.
- W. Lv, C. Zhang, Z. Li and Q. H. Yang, J. Phys. Chem. Lett., 2015, 6, 658 CrossRef CAS.
- R. E. O. W. S. Hummers, J. Am. Chem. Soc., 1958, 80, 1339 CrossRef.
- L. Guangqi, M. Lianxiang. and L. Jie, Chemical Properties Data Manual -Inorganic Volume, Chemical Industry Press, Beijing, 2002 Search PubMed.
- L. Guangqi, M. Lianxiang. and L. Jie, Chemical Properties Data Manual -Organic Volume, Chemical Industry Press, Beijing, 2002 Search PubMed.
- W. Gang, L. T. Jia, H. Bo, D. B. Li, J. G. Wang and Y. H. Sun, N. Carbon Mater., 2015, 30, 30–40 CrossRef.
- L. Adams, A. Oki, T. Grady, H. Mcwhinney and Z. Luo, Phys. E, 2009, 41, 723–728 CrossRef CAS.
- T. I. T. Okpalugo, P. Papakonstantinou, H. Murphy, J. Mclaughlin and N. Brown, Carbon, 2005, 43, 153–161 CrossRef CAS.
- X. Wei, Y. Wang, R. Bergsträßer, S. Kundu and M. Muhler, Appl. Surf. Sci., 2007, 254, 247–250 CrossRef.
- U. Zielke, K. J. Hüttinger and W. P. Hoffman, Carbon, 1996, 34, 983–998 CrossRef CAS.
- Y. Lin and D. Su, ACS Nano, 2014, 8, 7823–7833 CrossRef CAS.
- J. Lahaye, G. Nanse, P. Fioux, A. Bagreev, A. Broshnik and V. Strelko, Appl. Surf. Sci., 1999, 147, 153–174 CrossRef CAS.
- R. Arrigo, M. Hävecker, S. Wrabetz, R. Blume, M. Lerch, J. McGregor, E. P. J. Parrott, J. A. Zeitler, L. F. Gladden, A. Knop-Gericke, R. Schlögl and D. S. Su, J. Am. Chem. Soc., 2010, 132, 9616–9630 CrossRef CAS.
- R. Saito, A. Jorio, A. G. S. Filho, G. Dresselhaus, M. S. Dresselhaus and M. A. Pimenta, Phys. Rev. Lett., 2002, 88, 027401 CrossRef CAS.
- L. G. Cançado, M. A. Pimenta, B. R. A. Neves, M. S. S. Dantas and A. Jorio, Phys. Rev. Lett., 2004, 93, 247401 CrossRef.
Footnote |
| † Electronic supplementary information (ESI) available. See DOI: 10.1039/c9ra02658d |
| This journal is © The Royal Society of Chemistry 2019 |


