 Open Access Article
Tetrathiafulvalene: effective organic anodic materials for WO3-based electrochromic devices†
Yong Min Kim‡
a,
Xinlin Li‡b,
Keon-Woo Kimc,
Se Hyun Kim *c and
Hong Chul Moon
 *a
*a
aDepartment of Chemical Engineering, University of Seoul, Seoul 02504, Republic of Korea. E-mail: hcmoon@uos.ac.kr
bCollege of Electromechanical Engineering, Qingdao University, Qingdao 266071, China
cSchool of Chemical Engineering, Yeungnam University, Gyeongsan, North Gyeongsang 38541, Republic of Korea. E-mail: shkim@ynu.ac.kr
First published on 20th June 2019
Abstract
Finding a new, effective anodic species is a challenge for achieving simpler low-voltage tungsten trioxide (WO3)-based electrochromic devices (ECDs). In this work, we utilize tetrathiafulvalene (TTF) and demonstrate its reversible redox behaviors as an electrolyte-soluble anodic species. The concentration of TTF in the electrolyte is varied to optimize device performance. When the TTF concentration is low (0.01 M), a smaller maximum transmittance difference (ΔTmax ∼ 34.2%) and coloration efficiency (η ∼ 59.6 cm2 C−1) are measured. Although a better performance of ΔTmax ∼ 93.7% and η ∼ 74.5 cm2 C−1 is achieved at 0.05 M TTF, the colored state could no longer return to its original form. We conclude that 0.03 M of TTF is the appropriate concentration for high-performance WO3 ECDs with high optical contrast and reversible EC behaviors. The irreversible EC transition at high concentrations of TTF is attributed to the agglomeration of TTF molecules.
1. Introduction
Electrochromic (EC) materials have attracted considerable attention due to their electric responsive behaviors that change optical absorbance or transmittance.1–3 EC devices (ECDs) have found relatively new applications such as functional energy storage devices (referred to as EC capacitors; ECSs),4–6 and electronic skins (e-skins).7,8 Nonetheless, most applications are in smart windows9–14 for buildings, cars, sunglasses, and reflective displays.15–26Among the several categories of EC materials, inorganic films are preferred to organic small molecules15–21 or conducting polymers22–26 because of their higher photochemical stability.27–29 Tungsten trioxide (WO3) is one example of a metal oxide exhibiting reversible EC behaviors.30–38 Typical WO3-based ECDs are comprised of two transparent electrodes, a cathodic WO3 film, an electrolyte, and a secondary anodic EC film. In particular, the secondary anodic films are essential for achieving low-voltage devices. Without them, reductive coloration of WO3 occurs only when the electrolyte near the anode is decomposed, which greatly degrades device performance.4,30
Recently, several efforts have been made to simplify the device structure by directly incorporating the anodic species into the electrolyte.4,30,31 In this process, the additional deposition of secondary film is unnecessary, and WO3 ECDs are fabricated straightforwardly. However, possible candidates available for electrolyte-soluble anodic species with high electrochemical stability are limited to hydroquinone (HQ),4 ferrocene (Fc),30 and ferrocene derivatives such as dimethyl Fc (dmFc).31 Therefore, the discovery of new anodic candidates and their successful applications are a challenge for high-performance, simple WO3 ECDs.
Herein, tetrathiafulvalene (TTF)-containing electrolytes were prepared and used in ECDs based on WO3. As an electrolyte-soluble anodic material, we selected and evaluated TTF that is an electron-donor with outstanding redox properties.39,40 The redox potential of TTF is more negative than that of representative anodic species, Fc. This implies that WO3 ECDs will be able to operate at very low voltages when combined with TTF. We varied the concentration of TTF in the electrolyte to investigate the correlation between TTF concentration and device performance. Irrespective of TTF content, noticeable changes in the absorption spectra were observed at −0.3 V. However, other characteristics including maximum transmittance contrast (ΔTmax), response time (Δt), and coloration efficiency depended on TTF concentration. For example, ΔTmax and coloration efficiency were small and kinetic response was relatively slow at low TTF concentration (e.g. 0.01 M), due to the concentration imbalance between anodic (TTF) and cathodic (WO3) materials. These properties were improved as the TTF concentration increased. However, TTF agglomerates were formed when the TTF concentration reached 0.05 M, which prevented the colored WO3 film from returning to its original transparent state. Our results demonstrate that TTF can successfully serve as an electrolyte-soluble anodic species, although the appropriate concentration of TTF is important for achieving a balanced, high-performance WO3 ECDs.
2. Experimental
All chemicals used in this work were purchased from Sigma-Aldrich. ITO-coated glasses (sheet resistance: 10 Ω sq−1, Asahi Glass Co.) were sequentially cleaned with acetone (20 min) and DI-water (20 min) under sonication followed by UV/ozone treatment for 10 min before use. EC WO3 film was prepared on an indium tin oxide (ITO)-coated glass by a low-temperature sol–gel process. The detailed synthetic process is described elsewhere.31 A propylene carbonate (PC) solution containing 0.5 M LiClO4 (supporting electrolyte) and TTF (anodic material) was employed for an electrolyte layer, in which the concentration of TTF was varied (i.e. 0.01, 0.03, and 0.05 M).EC devices (ECDs) based on WO3 and TTF-containing electrolytes were fabricated straightforwardly. First, a gasket (thickness of 60 μm) serving as a spacer was placed on the WO3-coated ITO electrode, and the electrolyte solution filled around the gasket. The dimension of active area was 25 mm × 25 mm (width × length). Next, the counter ITO electrode was assembled on the gasket, followed by complete sealing using silicon resin.
Cyclic voltammograms of TTF were obtained using a potentiostat (Weis 500, WonA Tech.) to investigate its redox behaviors. Changes in optical characteristics at different voltages were recorded on a UV-vis spectrometer (GENESYS 10S, Thermo Scientific™), where DC voltage input was suppled from a source meter (Keithley 2400, Tektronix). Time-dependent transmittance profiles during coloration and bleaching were obtained using the same instrumentations. All photographs for analyzing agglomeration behaviors of TTF after ECD operation were taken using an optical microscopy (OM, Nikon Eclipse LV100ND). Ionic conductivity of the TTF containing electrolyte was determined by electrochemical impedance spectrometry (EIS) (IM6, ZAHNER) at a frequency range of 10−1 to 106 Hz with AC amplitude of 10 mV. Noted that electrolyte layers containing TTF were highly conductive. For example, the ionic conductivity of ∼5.4 mS cm−1 at 25 °C was measured for 0.03 M TTF-containing electrolyte (see Fig. S1 in the ESI†).
3. Results and discussion
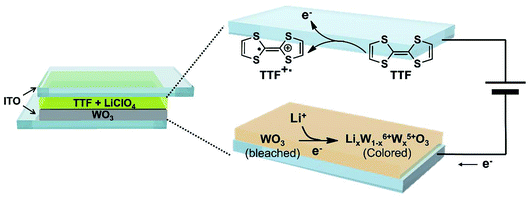
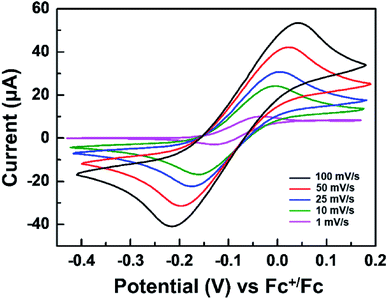
Fig. 1 displays the structure of the WO3 ECDs with electrolytes that contain the TTF anodic species as well as the overall electrochemical coloration reactions. Similar to previously reported anodic materials,4,30,31 the use of TTF further simplifies the device with the absence of anodic films on the counter electrode; the fabrication is more convenient and straightforward. When a negative bias is applied to the WO3-coated electrode (cathode, working electrode), the WO3 layer is reduced to colored LixW1−x6+Wx5+O3 with incorporating Li+ ions.38 Simultaneously, the TTF dissolved in the electrolyte is oxidized to TTF+˙ near the counter ITO electrode (anode, counter electrode). It should be noted that this work first employed the redox pair of TTF (anodic species) and WO3 (cathodic EC material). Although there is a paper in which TTF was utilized as an anodic material, a different EC chromophore (ethyl viologen, EV) was introduced.41 The WO3/TTF system in this work showed lower coloration voltage and larger maximum transmittance contrast compared to the ECDs with EV/TTF. These features will be analyzed shortly.Before characterizing the ECD performance, we evaluated the feasibility of TTF as an electrolyte-soluble anodic species for WO3 ECDs. The requirements for counter anodic materials should include stable redox behaviors and appropriate redox potential. Fig. 2 shows cyclic voltammograms of TTF in a PC solution. The redox reaction of the TTF+˙/TTF pair was quite reversible regardless of scan rate. Comparable cathodic (ipc) and anodic peak currents (ipa) indicate high reversibility of redox couple TTF+˙/TTF. For example, ipc/ipa ∼ 0.99 was extracted at 25 mV s−1. Another notable feature of TTF is more negative redox potential compared to previously reported anodic materials such as Fc or dmFc. In general, the coloration voltage is determined by the redox potential difference between the cathodic and anodic species. Because WO3 is a cathodic EC material, a lower voltage operation is expected when using TTF oxidized at −0.075 V vs. Fc+/Fc (see Fig. 2). We extracted diffusion coefficients (D) of TTF and TTF+ using Randles–Sevcik equation (see Fig. S2 in the ESI†). As a result, the DTTF and DTTF+ were determined to be ∼6.28 × 10⁻⁷ and ∼4.69 × 10⁻⁷ cm2 s−1, respectively.
It is noted that the shape of active areas can be conveniently adjusted if we utilize gel electrolytes containing TTF, although in this work we focus on the effect of TTF in the liquid electrolyte on device performance. For example, when the high toughness gel based on poly(vinylidene fluoride-co-hexafluoropropylene) (PVDF-co-HFP) was employed, the ECDs were demonstrated through ‘cut-and-stick’ strategy (see Fig. S3 in the ESI†).19,42–44 We also expect that the fabrication of large area devices is available by taking advantage of solution processability (e.g. spin coating) of gel electrolytes.
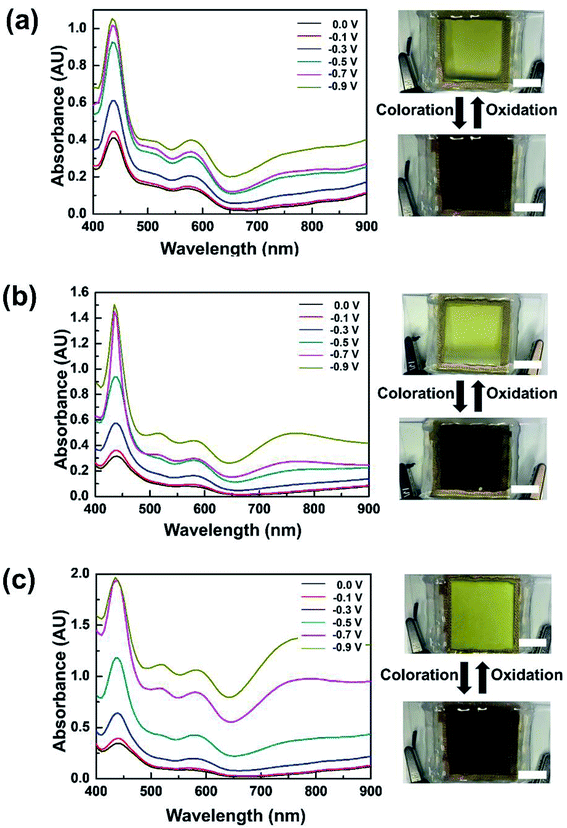
The dependence of optical characteristics on applied voltages was investigated at three TTF concentrations (Fig. 3). When 0.01 M TTF was included in the electrolyte, a noticeable change in absorption spectra was observed at −0.3 V (Fig. 3a). This coloration voltage is obviously lower than those of previous WO3 ECDs including electrolyte-soluble anodic species,4,30,31 which is attributed to the lower redox potential of TTF. As the applied voltage increased, stronger absorption appeared over the entire experimental wavelength. Photographs also indicate remarkable differences in color between bleached and colored states (Fig. 3a). Similar EC behaviors were observed at 0.03 and 0.05 M TTF (see Fig. 3b and c, respectively). However, device response at a higher TTF content was more sensitive to external voltage changes. In addition, we investigated thermal stability of the WO3 ECD including TTF, for which the device was exposed to 80 °C for 1 h. There was no noticeable change in both bleached and colored states. This result indicates the high thermal stability of TTF-containing WO3 ECDs (Fig. S4 in the ESI†).
Device dynamics under consecutive coloration and bleaching are recorded in Fig. 4. EC behaviors of the device with 0.01 M TTF were reversible, but a maximum transmittance contrast (ΔTmax) was only ∼34.2%. The coloration (Δtc) and bleaching time (Δtb) were ∼24 s and ∼10 s, respectively. It is noted that the response time (Δt) was determined as the time at which 90% of ΔTmax was achieved. A significant enhancement in ΔTmax was observed as the TTF concentration increased. For example, ΔTmax of ∼93.0% was achieved at 0.03 M TTF concentration. This improvement originates from the balanced oxidation and reduction reactions near the anode and WO3-deposited cathode, respectively. In addition, Δtc (∼12 s) at 0.03 M TTF was much faster than at 0.01 M, although bleaching required a longer time to recover. A large ΔTmax and fast coloration were also detected at a TTF concentration of 0.05 M, but bleaching was delayed considerably, and the device could not return to the initial state once colored.
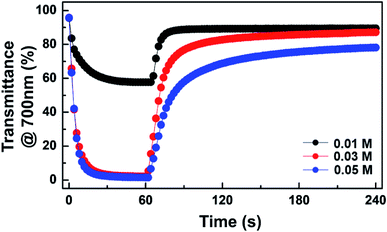 | ||
| Fig. 4 Transient transmittance profiles at 700 nm for ECDs at various TTF concentrations upon application of −0.9 V (coloration) followed by bleaching under short-circuit condition. | ||
The TTF concentration of coloration efficiency (η) was examined. The η value, which is the ratio between variations in optical density (ΔOD) and injected charge (ΔQ), was calculated from the slope of the linear fits in Fig. 5. A higher η was calculated from devices with a larger amount of TTF. For example, while η ∼ 74.5 cm2 C−1 was evaluated at 0.05 M TTF, the ECD with 0.01 M TTF was only ∼59.6 cm2 C−1. This observation can be explained by simultaneous electrochemical reactions of a large number of redox species. In addition, the coloration values are comparable (or higher) to those of ECDs based on WO3 EC films with other anodic materials (e.g. HQ ∼ 61.9 cm2 C−1,4 Fc ∼ 34.3 cm2 C−1,30 and dmFc ∼ 60.2 cm2 C−1 (ref. 31)). Accordingly, we conclude that TTF can successfully serve as an efficient anodic material for WO3 ECDs. The ECD performance at various TTF concentrations is summarized in Table 1.
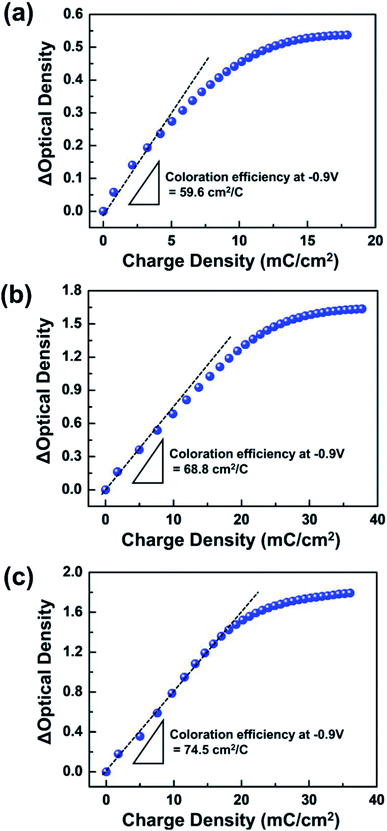 | ||
| Fig. 5 Dependence of optical density (OD) on the injected charge density at various TTF concentrations in electrolytes: (a) 0.01 M, (b) 0.03 M, and (c) 0.05 M. | ||
| TTF concentration (M) | ΔTmax (%) | Δtc (s) | Δtb (s) | η (cm2 C−1) |
|---|---|---|---|---|
| 0.01 | 34.2 | ∼24 | ∼10 | 59.6 |
| 0.03 | 93.0 | ∼12 | ∼28 | 68.8 |
| 0.05 | 93.7 | ∼10 | ∼68 | 74.5 |
A remarkable difference in optical characteristics, quicker response, and higher efficiency were realized at 0.05 M TTF. Nonetheless, this concentration cannot be considered optimal for practical applications due to the lack of reversibility (see Fig. 4). We revealed the origin of this performance deterioration at a large amount of TTF in the electrolyte. Fig. 6 displays optical microscopic images of TTF-containing electrolyte layer after 100 consecutive coloration/bleaching transitions. A homogeneous phase was maintained at TTF concentrations where reversible transitions of ECDs were shown (see Fig. 6a, b and S5 in the ESI†). On the other hand, a significant aggregation of TTF molecules was detected when the TTF concentration was higher (Fig. 6c). Electrochemical reactions of solid-state redox species occur only near the surface,45,46 which seriously retards coloration and bleaching and induces irreversible behaviors of ECDs. Therefore, the appropriate TTF concentration (in this case, 0.03 M) is very important for realizing high-performance WO3 ECDs.
 | ||
| Fig. 6 Optical microscopic photographs for electrolyte layers of ECDs after 100 consecutive coloration/bleaching cycles at various TTF concentrations: (a) 0.01 M, (b) 0.03 M, and (c) 0.05 M. | ||
The characterization of coloration/bleaching cyclic stability is essential for evaluating the practical feasibility of ECDs. Accordingly, we assessed the cyclic stability of devices based on WO3 and TTF. An asymmetric square wave consisting of −0.9 V for 5 s (coloration) and 0.0 V for 55 s (bleaching) was applied, with the consideration of the longer bleaching response. The transmittance was reversibly changed according to the applied voltage over 200 cycles (Fig. 7), implying good cyclic stability of WO3 ECDs including TTF.
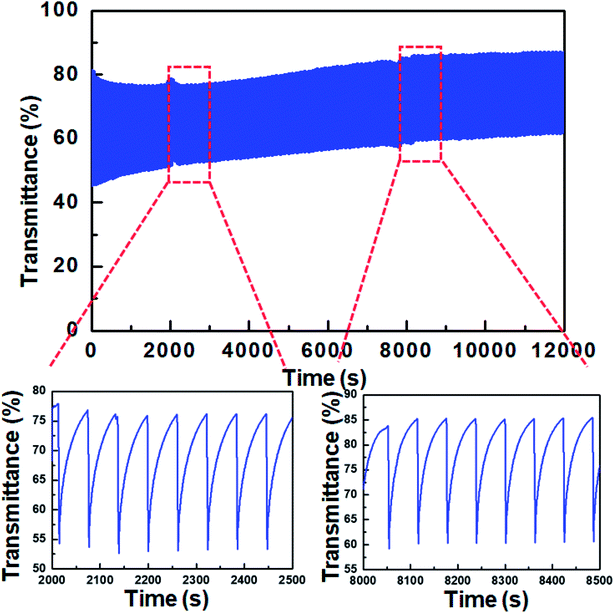 | ||
| Fig. 7 Variation of transmittance at 700 nm for the WO3 ECD containing 0.03 M TTF during coloration/bleaching cyclic test. | ||
4. Conclusions
In this work, TTF was directly dissolved in the electrolyte and served as the anodic species for WO3-based ECDs. Electrochemical characteristics of TTF were investigated through CV experiments, which revealed good reversibility of redox reactions of TTF. In addition, a redox potential of TTF lower than those of other electrolyte-soluble anodic materials such as Fc and dmFc was measured. As a result, low-voltage WO3 ECDs (e.g. coloration voltage ∼ −0.3 V) were fabricated with TTF-containing electrolytes. We examined effects of TTF concentrations on the device performance. When a low concentration of TTF was employed, the coloration of WO3 layer was insufficient. On the other hand, at a concentration of 0.05 M TTF, the ECD exhibited a larger transmittance difference between colored and bleached states, faster coloration, and higher coloration efficiency. However, the device could not return to its original state due to the TTF aggregates interfering with proper electrochemical reactions. Overall, these results imply that TTF can be a promising electrolyte-soluble anodic species for high-performance WO3 ECDs, when the appropriate concentration of TTF is employed.Conflicts of interest
The authors declare no conflicts of interest.Acknowledgements
This research was supported by X-mind Corps program of National Research Foundation of Korea (NRF) funded by the Ministry of Science, ICT (NRF-2017H1D8A1030582). This research was supported by “Human Resources Program in Energy Technology” of the Korea Institute of Energy Technology Evaluation and Planning (KETEP), granted financial resource from the Ministry of Trade, Industry and Energy, Republic of Korea (No. 20174030201760).Notes and references
- P. M. S. Monk, The Viologens: Physicochemical Properties, Synthesis and Applications of the Salts of 4,4'-Bipyridine, J. Wiley & Sons, Chichester, UK, 1998 Search PubMed.
- P. M. S. Monk, R. J. Mortimer and D. R. Rosseinsky, Electrochromism: Fundamentals and Applications, VCH, Weinheim, 1995 Search PubMed.
- R. J. Mortimer, Chem. Soc. Rev., 1997, 26, 147–156 RSC.
- T. Y. Yun, X. Li, S. H. Kim and H. C. Moon, ACS Appl. Mater. Interfaces, 2018, 10, 43993–43999 CrossRef CAS PubMed.
- Y. Kim, M. Han, J. Kim and E. Kim, Energy Environ. Sci., 2018, 11, 2124–2133 RSC.
- M. Zhu, Y. Huang, Y. Huang, W. Meng, Q. Gong, G. Li and C. Zhi, J. Mater. Chem. A, 2015, 3, 21321–21327 RSC.
- H. H. Chou, A. Nguyen, A. Chortos, J. W. F. To, C. Lu, J. Mei, T. Kurosawa, W. G. Bae, J. B.-H. Tok and Z. Bao, Nat. Commun., 2015, 6, 8011 CrossRef CAS PubMed.
- H. Park, D. S. Kim, S. Y. Hong, C. Kim, J. Y. Yun, S. Y. Oh, S. W. Jin, Y. R. Jeong, G. T. Kim and J. S. Ha, Nanoscale, 2017, 9, 7631–7640 RSC.
- S. Zhang, S. Cao, T. Zhang, A. Fisher and J. Y. Lee, Energy Environ. Sci., 2018, 11, 2884–2892 RSC.
- S. Lin, X. Bai, H. Wang, H. Wang, J. Song, K. Huang, C. Wang, N. Wang, B. Li, M. Lei and H. Wu, Adv. Mater., 2017, 29, 1703238 CrossRef PubMed.
- G. Cai, P. Darmawan, X. Cheng and P. S. Lee, Adv. Energy Mater., 2017, 7, 1602598 CrossRef.
- S. Poongodi, P. S. Kumar, Y. Masuda, D. Mangalaraj, N. Ponpandian, C. Viswanathan and S. Ramakrishna, RSC Adv., 2015, 5, 96416–96427 RSC.
- Z. Wang, M. Zhu, S. Gou, Z. Pang, Y. Wang, Y. Su, Y. Huang, Q. Weng, O. G. Schmidt and J. Xu, ACS Appl. Mater. Interfaces, 2018, 10, 31697–31703 CrossRef CAS PubMed.
- K. Mallikarjuna and H. Kim, ACS Appl. Mater. Interfaces, 2019, 11, 1969–1978 CrossRef CAS PubMed.
- H. C. Moon, T. P. Lodge and C. D. Frisbie, Chem. Mater., 2015, 27, 1420–1425 CrossRef CAS.
- H. C. Lu, S. Y. Kao, T. H. Chang, C. W. Kung and K. C. Ho, Sol. Energy Mater. Sol. Cells, 2016, 147, 75–84 CrossRef CAS.
- J. H. Huang, C. Y. Yang, C. Y. Hsu, C. L. Chen, L. Y. Lin, R. R. Wang, K. C. Ho and C. W. Chu, ACS Appl. Mater. Interfaces, 2009, 1, 2821–2828 CrossRef CAS PubMed.
- G. J. Stec, A. Lauchner, Y. Cui, P. Nordlander and N. J. Halas, ACS Nano, 2017, 11, 3254–3261 CrossRef CAS PubMed.
- H. Oh, D. G. Seo, T. Y. Yun, S. B. Lee and H. C. Moon, Org. Electron., 2017, 51, 490–495 CrossRef CAS.
- H. Oh, D. G. Seo, T. Y. Yun, C. Y. Kim and H. C Moon, ACS Appl. Mater. Interfaces, 2017, 9, 7658–7665 CrossRef CAS PubMed.
- K.-W. Kim, H. Oh, J. H. Bae, H. Kim, H. C. Moon and S. H. Kim, ACS Appl. Mater. Interfaces, 2017, 9, 18994–19000 CrossRef CAS PubMed.
- D. G. Seo and H. C. Moon, Adv. Funct. Mater., 2018, 28, 1706948 CrossRef.
- W. Lu, A. G. Fadeev, B. Qi and B. R. Mattes, J. Electrochem. Soc., 2004, 151, H33–H39 CrossRef CAS.
- H. W. Heuer, R. Wehrmann and S. Kirchmeyer, Adv. Funct. Mater., 2002, 12, 89–94 CrossRef CAS.
- S. A. Sapp, G. A. Sotzing, J. L. Reddinger and J. R. Reynolds, Adv. Mater., 1996, 8, 808–811 CrossRef CAS.
- B. C. Thompson, P. Schottland, K. Zong and J. R. Reynolds, Chem. Mater., 2000, 12, 1563–1571 CrossRef CAS.
- A. F. Akbulatov, S. Y. Luchkin, L. A. Frolova, N. N. Dremova, K. L. Gerasimov, I. S. Zhidkov, D. V. Anokhin, E. Z. Kurmaev, K. J. Stevenson and P. A. Troshin, J. Phys. Chem. Lett., 2017, 8, 1211–1218 CrossRef CAS PubMed.
- W. Guo, J. J. Li, A. Wang and X. Peng, J. Am. Chem. Soc., 2003, 125, 3901–3909 CrossRef CAS PubMed.
- X. Shen, L. Zhu, C. Huang, H. Tang, Z. Yu and F. Deng, J. Mater. Chem., 2009, 19, 4843–4851 RSC.
- J. Bae, H. Kim, H. C. Moon and S. H. Kim, J. Mater. Chem. C, 2016, 4, 10887–10892 RSC.
- J. Bae, D. G. Seo, S. M. Park, K. T. Park, H. Kim, H. C. Moon and S. H. Kim, J. Phys. D: Appl. Phys., 2017, 50, 465105 CrossRef.
- C. Yan, W. Kang, J. Wang, M. Cui, X. Wang, C. Y. Foo, K. J. Chee and P. S. Lee, ACS Nano, 2014, 8, 316–322 CrossRef CAS PubMed.
- J. Wang, E. Khoo, P. S. Lee and J. Ma, J. Phys. Chem. C, 2008, 112, 14306–14312 CrossRef CAS.
- L. Xiao, Y. Lv, W. Dong, N. Zhang and X. Liu, ACS Appl. Mater. Interfaces, 2016, 8, 27107–27114 CrossRef CAS PubMed.
- G. Cai, M. Cui, V. Kumar, P. Darmawan, J. Wang, X. Wang, A. L.-S. Eh, K. Qian and P. S. Lee, Chem. Sci., 2016, 7, 1373–1382 RSC.
- J. Zhang, J. P. Tu, D. Zhang, Y. Q. Qiao, X. H. Xia, X. L. Wang and C. D. Gu, J. Mater. Chem., 2011, 21, 17316–17324 RSC.
- G. F. Cai, D. Zhou, Q. Q. Xiong, J. H. Zhang, X. L. Wang, C. D. Gu and J. P. Tu, Sol. Energy Mater. Sol. Cells, 2013, 117, 231–238 CrossRef CAS.
- T. Y. Yun, X. Li, J. Bae, S. H. Kim and H. C. Moon, Mater. Des., 2019, 162, 45–51 CrossRef CAS.
- M. Bendikov and F. Wudl, Chem. Rev., 2004, 104, 4891–4945 CrossRef CAS PubMed.
- N. Martín, Chem. Commun., 2013, 49, 7025–7027 RSC.
- S. Mishra, P. Yogi, S. K. Saxena, S. Roy, P. R. Sagdeo and R. Kumar, J. Mater. Chem. C, 2017, 5, 9504–9512 RSC.
- K. H. Lee, M. S. Kang, S. Zhang, Y. Gu, T. P. Lodge and C. D. Frisbie, Adv. Mater., 2012, 24, 4457–4462 CrossRef CAS PubMed.
- H. C. Moon, T. P. Lodge and C. D. Frisbie, J. Mater. Chem. C, 2016, 4, 8448–8453 RSC.
- T. Y. Yun and H. C. Moon, Org. Electron., 2018, 56, 178–185 CrossRef CAS.
- Y. Alesanco, A. Viñuales, J. Rodriguez and R. Tena-Zaera, Materials, 2018, 11, 414 CrossRef PubMed.
- A. A. Argun, P.-H. Aubert, B. C. Thompson, I. Schwendeman, C. L. Gaupp, J. Hwang, N. J. Pinto, D. B. Tanner, A. G. MacDiarmid and J. R. Reynolds, Chem. Mater., 2004, 16, 4401–4412 CrossRef CAS.
Footnotes |
| † Electronic supplementary information (ESI) available. See DOI: 10.1039/c9ra02840d |
| ‡ These authors contributed equally to this work. |
| This journal is © The Royal Society of Chemistry 2019 |

