 Open Access Article
Rapid prototyping of a novel and flexible paper based oxygen sensing patch via additive inkjet printing process†
Dinesh Maddipatla *a,
Binu B. Narakathua,
Manuel Ochoa
 b,
Rahim Rahimi
 b,
Jiawei Zhoub,
Chang K. Yoonb,
Hongjie Jiang
 b,
Hazim Al-Zubaidic,
Sherine O. Obarec,
Michael A. Ziegerd,
Babak Ziaieb and
Massood Z. Atashbara
aDepartment of Electrical and Computer Engineering, Western Michigan University, Michigan, USA. E-mail: dinesh.maddipatla@wmich.edu
bSchool of Electrical and Computer Engineering, Purdue University, Indiana, USA
cDepartment of Chemistry, Western Michigan University, Michigan, USA
dIndiana University School of Medicine, Indianapolis, Indiana, USA
First published on 23rd July 2019
Abstract
A novel and flexible oxygen sensing patch was successfully developed for wearable, industrial, food packaging, pharmaceutical and biomedical applications using a cost-efficient and rapid prototypable additive inkjet print manufacturing process. An oxygen sensitive ink was formulated by dissolving ruthenium dye and ethyl cellulose polymer in ethanol in a 1![[thin space (1/6-em)]](https://www.rsc.org/images/entities/char_2009.gif) :
:![[thin space (1/6-em)]](https://www.rsc.org/images/entities/char_2009.gif) 1
1![[thin space (1/6-em)]](https://www.rsc.org/images/entities/char_2009.gif) :
:![[thin space (1/6-em)]](https://www.rsc.org/images/entities/char_2009.gif) 98 (w/w/w) ratio. The patch was fabricated by depositing the oxygen sensitive ink on a flexible parchment paper substrate using an inkjet printing process. A maximum absorbance from 430 nm to 480 nm and a fluorescence of 600 nm was observed for the oxygen sensitive ink. The capability of the oxygen sensitive patch was investigated by measuring the fluorescence quenching lifetime of the printed dye for varying oxygen concentration levels. A fluorescence lifetime decay (τ) from ≈4 μs to ≈1.9 μs was calculated for the printed oxygen sensor patch, for oxygen concentrations varying from ≈5 mg L−1 to ≈25 mg L−1. A sensitivity of 0.11 μs mg L−1 and a correlation coefficient of 0.9315 was measured for the printed patches. The results demonstrated the feasibility of employing an inkjet printing process for the rapid prototyping of flexible and moisture resistant oxygen sensitive patches which facilitates a non-invasive method for monitoring oxygen and its concentration levels.
98 (w/w/w) ratio. The patch was fabricated by depositing the oxygen sensitive ink on a flexible parchment paper substrate using an inkjet printing process. A maximum absorbance from 430 nm to 480 nm and a fluorescence of 600 nm was observed for the oxygen sensitive ink. The capability of the oxygen sensitive patch was investigated by measuring the fluorescence quenching lifetime of the printed dye for varying oxygen concentration levels. A fluorescence lifetime decay (τ) from ≈4 μs to ≈1.9 μs was calculated for the printed oxygen sensor patch, for oxygen concentrations varying from ≈5 mg L−1 to ≈25 mg L−1. A sensitivity of 0.11 μs mg L−1 and a correlation coefficient of 0.9315 was measured for the printed patches. The results demonstrated the feasibility of employing an inkjet printing process for the rapid prototyping of flexible and moisture resistant oxygen sensitive patches which facilitates a non-invasive method for monitoring oxygen and its concentration levels.
1. Introduction
Oxygen concentration measurements are important parameters that require continuous monitoring for several important applications including wearable devices, food production and packaging, pharmaceutical development, sewage management, beverage production, oil/gasoline refining and biomedical devices.1–5 As an example, in biomedical applications, the determination of oxygen concentration in blood and wounds is a critical factor for physicians while evaluating a patient's health condition.6 Typically, the oxygen concentrations in the liquid and gas phases are monitored by employing electrochemical or optical oxygen sensors. Recently, advances have been made on the development of optical sensors for oxygen measurements due to their rapid response time, non-consumption of oxygen, high sensitivity and ability to continuously monitor oxygen concentrations non-invasively in remote, harsh or in vivo environments.7,8 The optical-based sensors typically contain an oxygen sensitive patch and an optical probe. For non-invasive oxygen measurements, oxygen sensitive patches with fluorescent dyes such as ruthenium and/or palladium complexes are placed in the location where the oxygen concentration must be determined. The optical probes are used to excite the dyes using UV/visible light and the emitted fluorescence is quenched in proportion to the oxygen concentration in the surrounding environment.9–11Currently, a common method to fabricate the oxygen sensitive patches are by immobilizing fluorescent dyes in polymers or sol–gel matrix. Then, conventional ink deposition processes such as dip coating or spin coating are employed to deposit the sol–gel matrix with immobilized fluorescent dyes on rigid, transparent and porous glass bead structures.10–13 Another method that has been used to fabricate oxygen sensitive patches are by embedding fluorescent dyes in silicone and then subjecting it to thermal annealing, under a nitrogen flux at high temperatures.14 These methods are relatively costly as well as complex and are not suitable for rapid prototyping and mass production. Also, these oxygen sensor patches lack mechanical flexibility, conformability, chemical and moisture resistance, and are prone to discoloring effects on exposure to visible or ultraviolet light. The drawbacks associated with conventional oxygen sensing patches can be overcome by employing an additive printing process to fabricate flexible, light weight and cost-efficient oxygen sensitive patches on a flexible substrate.
Printed electronics (PE) is an emerging area in the field of flexible and hybrid sensors for manufacturing electronic sensing devices such as organic thin film transistors, RFID tags, solar cells, strain sensors and electrochemical sensors for applications in biomedical, automotive, environmental, military and civil infrastructure industries.15–19 PE uses conventional additive print manufacturing processes such as inkjet, gravure, flexography, aerosol jet and screen printing.20–30 The printing processes requires low temperature and minimal resources for its operation and provides roll-to roll (R2R) fabrication capabilities, thus facilitating high volume manufacturing of sensing devices with less complexity and relatively lower production costs.31 Among these printing processes, inkjet printing, which is a non-contact printing process, is the most widely used fabrication process with rapid prototypable capabilities since it does not require any mask or image carrier, unlike many other printing processes. Therefore, the use of inkjet printing for the development of oxygen sensing patches on flexible substrates is bound to advance the field of oxygen sensing.
In this work, a simple paper-based low cost and rapid prototypable oxygen sensing patch was developed for the first time using inkjet printing. The oxygen sensing patch was fabricated by depositing oxygen sensitive ink on a parchment paper substrate using inkjet printing process. The oxygen sensitive ink was formulated by dissolving ruthenium dye and ethyl cellulose polymer in ethanol in a 1![[thin space (1/6-em)]](https://www.rsc.org/images/entities/char_2009.gif) :
:![[thin space (1/6-em)]](https://www.rsc.org/images/entities/char_2009.gif) 1
1![[thin space (1/6-em)]](https://www.rsc.org/images/entities/char_2009.gif) :
:![[thin space (1/6-em)]](https://www.rsc.org/images/entities/char_2009.gif) 98 (w/w/w) ratio. Ruthenium complex was used as an oxygen indictor due to its long excitation lifetimes and relatively better oxygen quenching efficiency.32,33 The ethyl cellulose was chosen as a binder and an encapsulant since it provides moisture resistance, excellent film formation, adhesion, high mechanical flexibility and greater film coverage with complete solubility in ethanol solvent.34,35 Parchment paper, which is biocompatible and non-toxic, was chosen as a substrate since it provides flexibility, fluid resistance and structural stability while simultaneously offering printability and gas permeability.36,37 The capability of the oxygen sensitive patch was investigated by measuring the fluorescence quenching lifetime of the printed dye for monitoring varying oxygen concentration levels.
98 (w/w/w) ratio. Ruthenium complex was used as an oxygen indictor due to its long excitation lifetimes and relatively better oxygen quenching efficiency.32,33 The ethyl cellulose was chosen as a binder and an encapsulant since it provides moisture resistance, excellent film formation, adhesion, high mechanical flexibility and greater film coverage with complete solubility in ethanol solvent.34,35 Parchment paper, which is biocompatible and non-toxic, was chosen as a substrate since it provides flexibility, fluid resistance and structural stability while simultaneously offering printability and gas permeability.36,37 The capability of the oxygen sensitive patch was investigated by measuring the fluorescence quenching lifetime of the printed dye for monitoring varying oxygen concentration levels.
2. Experimental
2.1 Chemicals and materials
Tris(4,7-diphenyl-1,10-phenanthroline) ruthenium(II) dichloride from Alfa Aesar® was used as the oxygen sensing dye and ETHOCEL™ (ethyl cellulose polymer) from Dow® chemical company was used as the binder. Ethanol (ACS spectrophotometric grade) and sodium sulfite (Na2SO3) from the Sigma-Aldrich® Company was used as solvent and oxygen scavenger, respectively. Parchment paper from Reynolds was employed as a flexible substrate.2.2 Ink preparation
The oxygen sensitive ink consists of ruthenium dye, ethyl cellulose polymer and ethanol solvent in a 1![[thin space (1/6-em)]](https://www.rsc.org/images/entities/char_2009.gif) :
:![[thin space (1/6-em)]](https://www.rsc.org/images/entities/char_2009.gif) 1
1![[thin space (1/6-em)]](https://www.rsc.org/images/entities/char_2009.gif) :
:![[thin space (1/6-em)]](https://www.rsc.org/images/entities/char_2009.gif) 98 (w/w/w) ratio. Initially, 78.9 mg of ruthenium powder was dissolved in 10 mL (7.89 g) of ethanol by mixing on a hotplate using a magnetic stirrer for 3 hours, at room temperature. Then, the oxygen sensitive ink was prepared by adding 78.9 mg of ethyl cellulose to the ruthenium solution. The mixture of ethyl cellulose and ruthenium solution was stirred at 700 rpm on a hotplate for 20 hours, at room temperature to obtain homogeneity.
98 (w/w/w) ratio. Initially, 78.9 mg of ruthenium powder was dissolved in 10 mL (7.89 g) of ethanol by mixing on a hotplate using a magnetic stirrer for 3 hours, at room temperature. Then, the oxygen sensitive ink was prepared by adding 78.9 mg of ethyl cellulose to the ruthenium solution. The mixture of ethyl cellulose and ruthenium solution was stirred at 700 rpm on a hotplate for 20 hours, at room temperature to obtain homogeneity.
2.3 Apparatus
The oxygen sensitive ink was dried to evaporate the ethanol solvent and an aliquot of the dried sample was dissolved in liquid chromatography mass spectrometry (LC-MS) grade methanol solvent resulting in a solution with concentration of 1 × 10⁻⁶ M. Mass spectrometry analysis was performed on the solution using a Waters Synapt G1 HDMS electron-spray ionization with a time of flight detector (ESI-TOF). In addition, the dried sample was dissolved in deuterated chloroform (CDCl3) for nuclear magnetic resonance (NMR) spectroscopy analysis using JEOL JNM-ECP400 instrument. The absorption and fluorescence spectroscopy was carried out for oxygen sensitive ink using Cary 50 UV visible absorbance spectrometer and FLS920 fluorescence spectrometer from Edinburgh Instruments, respectively.2.4 Substrate preparation
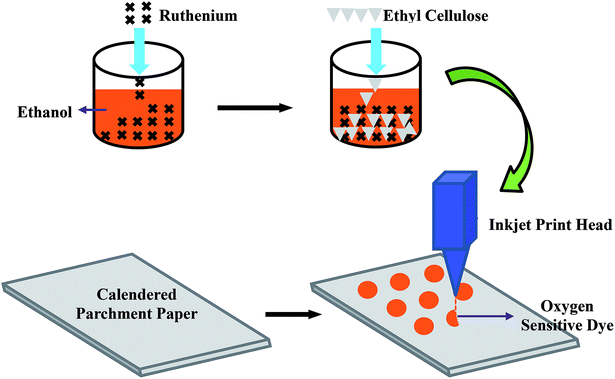
The parchment paper substrate has a very rough surface and to make it suitable for printing, a consistent and smoother surface is required. To obtain a smoother surface, the parchment paper substrate was calendered as illustrated in Fig. 1. The parchment paper, which had a surface roughness of 8.7 ± 1.7 μm (Fig. 2(a)) measured using a Bruker Contour GT-K interferometer, was calendered between the steel rollers of a calendering machine (The Wheeler Roll Co) with an applied pressure of 35 Psi. An average roughness of 5.5 ± 0.4 μm (Fig. 2(b)) was measured for the calendered parchment paper substrate resulting in a 37% decrease in roughness which implies a smoother surface that is compatible for printing. Even a much smoother surface can be obtained by calendering the paper substrate multiple times.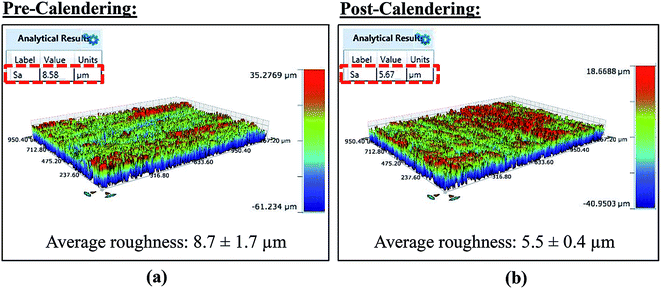 | ||
| Fig. 2 The surface roughness of parchment paper (a) before and (b) after calendering process, measured using Bruker Contour GT-K interferometer. | ||
2.5 Inkjet printing
The fabrication process of the oxygen sensitive patch, during which the prepared oxygen sensitive ink was deposited on the calendered parchment paper substrate, is depicted in Fig. 3. Initially, in order to achieve smooth printing, any large particles that may have agglomerated in the ink solutions were filtered out using a 25 mm disposable Whatman® syringe filter that has a poly vinylidene difluoride filter (PVDF) filter membrane of 0.45 μm pore size. The filtered ink was then loaded into a Dimatix™ DMC-11610 cartridge (10 pl). Finally, the oxygen sensitive ink was inkjet printed with an actuation voltage of 40 V and 5 kHz firing frequency on the parchment paper substrate in an array of 3 mm circular spots, with 10 μm drop spacing and 2540 dpi resolution, using a FUJIFILM Dimatix™ material deposition inkjet printer (DMP 2831). The printed ruthenium layer was cured on the platen of the inkjet printer at 55 °C. A photograph of the inkjet printed oxygen sensitive dye array is shown in Fig. 4(a). A scanning electron microscope (field-emission SEM, Hitachi S-4800) image of the printed patch shows a smoother film coating of the oxygen sensitive dye on the parchment paper fibers (Fig. 4(b)).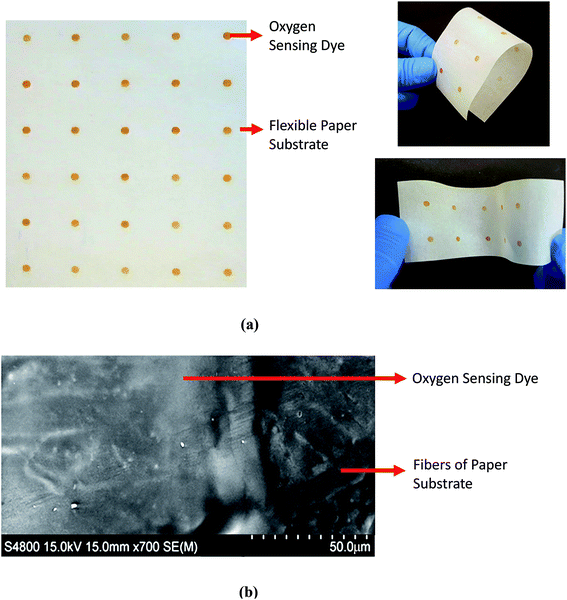 | ||
| Fig. 4 (a) Photographs showing an array of inkjet printed oxygen sensitive patches and (b) SEM image of the oxygen sensitive dye printed on flexible parchment paper. | ||
2.6 Test setup
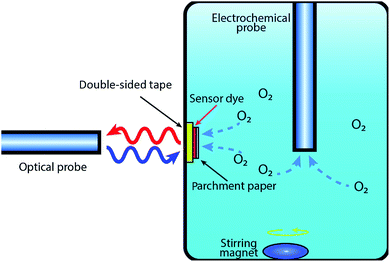
The printed oxygen sensor patch was attached to the inner wall of a water container, with the printed side facing outside, using transparent double-sided tape for optical measurements as shown in Fig. 5. For comparison purposes, oxygen measurements were performed using both the printed oxygen sensor patches and an electrochemical probe. A bifurcated optical fiber probe (RE-BIFBORO-2) connected to a NeoFox-GT fluorimeter (470 nm excitation wavelength and 600 nm emission wavelength) was placed about 2 mm away from the wall of the water container and positioned perpendicular to the printed oxygen sensitive patch. The electrochemical probe was dipped into the water deep enough so that an embedded thermal sensor, within the probe, was completely submerged under the water. The optical and electrochemical probes were calibrated before the measurement using a two-point calibration method (0% and 100% saturated water). All measurements were recorded at room temperature.3. Results and discussion
In the inkjet printing process, to obtain proper jetting of any ink and for stable drop formation, the Z-number which is a dimensionless constant and a measure of density, surface tension and viscosity should be in the range of 2 to 10.38 The Z-number is mathematically calculated using eqn (1).38
 | (1) |
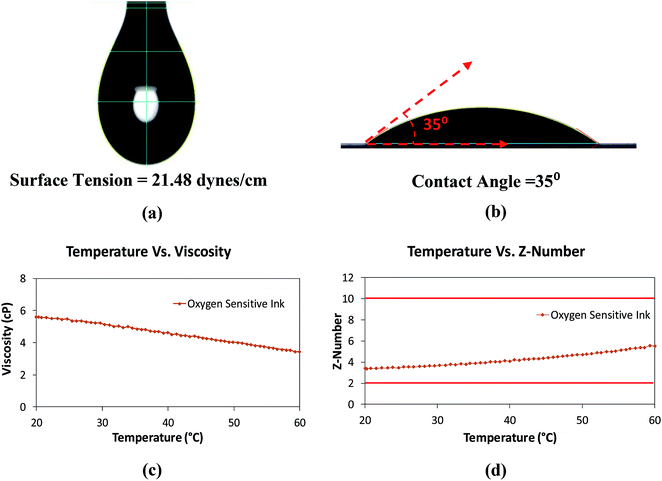
A surface tension of 21.48 ± 0.12 dynes cm−1, for the oxygen sensitive ink, was measured with a goniometer (First Ten Angstroms FTA-200) using pendant drop method (Fig. 6(a)). A contact angle of 34.3 ± 0.9 degrees, for the oxygen sensitive ink on parchment paper, was also measured with the FTA 200 goniometer using equilibrium contact angle method (Fig. 6(b)), thus showing good wetting properties. The measured density of the ink was 0.78 g mL−1. The viscous behavior of the ink was determined using AR 2000 rheometer from TA® Instruments at a constant shear rate of 1000 (s−1). The viscosity of the ink was decreased from 5.6 cP to 3.4 cP over the temperature range of 20 °C to 60 °C (Fig. 6(c)). Z-numbers ranging from 3.4 to 5.5 was calculated for the ink using eqn (1) (Fig. 6(d)). From the Z-numbers, it was evident that the oxygen sensitive ink was compatible for inkjet printing process at room temperature.
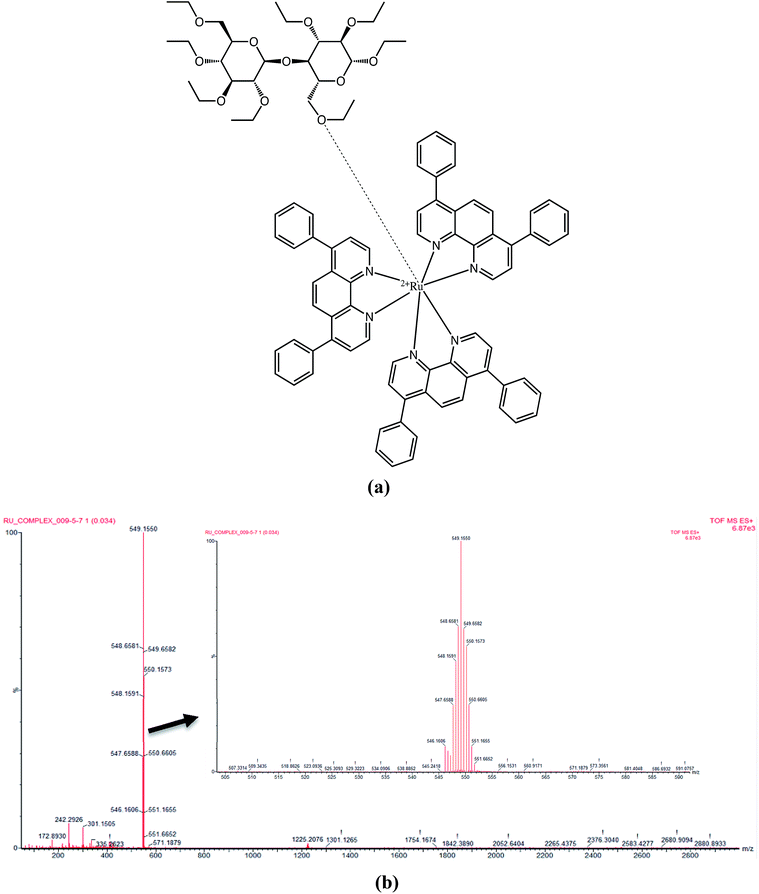
The ESI-TOF shows the coordination forces between the ruthenium complex and the ethyl cellulose, via electrostatic interactions including hydrogen bonding and London dispersion forces as shown in Fig. 7(a). According to mass spectrometry results shown in Fig. 7(b), the highest abundant m/z peak [M + 3H]3+ was obtained for the ruthenium complex (M. wt = 1169.20 g mol−1) and ethyl cellulose (M. wt = 475.513 g mol−1) at 549.1550 indicating the protonation of three nitrogen atoms.
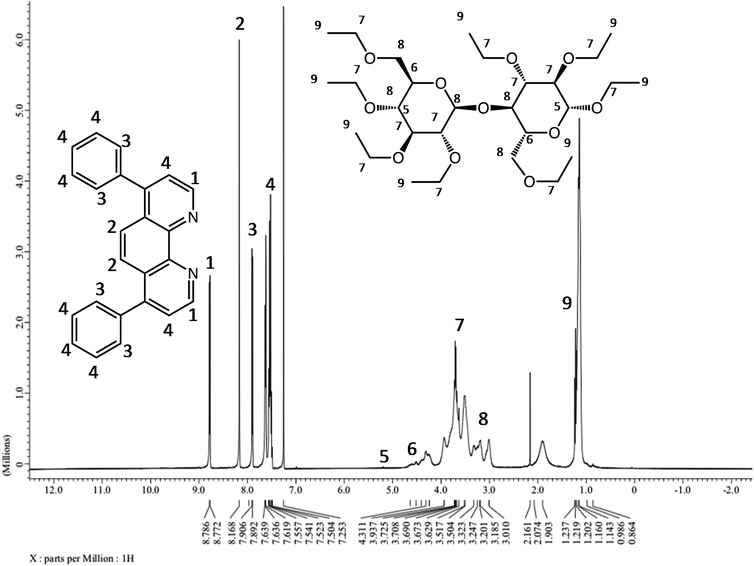
In order to confirm that the ruthenium complex and the ethyl cellulose were bound through hydrogen bonding, 1H NMR was carried out on a JEOL JNM-ECP400 instrument operating at 400 MHz using deuterated solvents. Fig. 8 shows the chemical shifts for all the existing and corresponding proton locations. According to the 1H NMR spectrum, these chemical shifts correspond to the protons of the polymer between 0.95–5.2 ppm indicating electrostatic forces with the ruthenium complex and that no chemical bonds were formed between the molecule and polymer. The broadening in the 1H NMR chemical shifts for ethyl cellulose, indicates the existence of only electrostatic interaction including hydrogen bonds between the polymer and the ruthenium complex. Both the ESI-TOF and the 1H NMR revealed that the ruthenium complex was bound to the ethyl cellulose polymer via electrostatic interactions.
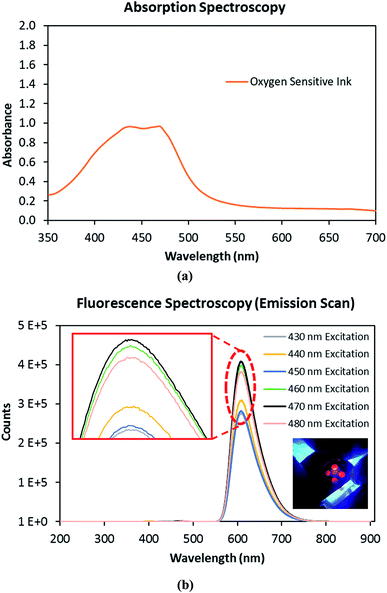
Fig. 9(a) shows the absorption spectrum of the oxygen sensitive ink, which absorbs in the visible region of the electromagnetic spectrum. A maximum absorbance was observed between the wavelengths of 430 nm to 480 nm for the oxygen sensitive ink. Therefore, a fluorescence spectra of the oxygen sensitive ink was measured for the excitation wavelengths ranging from 430 nm to 480 nm, in steps of 10 nm, using fluorescence spectrometer (Fig. 9(b)). A maximum fluorescence intensity was obtained at a wavelength of 600 nm, for an excitation wavelength of 470 nm. From the absorption and fluorescence spectra results, it was concluded that a fluorimeter with an excitation wavelength of 470 nm and emission wavelength of 600 nm was required for the oxygen sensing measurements.
Initially, the water was deoxygenated by pumping nitrogen gas into the water for over 30 minutes. After the deoxygenation process, the water was tested for any remaining amount of trace oxygen with the electrochemical probe. An oxygen concentration of 0.2 mg L−1 was measured, at room temperature, which is almost 98% lower when compared to “normal” (untreated) water that typically contains oxygen concentration of ≈9 mg L−1. The capability of the printed patch was then investigated by measuring artificially introduced oxygen concentrations varying from ≈5 mg L−1 to ≈25 mg L−1 (limit of the electrochemical probe) in the deoxygenated water and the corresponding fluorescent lifetime decay (τ) of the printed dye. Oxygen was injected into the deoxygenated water through external tubing (up to ∼35 mg L−1) and an equilibrium of oxygen concentration was maintained by continuously stirring the water using a magnetic stirrer at 150 rpm.
The fluorescence lifetime decay (τ) of the printed oxygen sensitive patch towards varying dissolved oxygen (DO) concentrations is shown in Fig. 10. It was observed that the fluorescence lifetime decreased from ≈4 μs to ≈1.9 μs as the oxygen concentration increased from ≈5 mg L−1 to ≈25 mg L−1. A sensitivity of 0.11 μs mg L−1 and a correlation coefficient of 0.9315 was measured for the printed patches. In addition, a stability test (Fig. 11) was performed to evaluate the fluorescence lifetime decay of the printed patches for long term oxygen sensing measurements. The container in which the patch was placed, was sealed to reduce the flow of oxygen in to the container from the surrounding environment. The patches were subjected to both hypoxia (0% DO) and 21% DO conditions (≈9 mg L−1) separately for a period of 7 hours. A change in fluorescence lifetime decay (Δτ) of 0.10 ± 0.01 μs and 0.16 ± 0.04 μs was observed for hypoxia and 21% DO conditions, respectively. This resulted in a relative fluorescence lifetime decay (Δτ/τ) of 3.77 ± 0.28% and 6.99 ± 1.32% for 0% and 21% DO conditions, respectively (Fig. 11). The fluorescence lifetime decay can be attributed to the degradation of the printed oxygen sensitive dye as well as the presence of a minute quantity of oxygen in the container. Overall, the degradation of the dye is relatively very minimal for both hypoxia and 21% DO conditions resulting in a reliable sensing over a period of 7 hours.
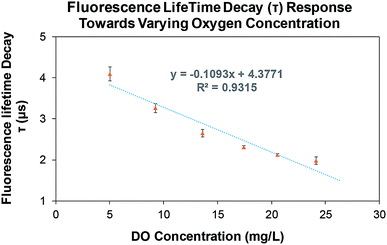 | ||
| Fig. 10 Fluorescence lifetime decay response of printed oxygen sensor patches; error bars are the standard deviation (n = 3). | ||
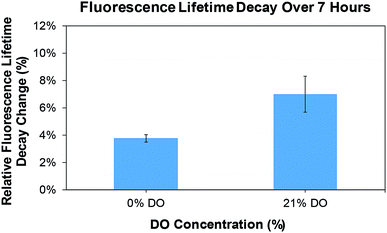 | ||
| Fig. 11 Fluorescence decay of printed oxygen sensor patches for hypoxic and 21% DO concentrations over a period of 7 hours; error bars are the standard deviation (n = 3). | ||
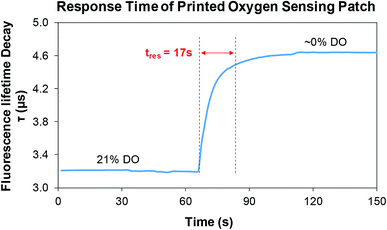
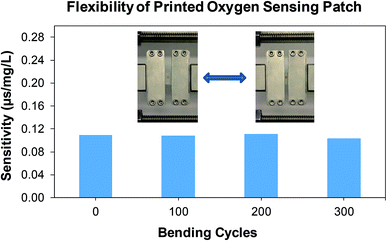
Fig. 12 shows the response time (tres) of the printed oxygen sensor patch. The DO content was decreased from 21% to ∼0% by mixing Na2SO3 in to the water and a response time of 17 s was obtained for the oxygen sensor patch. A comparison summary of the printed oxygen sensor patch with some reported oxygen sensors is shown in Table 1. It can be noticed that the printed patch has an appreciable response time and sensitivity when compared to some of the reported oxygen sensors40–46. In addition, the flexibility (mechanical stability upon bending) and robustness of the printed patch was evaluated by subjecting the printed patches to various cyclic bending tests (0, 00, 200, and 300) using a micromanipulator (Universal Test Machines – eXpert 4000, ADMET), with a duty cycle of 50% and time period of 10 s (Fig. 13). The printed oxygen patch was attached between a set of horizontally movable metals clamps and was subjected to a bending angle of 180°, during the cyclic tests. An average sensitivity of ≈0.11 μs mg L−1 was measured for the printed patches after bending tests which shows the robustness of the printed patch. From the results, it is evident that the bending does not have any significant effect on the sensitivity of the printed patch.
| Oxygen sensitive material | Mechanism | Wavelength (excitation/emission) | Response time | Sensitivity | Ref. |
|---|---|---|---|---|---|
| Ruthenium–Ag NP/PMMA | Fluorescence intensity | 450 nm/608 nm | 45 s | 0.019 (I0/I) | 40 |
| (0–15 mg L−1) | |||||
| Platinum complex | Fluorescence intensity | 390 nm/650 nm | >4 min | 0.0113 (I0/I) | 41 |
| (0–100% O2) | |||||
| Ruthenium–PDMS | Fluorescence intensity | 425 nm/620 nm | — | 0.0075 mg L−1 | 42 |
| (0–25 mg L−1) | |||||
| Platinum(II)–porphyrin | Phosphorescence/fluorescence intensity | 514 nm, 405 nm/630 nm | — | 0.0148 (R0/R) | 43 |
| 0.01753 (τ0/τ) | |||||
| (0–8 mg L−1) | |||||
| Platinum–polystyrene/PDMS | Phosphorescence intensity | 405 nm/650 nm | 7.5 s | ∼0.03 (I0/I) | 44 |
| (5–25 mg L−1) | |||||
| Ruthenium-sol–gel | Fluorescence intensity | 460 nm/597 nm | — | 0.0102 (I0/I) | 45 |
| (0–45 mg L−1) | |||||
| RedEye® patch (ruthenium-fluorinated siloxane) | Fluorescence lifetime | 470 nm/600 nm | 30–45 s | ∼0.02 μs mg L−1 (τ) | 46 |
| (0–100% O2) | |||||
| Ruthenium–EC complex | Fluorescence lifetime | 470 nm/600 nm | 17 s | 0.11 μs mg L−1 (τ) or 0.057 (τ0/τ) | (Present work) |
| (5–25 mg L−1) |
4. Conclusion
A novel printed oxygen sensing patch were successfully fabricated by depositing the oxygen sensitive ink on a flexible parchment paper substrate using inkjet printing process. The fabricated patch provides flexibility, conformability and facilitates an optical and non-invasive method of sensing oxygen and its concentration levels for applications in the medical, food packaging, and pharmaceutical industries. A novel oxygen sensitive ink was formulated and characterized using mass spectrometry, NMR, absorption and fluorescence spectroscopy. The mass spectroscopy and NMR results showed the electrostatic interaction based bonding between the ruthenium complex and the ethyl cellulose. The maximum absorbance and fluorescence was observed from 430 nm to 480 nm and 600 nm, respectively for the oxygen sensitive ink. The capability of the printed oxygen sensitive patch was investigated by measuring the fluorescence quenching life time of the printed dye for varying oxygen concentration levels. A fluorescent life time decay from ≈4 μs to ≈1.9 μs was calculated for the printed oxygen sensor patches for oxygen concentrations varying from ≈5 mg L−1 to ≈25 mg L−1. A sensitivity of 0.11 μs mg L−1 and a correlation coefficient of 0.9315 was measured for the printed patch. The stability tests resulted in a relative fluorescence lifetime decay (Δτ/τ) of 3.77 ± 0.28% and 6.99 ± 1.32% for the 0% and 21% DO conditions, respectively. The results demonstrated the feasibility of employing additive inkjet printing process for the development of flexible and moisture resistant oxygen sensitive patches. Future work includes the optimization of the oxygen sensitive patches performance by varying the ruthenium complex to binder ratio as well as investigating the effect of varying temperatures. In addition, the performance of patches towards sensing of oxygen in gas phase will also be investigated.Conflicts of interest
There are no conflicts to declare.Acknowledgements
This work was supported by NextFlex under Air Force Research Laboratory (AFRL) Cooperative Agreement No. FA8650-15-2-5401.References
- R. Xu, Y. Wang, X. Duan, K. Lu, D. Micheroni, A. Hu and W. Lin, J. Am. Chem. Soc., 2016, 138(7), 2158–2161 CrossRef CAS PubMed
.
- L. Tolosa, Y. Kostov, P. Harms and G. Rao, Biotechnol. Bioeng., 2002, 80(5), 594–597 CrossRef CAS PubMed
.
- S. Santoro, A. J. Moro, C. Portugal, J. G. Crespo, J. C. Lima and I. M. Coelhoso, J. Food Eng., 2016, 189, 37–44 CrossRef CAS
.
- M. A. M. Noor, K. N. Atan, G. Witjaksono and S. Saharudin, Procedia Chem., 2016, 20, 8–11 CrossRef CAS
.
- O. S. Wolfbeis, BioEssays, 2015, 37(8), 921–928 CrossRef CAS PubMed
.
- W. L. Yip, Int. Wound J., 2015, 12(6), 620–624 CrossRef PubMed
.
- S. Banerjee, C. Kelly, J. P. Kerry and D. B. Papkovsky, Trends Food Sci. Technol., 2016, 50, 85–102 CrossRef CAS
.
- K. Zhang, H. Zhang, W. Li, Y. Tian, S. Li, J. Zhao and Y. Li, Mater. Lett., 2016, 172, 112–115 CrossRef CAS
.
- X. D. Wang and O. S. Wolfbeis, Chem. Soc. Rev., 2014, 43(10), 3666–3761 RSC
.
- P. Jin, J. Chu, Y. Miao, J. Tan, S. Zhang and W. Zhu, AIChE J., 2013, 59(8), 2743–2752 CrossRef CAS
.
- K. Zhang, H. Zhang, Y. Wang, Y. Tian, J. Zhao and Y. Li, Spectrochim. Acta, Part A, 2017, 170, 242–246 CrossRef CAS PubMed
.
- C. S. Chu, J. Lumin., 2013, 135, 5–9 CrossRef CAS
.
- M. Z. Atashbar, H. T. Sun, B. Gong, W. Wlodarski and R. Lamb, Thin Solid Films, 1998, 326(1–2), 238–244 CrossRef CAS
.
- P. A. Jorge, M. Mayeh, R. Benrashid, P. Caldas, J. L. Santos and F. Farahi, Appl. Opt., 2006, 45(16), 3760–3767 CrossRef CAS PubMed
.
- D. Son, et al., Nanotechnology, 2014, 9, 397–404 CAS
.
- D. Vilela, A. Romeo and S. Sanchez, Lab Chip, 2016, 16, 402–408 RSC
.
- T. Q. Trung and N. E. Lee, Adv. Mater., 2016, 28, 4338–4372 CrossRef CAS PubMed
.
- H. Subbaraman, Z. Pan, C. Zhang, Q. Li, L. J. Guo and R. T. Chen, Proc. SPIE, 2016, 9753, 97530Y-1 CrossRef
.
- H. Yousef, M. Boukallel and K. Althoefer, Sens. Actuators, A, 2011, 167, 171–187 CrossRef CAS
.
- S. Emamian, A. Eshkeiti, B. B. Narakathu, S. G. R. Avuthu and M. Z. Atashbar, Sens. Actuators, B, 2015, 217, 129–135 CrossRef CAS
.
- V. S. Turkani, D. Maddipatla, B. B. Narakathu, B. J. Bazuin and M. Z. Atashbar, Sens. Actuators, A, 2018, 279, 1–9 CrossRef CAS
.
- B. N. Altay, J. Jourdan, V. S. Turkani, H. Dietsch, D. Maddipatla, A. Pekarovicova, P. D. Fleming and M. Z. Atashbar, ACS Appl. Energy Mater., 2018, 1(12), 7164–7173 CrossRef CAS
.
- P. H. Lau, K. Takei, C. Wang, Y. Ju, J. Kim, Z. Yu, T. Takahashi, G. Cho and A. Javey, Nano Lett., 2013, 13, 3864–3869 CrossRef CAS PubMed
.
- A. Eshkeiti, B. B. Narakathu, A. S. G. Reddy, A. Moorthi, M. Z. Atashbar, E. Rebrosova, M. Rebros and M. Joyce, Sens. Actuators, B, 2012, 171, 705–711 CrossRef
.
- D. Maddipatla, B. B. Narakathu, S. G. R. Avuthu, S. Emamian, A. Eshkeiti, A. A. Chlaihawi, B. J. Bazuin, M. K. Joyce, C. W. Barrett and M. Z. Atashbar, Proc. of IEEE Sensors, 2015, pp. 1–4 Search PubMed
.
- D. Maddipatla, B. B. Narakathu, M. M. Ali, A. A. Chlaihawi and M. Z. Atashbar, Proc. of IEEE Sensors Applications Symposium, 2017, pp. 1–4 Search PubMed
.
- M. Ha, J. W. T. Seo, P. L. Prabhumirashi, W. Zhang, M. L. Geier, M. J. Renn, C. H. Kim, M. C. Hersam and C. D. Frisbie, Nano Lett., 2013, 13(3), 954–960 CrossRef CAS PubMed
.
- S. Agarwala, G. L. Goh, T. S. Dinh Le, J. An, Z. K. Peh, W. Y. Yeong and Y. Kim, ACS Sens., 2018, 4(1), 218–226 CrossRef PubMed
.
- R. Liu, H. Ding, J. Lin, F. Shen, Z. Cui and T. Zhang, Nanotechnology, 2012, 23(50), 505301 CrossRef PubMed
.
- S. Agarwala, G. L. Goh and W. Y. Yeong, IEEE Access, 2018, 6, 63080–63086 Search PubMed
.
- H. Kipphan, Handbook of print media: technologies and production methods, New York, Springer, 2001 Search PubMed
.
- S. Y. Zhao and B. S. Harrison, Mater. Sci. Eng., C, 2015, 53, 280–285 CrossRef CAS PubMed
.
- H. J. Kim, Y. C. Jeong and J. I. Rhee, Talanta, 2008, 76(5), 1070–1076 CrossRef CAS PubMed
.
- T. Wuestenberg, Cellulose and cellulose derivatives in the food industry: fundamentals and applications, John Wiley & Sons, 2014 Search PubMed
.
- A. S. Narang and S. H. Boddu, Excipient applications in formulation design and drug delivery, Springer, 2015, pp. 1–10 Search PubMed
.
- M. Ochoa, Doctoral dissertation, Purdue University, 2016
.
- M. Ochoa, R. Rahimi, J. Zhou, H. Jiang, C. K. Yoon, M. Oscai, V. Jain, T. Morken, R. H. Oliveira, D. Maddipatla, B. B. Narakathu, et al., in Micro-and Nanotechnology Sensors, Systems, and Applications X, 2018, vol. 10639, p. 106391C Search PubMed
.
- B. Derby, Annu. Rev. Mater. Res., 2010, 40, 395–414 CrossRef CAS
.
- Dimatix 2800 Materials Printer User Manual, https://www.fujifilmusa.com Search PubMed.
- Z. Jiang, X. Yu, S. Zhai and Y. Hao, Sensors, 2017, 17(3), 548 CrossRef PubMed
.
- C. Elosua, N. de Acha, M. Hernaez, I. R. Matiasand and F. J. Arregui, Sens. Actuators, B, 2015, 207, 683–689 CrossRef CAS
.
- J. M. Bedlek-Anslow, J. P. Hubner, B. F. Carroll and K. S. Schanze, Langmuir, 2000, 16(24), 9137–9141 CrossRef CAS
.
- R. Xu, Y. Wang, X. Duan, K. Lu, D. Micheroni, A. Hu and W. Lin, J. Am. Chem.
Soc., 2016, 138(7), 2158–2161 CrossRef CAS PubMed
.
- L. Gitlin, C. Hoera, R. J. Meier, S. Nagl and D. Belder, Lab Chip, 2013, 13(20), 4134–4141 RSC
.
- M. Zolkapli, Z. Mahmud, S. H. Herman, W. F. H. Abdullah, U. M. Noorl and S. Saharudin, Proc. of IEEE International Colloquium on Signal Processing and its Applications, 2014, pp. 195–198 Search PubMed
.
- http://ainnotech.com/ainnotech/pdf/06/1_5/3OCE-SensorProbe.pdf, accessed June 2019.
Footnote |
| † Electronic supplementary information (ESI) available. See DOI: 10.1039/c9ra02883h |
| This journal is © The Royal Society of Chemistry 2019 |


