 Open Access Article
Preparation of two different crystal structures of cerous phosphate as solid acid catalysts: their different catalytic performance in the aldol condensation reaction between furfural and acetone†
Wenzhi Li a,
Mingxue Su
 *a,
Tao Yanga,
Tingwei Zhang
 a,
Qiaozhi Mab,
Song Lic and
Qifu Huang
 d
d
aLaboratory of Basic Research in Biomass Conversion and Utilization, Department of Thermal Science and Energy Engineering, University of Science and Technology of China, Hefei 230026, China. E-mail: smx123@mail.ustc.edu.cn
bCollege of Materials and Energy, South China Agricultural University, Guangzhou 510642, China
cCAS Key Laboratory of Renewable Energy, Guangzhou Institute of Energy Conversion, Chinese Academy of Sciences, Guangzhou 510640, China
dBeijing Mechanical Equipment Institute, Beijing, 100854, P. R. China
First published on 29th May 2019
Abstract
Liquid fuel intermediates can be produced via aldol condensation reactions through furan aldehydes and ketones driven from biomass. It was found that cerous phosphate (CP) with two different crystal structures (hexagonal and monoclinic structure), which was tailored by different hydrothermal temperature (120 °C for the hexagonal structure and 180 °C for the monoclinic structure) and calcination temperature (900 °C for the monoclinic structure) as a solid acid catalyst, exhibit high catalytic performance in aldol condensation between furfural and acetone. The CP with hexagonal structure gave 89.1% conversion of furfural with 42% yield of 4-(2-furyl)-3-buten-2-one (FAc) and 17.5% of yield of 1,5-di-2-furanyl-1,4-pentadien-3-one (F2Ac), much higher than CP with monoclinic structure. However, both furfural conversion and aldol product yield increased from 82.3% to 96% and from 50.5% to 68.4%, respectively, for CP with the monoclinic structure after calcination owing to the higher amount of acid of catalyst after calcination but decreased continuously for CP with hexagonal structure after calcination because of its rapidly reduced BET surface area and total pore volume. The results indicated that calcination affects significantly the physical–chemical properties of CP catalysts, which influence subsequently the catalytic performance in the aldol condensation reaction. Recycling experiments showed that the catalytic performance after five number runs for CP with monoclinic structure after calcination was acceptable but was not ideal for CP with hexagonal structure owing to its poor hydrothermal stability.
Introduction
The manufacture of liquid fuel from sustainable resources has caused widespread concern because of environmental pollution. Although there are many renewable resources, lignocellulosic biomass is the only carbon-neutral, renewable and abundant energy resource and has been widely applied to produce biofuels through several consecutive steps.1–5 In general, polysaccharide in lignocellulose can be hydrolyzed into monosaccharide and these constituent sugar monomers can be further hydrolyzed into furfural and 5-hydroxymethylfurfural (HMF), two important furanic platform chemicals, by homogeneous or heterogeneous acid catalysts.6–8 There were two main methods to produce liquid fuel from the furfurals: production of linear C5–C6 alkane via direct hydrodeoxygenation of furfurals and manufacture of C7–C15 alkane with high octane number values by continuous steps consisting of sequential aldol condensation and hydrodeoxygenation.9,10 Through these pathways, biomass feedstock can be transformed into high value-added aviation kerosene.Aldol condensation reaction was considered as a key step to produce liquid fuels from lignocellulose since low carbon molecules like furfural can be transformed into high carbon chain precursors. For example, C8–C13 liquid fuel precursors can be formed through aldol condensation between furfural and acetone.11 There were many types of catalysts applied to catalyze this aldol condensation reaction of furfural and acetone. Initially, several homogeneous base catalysts, such as Ca(OH)2 and NaOH, were used to this aldol condensation reaction pathway.12–17 VCl3 and other metal chloride were also used as catalysts.18 However, corrosion, enhancing self-condensation, non-recyclability, high cost and high expense of neutralizing generated waste water stream were unavoidable drawback of these homogeneous catalysts.19 To overcome these defect, stable heterogeneous catalysts were designed and developed. It was reported that mixed metal oxides like Mg–Al, Mg–Zr, Ca–Zr mixed oxides, natural dolomitic rocks and anion-exchange resins were all active to aldol condensation reaction between furfural and acetone.20–27 For example, Huber et al. study the catalytic characteristics of Mg–Zr mixed oxide in a methanol–water biphasic system and a 54% yield of aldol products was achieved.28 In addition, zeolite was also applied to catalyze aldol condensation reaction. For example, Yuriy et al. study the cross-aldol condensation reaction of aromatic aldehydes and acetone using Lewis acid zeolites such as Sn-, Hf- and Zr-beta with high conversion and selectivity under mild condition.29–33 Additionally, Li et al. used Sn-MFI zeolite as catalyst and achieved shape selectivity to mono product.34 These researches indicated the development of stable heterogeneous catalysts, which was applied to aldol condensation reaction of furfural and acetone, was necessary and successful.
Recently, cerium phosphate has caused extensive attention because it was widely applied to the assembly of electrochemical, electrical and optical nanodevices. In addition, cerium phosphate was also widely used as a catalyst or catalyst carrier in selective reduction of NOx, CO oxidation, n-butane oxidation and hydrogenation and exhibited good catalytic performance.35–44 In particular, Michikazu et al. reported that cerium phosphate may act as a bifunctional catalyst with both Lewis acid and weak base sites, which was used to chemoselective acetalization of 5-hydroxymethylfurfural with alcohols and exhibited high catalytic performance.45 Additionally, Wang et al. reported cerium phosphate can be used as solid Lewis acid catalyst for dehydration of glucose into 5-hydroxymethylfurfural (HMF) and achieved 61% yield of 5-hydroxymethylfurfural (HMF) with 97% conversion of glucose.46 These researches highlighted that cerium phosphate be a multifunctional material and potential to catalyze some reactions that required an acid catalyst, such as aldol condensation reaction.
The physical–chemical properties of cerium phosphate can be significantly affected by the different crystal structure of cerium phosphate, which further play an important influence in catalytic performance of cerium phosphate. However, the differences of catalytic behavior due to different crystal structures of cerium phosphate was not reported in aldol condensation reaction to the best of our knowledge. Herein, two different crystal structure of cerium phosphate was synthesized and the different changes of physical–chemical properties of cerium phosphate after heat treatment was studied. In addition, cerium phosphate was used as a solid acid catalyst to catalyze aldol condensation reaction of furfural and acetone. The effects of calcination temperature of catalysts on catalytic activity was systematic studied. Reaction time, reaction temperature and reusability were also studied.
Experimental
Materials preparation
Furfural (AR, 99%) was purchased from Aladdin Industrial. Inc. (Shanghai, China), cerium(III) nitrate hexahydrate (Ce(NO3)3·6H2O), ammonium dihydrogen phosphate (NH4H2PO4), cerium oxide (AR) and acetone (AR) were purchased from Sinopharm Chemical Reagent Co. Ltd (Shanghai, China). All reagents were used without any purification.Catalyst preparation
The cerium phosphate catalyst (CP) with monoclinic structure was synthesized by modified method according to previous literature.45 Typically, Ce(NO3)3·6H2O (6 mmol, 2.6 g) and NH4H2PO4 (6 mmol, 0.69 g) were dissolved in 70 ml DI water under stirring for 1 h at room temperature. The obtained solution was transferred into a 100 ml Teflon-lined stainless autoclave and heated at 180 °C for 4 days. The formed precipitates were collected by centrifugation and washed thoroughly with DI water. After dried at 80 °C overnight, the solid product was calcined at 500 °C, 700 °C and 900 °C for 3 h. The obtained catalysts were named as CP-180-500, CP-180-700 and CP-180-900. Particularly, the catalyst without calcination was donated as CP-180-0.The cerium phosphate catalyst (CP) with hexagonal structure was synthesized by modified method according to previous literature.46 Typically, Ce(NO3)3·6H2O (6 mmol, 2.6 g) and NH4H2PO4 (6 mmol, 0.69 g) were dissolved in 70 ml DI water under stirring for 1 h at room temperature. The obtained solution was transferred into a 100 ml Teflon-lined stainless autoclave and heated at 120 °C for 8 h. The formed precipitates were collected by centrifugation and washed thoroughly with DI water. After dried at 80 °C overnight, the solid product was calcined at 500 °C, 700 °C and 900 °C for 3 h. The obtained catalysts were named as CP-120-500, CP-120-700 and CP-120-900. Particularly, the catalyst without calcination was donated as CP-120-0.
For comparison, phosphorus doped CeO2 was synthesized by impregnation method. Typically, NH4H2PO4 was firstly dissolved in 70 ml DI water under stirring and then CeO2 was put into the solution. The water was evaporated at 80 °C and the remaining mixture was dried at 100 °C overnight. The obtained solid powder was calcined at 500 °C for 5 h. The obtained powder was named as P/CeO2.
Catalyst characterization
Powder X-ray diffraction (XRD) patterns of CP catalysts were recorded by a Smartlab X-ray diffractometer equipped with a Cu-Kα radiation source. Fourier transform infrared spectroscopy (FTIR) of CP catalysts were measured by ThermoFisher Nicolet IS200, using KBr disks. SEM images of CP catalysts were characterized by ZEISS GeminiSEM 500 scanning electron microscope. The textural properties of CP catalysts were measured by an Autosorbi Q (Quantachrome). The ammonia gas temperature programmed desorption (NH3-TPD) were analyzed by ChemStar TPx chemisorption analyzer (Quantachrome Instrument).Catalytic reaction and analysis methods
Aldol condensation reaction of furfural and acetone was performed in a Synthware thick-walled pressure bottle. In a typical reaction, 0.12 g furfural and 0.71 g acetone (the molar ratio of furfural/acetone = 1/10) were mixed in this glass reactor with 0.1 g catalyst. Afterwards, the reactor was put into oil bath preheated at 100 °C, 120 °C, 140 °C, and 160 °C under 0–4 h. After reaction, the reactor was fast cool down using an ice bath, followed by centrifugation to separate the catalyst. Finally, the remaining solution was transferred into a GC vial and analyzed by using Shimadzu GC-2010 equipped with FID.The catalytic performance was evaluated by furfural conversion, FAc yield and F2Ac yield. The formula was defined as follow:28
Results and discussion
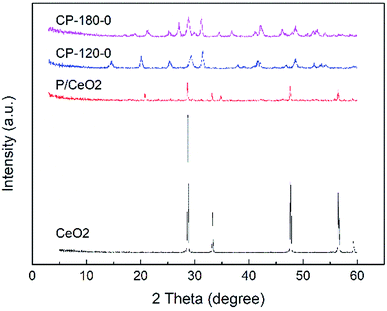
The XRD patterns of prepared P/CeO2, CP-120-0, CP-180-0 and pure CeO2 (purchased) was depicted in Fig. 1. For the P/CeO2 sample, compared with pure CeO2, a few new diffraction peaks consistent with some of characteristic peaks of cerium phosphate was obtained, indicating some cerium phosphate phases was formed through impregnation method.37 For the CP-120-0 and CP-180-0 samples, diffraction peaks were completely different from pure CeO2 and highly corresponding with the main diffraction peaks of cerium phosphate phase, which was different with P/CeO2 sample, indicating cerium phosphate catalysts were formed successfully through hydrothermal method.45,46Fig. 2 and 3 showed the XRD patterns of CP catalysts prepared by hydrothermal method at 120 °C and 180 °C and followed by calcination at 500 °C, 700 °C and 900 °C, respectively. As shown in Fig. 2, for the CP-120-0 sample, the characteristic peaks at 2 theta of 14.4, 20.1, 25.3, 29.2, 31.5, 37.7, 41.9, 48.2 and 53.3° were attributed to the hexagonal structure of cerium phosphate. However, after calcination at 500 °C, the intensity of the diffraction peaks at 14.4 and 20.1°, corresponding with (100) and (101) crystal planes of hexagonal structure of cerium phosphate, respectively, decreased. With the calcination temperature was increased to 700 °C, the diffraction peaks at 14.4 and 20.1° completely disappeared, which indicated the hexagonal structure of cerium phosphate was destroyed after heat treatment. In the meanwhile, some new characteristic peaks at 2 theta of 17.0, 19.0, 21.3, 27.1, 34.5 and 41.2°, which were ascribed to (101), (011), (111), (200), (202) and (103) of crystal planes of monoclinic structure of cerium phosphate, were obtained and appeared completely after calcination at 900 °C further.46 These results reveal that cerium phosphate with hexagonal structure was unstable and the transformation of crystal structure from hexagonal structure to monoclinic structure was achieved after calcination at 900 °C.
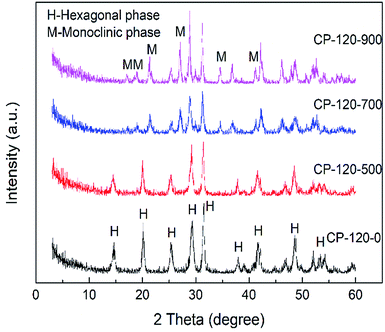 | ||
| Fig. 2 The XRD patterns of CP catalysts prepared by hydrothermal method at 120 °C and followed by calcination at different temperature. | ||
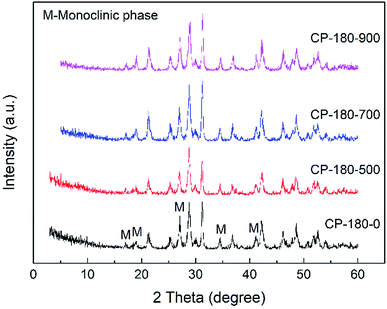 | ||
| Fig. 3 The XRD patterns of CP catalysts prepared by hydrothermal method at 180 °C and followed by calcination at different temperature. | ||
As shown in Fig. 3, for the CP-180-0 sample, the diffraction peaks at 2 theta of 17.0, 19.0, 21.3, 27.1, 34.5 and 41.2° were observed, revealing the cerium phosphate prepared by hydrothermal method at 180 °C was monoclinic structure.46 With the calcination temperature was continuously increased to 900 °C, these characteristic peaks did not change significantly, suggesting the cerium phosphate with monoclinic structure was stable and the monoclinic structure was still remained even after calcination at 900 °C.
Fig. 4 and 5 displayed the FTIR results of CP catalysts prepared by hydrothermal method at 120 °C (hexagonal structure) and 180 °C (monoclinic structure) and followed by calcination at 500 °C, 700 °C and 900 °C, respectively. As shown in Fig. 4, for the cerium phosphate with hexagonal structure without calcination sample (CP-120-0), a broad absorption band around 3500 cm−1 was ascribed to –OH absorption. Likewise, the band around 1625 cm−1 can be possible attributed to hydration water of CePO4·nH2O.47 A broad adsorption band around 1064 cm−1 was observed, which was ascribed to P![[double bond, length as m-dash]](https://www.rsc.org/images/entities/char_e001.gif) O stretching mode.48 The band around 620 cm−1 and 535 cm−1 were O
O stretching mode.48 The band around 620 cm−1 and 535 cm−1 were O![[double bond, length as m-dash]](https://www.rsc.org/images/entities/char_e001.gif) P–O bending vibration and Ce–O stretching vibration.47,48 However, with the increase of calcination temperature, the broad adsorption band around 1625 cm−1 was gradually weak, implying the loss of hydration water, and two new adsorption band around 945 cm−1 and 575 cm−1, which were ascribed to asymmetric stretching vibration of phosphate groups and O–P–O bending vibration, respectively, appeared.48 These results implied the change of cerium phosphate with hexagonal structure occurred after calcination and was probably ascribed to the transformation of crystal structure according to XRD results.
P–O bending vibration and Ce–O stretching vibration.47,48 However, with the increase of calcination temperature, the broad adsorption band around 1625 cm−1 was gradually weak, implying the loss of hydration water, and two new adsorption band around 945 cm−1 and 575 cm−1, which were ascribed to asymmetric stretching vibration of phosphate groups and O–P–O bending vibration, respectively, appeared.48 These results implied the change of cerium phosphate with hexagonal structure occurred after calcination and was probably ascribed to the transformation of crystal structure according to XRD results.
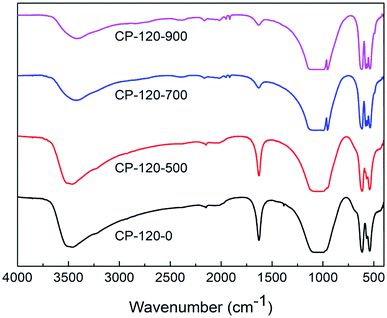 | ||
| Fig. 4 The FTIR spectra of CP catalysts prepared by hydrothermal method at 120 °C (hexagonal structure) and followed by calcination at different temperature. | ||
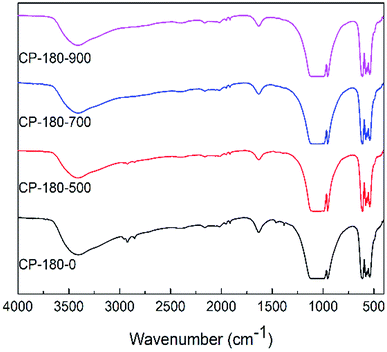 | ||
| Fig. 5 The FTIR spectra of CP catalysts prepared by hydrothermal method at 180 °C (monoclinic structure) and followed by calcination at different temperature. | ||
However, for cerium phosphate prepared by hydrothermal method at 180 °C (monoclinic structure) with or without calcination, there were no obvious difference in FTIR results, as shown in Fig. 5. These results implied cerium phosphate with monoclinic structure was stable during calcination, which was corresponding to XRD results. Particularly, the FTIR curves of all CP-180 samples were similar to CP-120-900 sample, which may be owing to the same crystal structure (monoclinic structure) of these catalysts.
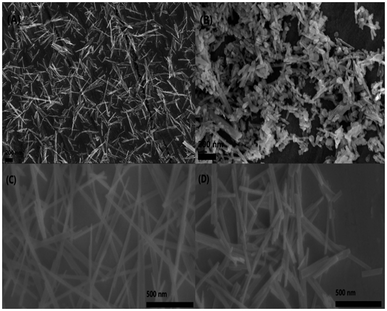
The morphology of CP catalysts with hexagonal and monoclinic structure before/after calcination (CP-120-0, CP-120-900, CP-180-0 and CP-180-900) was studied by SEM and results were shown in Fig. 6. It can be clearly seen that CP-120-0 catalyst display a fine rod-like shaped particles (Fig. 6A). However, CP-120-900 displayed a rougher rod-like morphology compared with CP-120-0, which was attributed to agglomeration among particles after calcination (Fig. 6B). Fig. 6C and D showed there were no significantly difference between CP-180-0 and CP-180-900, respectively, and both two catalysts display a fine rod-like morphology.
The textural properties of CP catalysts with hexagonal and monoclinic structure before/after calcination (CP-120-0, CP-120-900, CP-180-0 and CP-180-900) driven from N2 adsorption–desorption isotherms at 77 K were summarized in Table 1. It can be seen that cerium phosphate with hexagonal structure catalyst (CP-120-0) had the highest BET surface area and largest total pore volume, 55.7 m2 g−1 and 0.44 cm3 g−1, respectively, compared with cerium phosphate with monoclinic structure catalyst (CP-180-0), 46.7 m2 g−1 and 0.30 cm3 g−1, respectively. However, the BET surface area and total pore volume of CP catalysts with hexagonal structure after calcination at 900 °C (CP-120-900) were drastically reduced to 24.9 m2 g−1 and 0.25 cm3 g−1, respectively. This reduction was chiefly caused by agglomeration or structural collapse of hexagonal structure catalyst after calcination. Conversely, for CP-180-900 sample, the BET surface area and total pore volume were 42.9 m2 g−1 and 0.28 cm3 g−1, respectively, slightly lower than CP-180-0, but higher than CP-120-900. These results implied that the textural properties of CP catalyst with monoclinic structure were more stable than hexagonal structure during calcination.
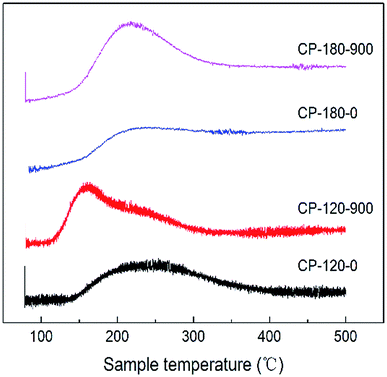
The acidic properties of CP catalysts with hexagonal and monoclinic structure before/after calcination (CP-120-0, CP-120-900, CP-180-0 and CP-180-900) were determined by NH3-TPD and results were displayed in Fig. 7 and Table 2. As shown in Fig. 7, the CP-120-0 catalyst exhibited a broad desorption peaks at around 250 °C, which was ascribed to weak NH3 adsorption. This result demonstrated that a weak acid site exist in CP-120-0 catalyst. It was worth noting that the position of desorption peak for catalyst after calcination (CP-120-900) shifted to the lower temperature, around 160 °C, which was assigned to weaker acid site of catalyst after calcination, and the desorption peak strengthened, which was attributed to higher amount of acid of catalyst after calcination. For the CP-180-0 catalyst, a broad desorption appeared at around 200 °C. After calcination, the peak area also increased, implying the amount of acid increased, but the peak position did not change obviously (CP-180-900). These results clearly demonstrated calcination significantly affect the acidic properties of CP catalysts with two different structures. Differently, calcination only affect the amount of acid for monoclinic structure but not only amount of acid but also acid strength for hexagonal structure. The quantitative data of NH3-TPD for CP catalysts were summarized in Table 2. The amount of acid of CP-120-0 was 110 μmmol g−1, higher than 96.2 μmmol g−1 for CP-180-0. After calcination, the amount of acid of CP-180-900 and CP-120-900 was 190.3 μmmol g−1 and 184.4 μmmol g−1, respectively.
| Catalysts | Peak position (°C) | NH3 adsorption (μmmol g−1) |
|---|---|---|
| CP-120-0 | 250 | 110 |
| CP-120-900 | 160 | 184.4 |
| CP-180-0 | 200 | 96.2 |
| CP-180-900 | 210 | 190.3 |
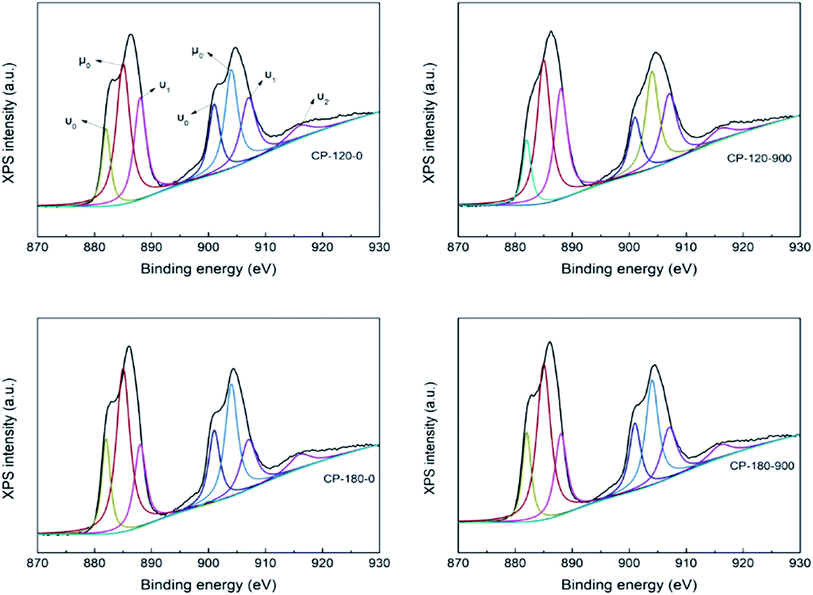
The CP catalysts with hexagonal and monoclinic structure before/after calcination (CP-120-0, CP-120-900, CP-180-0 and CP-180-900) were further characterized by XPS to analyze their surface properties and results were depicted in Fig. 8. The complex Ce XPS spectra for CP catalysts was marked for the Ce4+(3d104f0) and Ce3+(3d104f1) chemical species, which were substituted by υ and μ symbols, respectively, and was decomposed into ten components according to previous references. The binding energy (BE) of Ce4+ was considered at around υ0 = 881, υ1 = 888, υ2 = 897, υ0′ = 901, υ1′ = 907 and υ2′ = 916 eV. The BE at around μ0 = 885, μ1 = 882, μ0′ = 904 and μ1′ = 900 eV was correspond with Ce3+ chemical state. The relative abundance of Ce4+ species in the CP catalysts was measured by considering the decomposed peak area of the Ce3d BE.49,50 As shown in Fig. 8, the Ce4+/(Ce4+ + Ce3+) concentration were 39.2, 47.5, 37.1 and 45.3 for CP-120-0, CP-120-900, CP-180-0 and CP-180-900, respectively. This result demonstrated calcination can improve the amount of relative abundance of Ce4+ of CP catalysts, no matter monoclinic structure or hexagonal structure. It was reported that Ce4+ prove the Lewis acid site, which meant a change in the Ce4+ amount in the catalysts lead to a corresponding change in the Lewis acid site.46 Therefore, the Ce4+/(Ce4+ + Ce3+) concentration provided the amount of acid order for CP catalysts: CP-180-900 > CP-120-900 > CP-120-0 > CP-180-0. The result of XPS also explained and was corresponding with NH3-TPD results.
The aldol condensation reaction of furfural and acetone was carried out with the molar ratio of furfural/acetone = 1/10. Fig. 9 showed the catalytic performance of CP catalysts in aldol condensation reaction between furfural and acetone. Clearly, furfural conversion was 23.7% with 8.2% yield of FAc and 1.8% yield of F2Ac over P/CeO2 at 160 °C after 3 h, higher than 10% conversion of furfural with about 1% yield of FAc over pure CeO2 under same reaction conditions, which was attributed to the existence of a few cerium phosphate phases in the P/CeO2 catalyst according to XRD results. Further, cerium phosphate prepared with hydrothermal method was used as catalysts. Furfural conversion was 89.1% with 42% yield of FAc and 17.5% yield of F2Ac over CP-120-0 and 82.3% conversion of furfural with 40.1% yield of FAc and 10.4% yield of F2Ac was achieved over CP-180-0 at 160 °C after 3 h, much higher than P/CeO2 and CeO2. These results demonstrated that cerium phosphate was an active catalyst for aldol condensation of furfural and acetone. It was worthy noting that the catalytic performance of CP-120-0 was higher than CP-180-0, which indicated that cerium phosphate with hexagonal structure had a higher activity than monoclinic structure in the case of no calcination. Higher BET surface area, total pore volume and amount of acid were possible reason for this difference according to BET and NH3-TPD results.
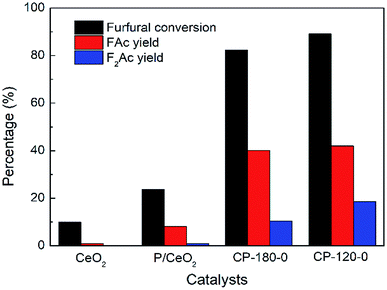 | ||
| Fig. 9 The catalytic performance of CeO2, P/CeO2, CP-120-0 and CP-180-0 in aldol condensation reaction. Reaction time: 3 h. Reaction temperature: 160 °C. | ||
The impact of calcination temperature of CP catalysts on catalytic performance was studied and results were depicted in Fig. 10 and 11. As shown in Fig. 10, after calcination at 500 °C, furfural conversion increased to 86.4% with 42.3% yield of FAc and 11.2% yield of F2Ac over CP-180-500 at 160 °C after 3 h. Further increasing calcination temperature from 700 °C to 900 °C, the furfural conversion increased correspondingly from 91.7% to 96% and FAc yield as well as F2Ac yield also increased from 47.8% to 54.3% and from 12.7% to 14.1% over CP-180-700 and CP-180-900 catalysts under same reaction conditions, respectively. These results clearly demonstrated that increasing calcination temperature of catalyst can improve the catalytic performance of CP catalysts with monoclinic structure, which was ascribed to the higher amount of acid and relative stable textural properties after catalyst was calcinated according to previous catalyst characterization.
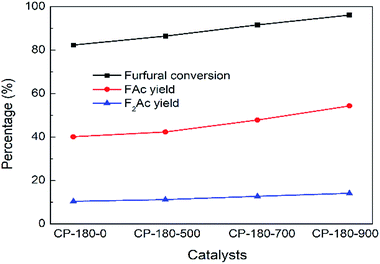 | ||
| Fig. 10 The impact of calcination on catalytic performance of CP catalyst prepared by hydrothermal method at 180 °C. Reaction time: 3 h. Reaction temperature: 160 °C. | ||
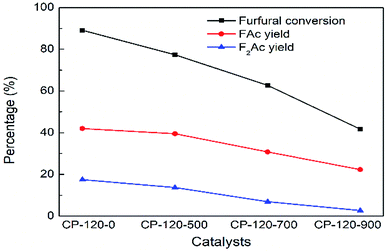 | ||
| Fig. 11 The impact of calcination on catalytic performance of CP catalyst prepared by hydrothermal method at 120 °C. Reaction time: 3 h. Reaction temperature: 160 °C. | ||
Conversely, the catalytic performance of CP catalysts with hexagonal structure after calcination was obviously opposite with monoclinic structure. As shown in Fig. 11, the catalytic performance of CP catalyst with hexagonal structure continuously decreased with the calcination temperature increasing. After calcination at 900 °C, furfural conversion rapidly decreased to 41.7% and FAc yield and F2Ac yield decreased to 22.3% and 2.7% over CP-120-900 at 160 °C after 3 h, respectively. On the basis of previous catalyst characterization, different from cerium phosphate with monoclinic structure, although the amount of acid was also higher after catalyst was calcinated according to NH3-TPD, BET surface area and total pore volume decreased rapidly. It was seen in Table 1 that both BET surface area and total pore volume of CP-120-900 decreased by half but CP-180-900 hardly decreased. Therefore, relatively poor textural properties after calcination of cerium phosphate with hexagonal structure compared with monoclinic structure may be a main reason for limiting catalytic performance. These results also explained the opposite catalytic performance of two crystal structure of CP catalysts after calcination. It can be seen that cerium phosphate with monoclinic structure after calcination at 900 °C (CP-180-900) have a highest activity among all these CP catalysts in aldol condensation reaction of furfural and acetone.
The impact of reaction time and reaction temperature were studied by conducting the aldol condensation reaction between furfural and acetone over CP-180-900 catalyst at 100–160 °C for 0.5–4 h. The effect on furfural conversion, FAc yield and F2Ac yield were depicted in Fig. 12A, B and C, respectively. Apparently, increasing the reaction time and temperature can significantly improve the catalytic performance. For example, as shown in Fig. 12A, upon carrying out the reaction temperature at 100 °C, with the reaction time increasing from 0.5 h to 4 h, the furfural conversion increased from about 2% to 14.2%. Keeping the reaction temperature increasing to 160 °C, with the reaction time increasing from 0.5 h to 4 h, the furfural conversion increased from 53.1% to 96%. The effects of reaction time and temperature on FAc yield and F2Ac yield were similar to furfural conversion. As shown in Fig. 12B and C, upon carrying out the reaction temperature at 100 °C, with the reaction time increasing from 0.5 h to 4 h, the FAc yield and F2Ac yield increased from 0% to 9.2% and from 0% to about 1%, respectively. Keeping the reaction temperature increasing to 160 °C, with the reaction time increasing from 0.5 h to 4 h, the FAc yield and F2Ac yield increased from 33.7% to 54.3% and from 8.6% to 14.1%. Remarkably, the improvement of catalytic performance by prolonging reaction time at low temperature (100 °C) was not better than prolonging reaction time at high temperature (160 °C). This result implied that increasing reaction temperature was more influential to the catalytic performance than the reaction time.
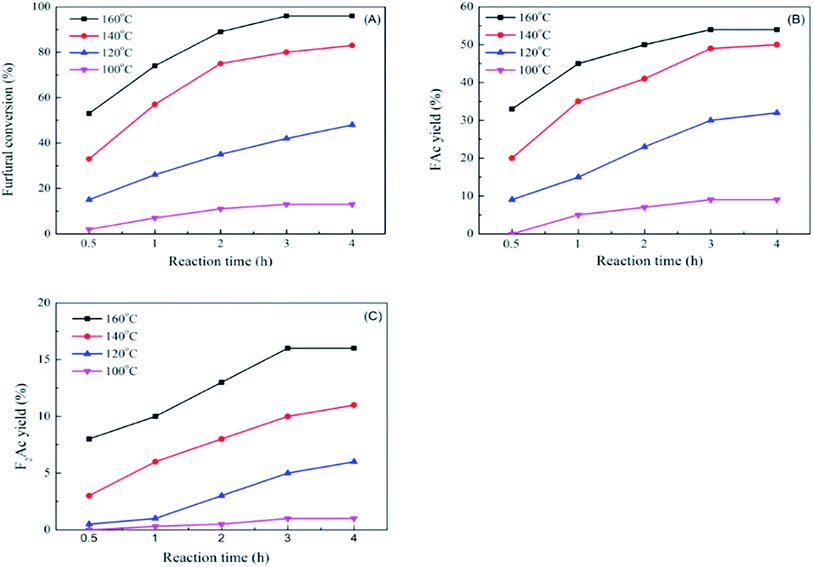 | ||
| Fig. 12 The impact of reaction time and reaction temperature on furfural conversion (A), FAc yield (B) and F2Ac yield (C) over CP-180-900. | ||
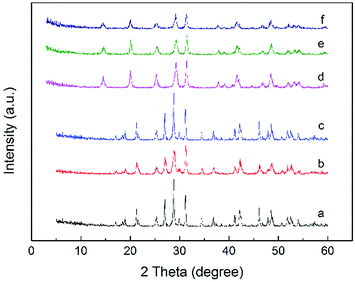
The recyclability and regeneration of CP catalysts with two different structures was also studied. Fig. 13 summarized the reusability (run 2) and regeneration (run 3, 4 and 5) research of CP catalyst with monoclinic structure (CP-180-900). After the first run, attempt was made to reuse the spent catalyst through just washed with acetone thoroughly and dried at 100 °C. As shown in Fig. 13 (run 2), the catalytic performance of this as-treated spent catalyst decreased distinctly. The furfural conversion decreased from 96% to 62.2% and the yield of FAc and F2Ac decreased from 54.3% to 41.1% and 14.1% to 6.6%, respectively. The result indicated that CP-180-900 cannot be reused via only washing with acetone after reaction. The regeneration of CP-180-900 was carried out by calcination at 550 °C in air for 5 h after washing with acetone and drying at 100 °C. The recycled CP-180-900 showed almost the same catalytic performance compared with the first run. The furfural conversion was 94.8% with a 49.2% yield of FAc and a 13.2% yield of F2Ac, respectively (run 3). The CP-180-900 was regenerated by washing, drying and calcination in air (the same way as run 3) in the following two runs (run 4 and run 5). Although the furfural conversion and aldol product yield continuously decreased, the catalytic performance of CP catalyst with monoclinic structure after regeneration was acceptable. However, the recyclability and regeneration of CP catalyst with hexagonal structure (CP-120-0) was unsatisfactory and results were shown in Table 3. Although the catalytic performance of the reused catalyst after calcination was higher than spent catalyst without calcination, the catalytic activity was far poor than the fresh catalyst. The changes of catalyst after calcination owing to its poor hydrothermal stability according to XRD results was accountable mainly for this decrease. As shown in Fig. 14, the intensity of peak of spent CP-180-900 without calcination (Fig. 14b) was weaker than fresh CP-180-900 (Fig. 14a), which was attributed to the formation of humins on the catalyst during reaction because the color of spent catalyst was brown. The XRD pattern of reused catalyst after calcination (Fig. 14c) was same with the fresh catalyst. This result revealed no significant changes happened in the crystal structure after calcination for CP-180-900. For CP-120-0, the intensity of peak of spent CP-120-0 without calcination (Fig. 14e) was also weaker than fresh CP-120-0 (Fig. 14d) because of the same reason for CP-180-900. However, the XRD pattern of reused catalyst after calcination (Fig. 14f) was also weaker than the fresh catalyst because of the part destruction of hexagonal structure of CP-120-0 during calcination. These results of XRD study of reused catalyst explained correspondingly the catalytic behavior of CP-180-900 and CP-120-0 in the recyclability test.51,52
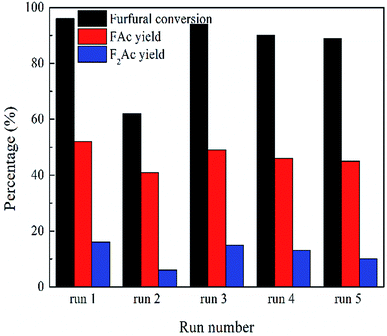 | ||
| Fig. 13 The recyclability study of CP catalyst with monoclinic structure (CP-180-900). Reaction time: 3 h. Reaction temperature: 160 °C. | ||
Conclusions
The cerium phosphate with two crystal structure was used as a catalyst for aldol condensation reaction between furfural and acetone at the first time, and high furfural conversion and aldol products yield were achieved. Calcination played an important role in the catalytic activity of CP catalysts. CP catalyst with hexagonal structure which was prepared by hydrothermal method at 120 °C and without calcination had a better catalytic behavior than CP catalyst with monoclinic structure but after calcination, CP catalyst with monoclinic structure showed a higher catalytic activity, which was attributed to the comprehensive impact of the change of amount of acid and textural properties with calcination. In addition, the furfural conversion slightly decreased to 89.8% with FAc and F2Ac yield decreasing to 45.1% and 10.5%, respectively, for CP-180-900 after five runs but the furfural conversion rapidly decreased to 78.4% with FAc and F2Ac yield decreasing to 36.3% and 12.1%, respectively, for CP-120-0 after only two runs. The recyclability study indicated the catalytic performance of CP catalyst with monoclinic structure was acceptable after five runs but CP catalyst with hexagonal structure was unsatisfactory owing to its poor hydrothermal stability.Conflicts of interest
There are no conflicts to declare.Acknowledgements
This study was financially supported by the National Key R&D Program of China (No. 2018YFB1501600), “Transformational Technologies for Clean Energy and Demonstration”, Strategic Priority Research Program of the Chinese Academy of Sciences, Grant No. XDA 21060101, National Natural Science Foundation of China (51676178), the Science and Technological Fund of Anhui Province for Outstanding Youth (1508085J01).Notes and references
- M. Stöcker, Angew. Chem., Int. Ed., 2008, 47, 9200–9211 CrossRef PubMed.
- S. Zinoviev, f. Müller-Langer, P. Das, N. Bertero, P. Fornasiero, M. Kaltschmitt, G. Centi and S. Miertus, ChemSusChem, 2010, 3, 1106–1133 CrossRef CAS PubMed.
- D. Kubička, I. Kubičková and J. Čejka, Catal. Rev. Sci. Eng., 2013, 55, 1–78 CrossRef.
- G. W. Huber and A. Corma, Angew. Chem., Int. Ed., 2007, 46, 7184–7201 CrossRef CAS PubMed.
- A. Bohre, B. Saha and M. M. Abu-Omar, ChemSusChem, 2015, 8, 4022–4029 CrossRef CAS PubMed.
- S. Wang, Y. Zhao, H. Lin, J. Chen, L. Zhu and Z. Luo, Green Chem., 2017, 19, 3869–3879 RSC.
- H. Lin, Q. Xiong, Y. Zhao, J. Chen and S. Wang, AIChE J., 2017, 63, 257–265 CrossRef CAS.
- H. Lin, J. Chen, Y. Zhao and S. Wang, Energy Fuels, 2017, 31, 3929–3934 CrossRef CAS.
- B. O. de Beeck, M. Dusselier, J. Geboers, J. Holsbeek, E. Morré, S. Oswald, L. Giebeler and B. F. Sels, Energy Environ. Sci., 2015, 8, 230–240 RSC.
- A. Bohre, S. Dutta, B. Saha and M. M. Abu-Omar, ACS Sustainable Chem. Eng., 2015, 3, 1263–1277 CrossRef CAS.
- G. W. Huber, J. N. Chheda, C. J. Barrett and J. A. Dumesic, Science, 2005, 308, 1446–1450 CrossRef CAS PubMed.
- P. A. Zapata, J. Faria, M. P. Ruiz and D. E. Resasco, Top. Catal., 2012, 55, 38–52 CrossRef CAS.
- N. Fakhfakh, P. Cognet, M. Cabassud, Y. Lucchese and M. D. d. L. Ríos, Chem. Eng. Process., 2008, 47, 349–362 CrossRef CAS.
- C. Ramirez-Barria, A. Guerrero-Ruiz, E. Castillejos-López, I. Rodriguez-Ramos, J. Durand, J. Volkman and P. Serp, RSC Adv., 2016, 6, 54293–54298 RSC.
- C. D. Gutsche, D. Redmore, R. S. Buriks, k. Nowotny, H. Grassner and C. W. Armbruster, J. Am. Chem. Soc., 1967, 89, 1235–1245 CrossRef CAS PubMed.
- R. M. West, Z. Y. Liu, M. Peter, C. A. Gärtner and J. A. Dumesic, J. Mol. Catal. A: Chem., 2008, 296, 18–27 CrossRef CAS.
- R. Xing, A. V. Subrahmanyam, H. Olcay, W. Qi, G. P. van Walsum, H. Pendse and G. W. Huber, Green Chem., 2010, 12, 1933–1946 RSC.
- H. Li, Z. Xu, P. Yan and Z. C. Zhang, Green Chem., 2017, 19, 1751–1756 RSC.
- C. J. Barrett, J. N. Chheda, G. W. Huber and J. A. Dumesic, Appl. Catal., B, 2006, 66, 111–118 CrossRef CAS.
- R. E. O'Neill, L. Vanoye, C. De Bellefon and F. Aiouache, Appl. Catal., B, 2014, 144, 46–56 CrossRef.
- X. Sheng, N. Li, G. Li, W. Wang, A. Wang, Y. Cong, X. Wang and T. Zhang, Green Chem., 2016, 18, 3707–3711 RSC.
- I. Sádaba, M. Ojeda, R. Mariscal, R. Richards and M. L. Granados, ChemPhysChem, 2012, 13, 3282–3292 CrossRef PubMed.
- J. Yang, N. Li, S. Li, W. Wang, L. Li, A. Wang, X. Wang, Y. Cong and T. Zhang, Green Chem., 2014, 16, 4879–4884 RSC.
- W. Xu, X. Liu, J. Ren, H. Liu, Y. Ma, Y. Wang and G. Lu, Microporous Mesoporous Mater., 2011, 142, 251–257 CrossRef CAS.
- M. Li, X. Xu, Y. Gong, Z. Wei, Z. Hou, H. Li and Y. Wang, Green Chem., 2014, 16, 4371–4377 RSC.
- L. Faba, E. Díaz and S. Ordóñez, Appl. Catal., B, 2012, 113, 201–211 CrossRef.
- X. Huang, Q. Zhang, T. Wang, Q. Liu, L. Ma and Q. Zhang, J. Fuel Chem. Technol., 2012, 40, 973–978 CrossRef CAS.
- W. Shen, G. A. Tompsett, K. D. Hammond, R. Xing, F. Dogan, C. P. Grey, W. C. Conner Jr, S. M. Auerbacha and G. W. Huber, Appl. Catal., A, 2011, 392, 57–68 CrossRef CAS.
- J. D. Lewis, S. Van de Vyver and Y. Román-Leshkov, Angew. Chem., Int. Ed., 2015, 54, 9835–9838 CrossRef CAS PubMed.
- O. Kikhtyanin, V. Kelbichová, D. Vitvarová, M. Kubů and D. Kubička, Catal. Today, 2014, 227, 154–162 CrossRef CAS.
- S. Van de Vyver, C. Odermatt, K. Romero, T. Prasomsri and Y. Román-Leshkov, ACS Catal., 2015, 5, 972–977 CrossRef CAS.
- Y. Wang, J. D. Lewis and Y. Román-Leshkov, ACS Catal., 2016, 6, 2739–2744 CrossRef CAS.
- O. Kikhtyanin, P. Chlubná, T. Jindrová and D. Kubička, Dalton Trans., 2014, 43, 10628–10641 RSC.
- M. Su, W. Li, T. Zhang, H. Shen, S. Li, W. Fan and L. Ma, Catal. Sci. Technol., 2017, 7, 3555–3561 RSC.
- G. Yan, Y. Zhang, W. Di and W. Qin, Dyes Pigm., 2018, 159, 28–34 CrossRef CAS.
- H. Liu and Z. Ma, Chin. J. Chem. Eng., 2018, 26, 109–115 CrossRef.
- H. Wu, P. Jin, Y. Sun, M. Yang, C. Huang, W. Weng and H. Wan, J. Mol. Catal. A: Chem., 2016, 414, 1–8 CrossRef CAS.
- Y. You, C. Shi, H. Chang, L. Guo, L. Xu and J. Li, Mol. Catal., 2018, 453, 47–54 CrossRef CAS.
- S. Kouass, A. Fadhalaoui, M. Kahlaoui, H. Dhaouadi and F. Touati, Mater. Lett., 2018, 217, 75–78 CrossRef CAS.
- J. Shi, H. Feng, C. Qv, D. Zhao, S. Hong and N. Zhang, Appl. Catal., A, 2018, 561, 127–136 CrossRef CAS.
- Y. Zeng, Y. Wang, S. Zhang, Q. Zhong, W. Rong and X. Li, J. Colloid Interface Sci., 2018, 524, 8–15 CrossRef CAS PubMed.
- T. O. Shekunova, A. E. Baranchikov, O. S. Ivanova, L. S. Skogareva, N. P. Simonenko, Yu. A. Karavanova, V. A. Lebedev, L. P. Borilo and V. K. Ivanov, J. Non-Cryst. Solids, 2016, 447, 183–189 CrossRef CAS.
- Y. Wang, S. Wang, K. Ou, Y. Zhang, L. Bai and L. Yi, Optik, 2019, 178, 944–949 CrossRef CAS.
- D. Palma-Ramírez, M. A. Domínguez-Crespo, A. M. Torres-Huerta, V. A. Escobar-Barrios, H. Dorantes-Rosales and H. Willcock, Polymer, 2018, 142, 356–374 CrossRef.
- S. Kanai, I. Nagahara, Y. Kita, K. Kamata and M. Hara, Chem. Sci., 2017, 8, 3146–3153 RSC.
- L. Wang, F. Yuan, X. Niu, C. Kang, P. Li, Z. Li and Y. Zhu, RSC Adv., 2016, 6, 40175–40184 RSC.
- Y. Sasaki, K. Ishii and Y. Kashiwaya, J. Mater. Sci. Lett., 2001, 20, 1071–1075 CrossRef.
- J. Pang, X. Li, W. Zou, C. Tang, Y. Wang and L. Dong, ChemistrySelect, 2018, 3, 12389–12395 CrossRef CAS.
- P. Maitarad, J. Han, D. Zhang, L. Shi, S. Namuangruk and T. Rungrotmongkol, J. Phys. Chem. C, 2014, 118, 9612–9620 CrossRef CAS.
- Y. Yu, B. He, Y. Liao, X. Yu, Z. Mu, Y. Xing and S. Xing, ChemElectroChem, 2018, 5, 793–798 CrossRef CAS.
- Y. Lin, S. Wu, X. Li, X. Wu, C. Yang, G. Zeng, Y. Peng, Q. Zhou and L. Li, Appl. Catal., B, 2018, 227, 557–570 CrossRef CAS.
- Y. Lin, S. Wu, C. Yang, M. Chen and X. Li, Appl. Catal., B, 2019, 245, 71–86 CrossRef CAS.
Footnote |
| † Electronic supplementary information (ESI) available. See DOI: 10.1039/c9ra02937k |
| This journal is © The Royal Society of Chemistry 2019 |


