DOI:
10.1039/C9RA03035B
(Paper)
RSC Adv., 2019,
9, 21804-21809
Deep oxidative desulfurization of model fuels catalysed by immobilized ionic liquid on MIL-100(Fe)
Received
24th April 2019
, Accepted 6th July 2019
First published on 15th July 2019
Abstract
Deep desulfurization of fossil fuels has become urgently required because of the serious pollution by the large-scale use of fossil fuels. In this study, [PrSO3HMIm]HSO4@MIL-100(Fe) was synthesized by wet-impregnation of the ionic liquid (IL) of [PrSO3HMIm]HSO4 on MIL-100(Fe). The construction of [PrSO3HMIm]HSO4@MIL-100(Fe) was then confirmed by X-ray powder diffraction, N2 adsorption–desorption experiments, infrared spectroscopy and elemental analysis, and then applied in the oxidative desulfurization of model fuels. In comparison with the corresponding IL, [PrSO3HMIm]HSO4@MIL-100(Fe) showed an enhanced performance in the desulfurization rate of model fuels due to the increase of the mass transfer rate. Under the optimized conditions (oxidant to sulphur ratio = 25, oil to acetonitrile ratio = 1, and temperature = 60 °C), a sulphur removal rate of 99.3% was observed (initial sulphur concentration = 50 ppm). The sulphur removal of three sulphur compounds by catalytic oxidation and extraction followed the order of dibenzothiophene (DBT) > thiophene (T) > benzothiophene (BT).
1 Introduction
The rapid development of the automotive industry has greatly exacerbated the use of fossil fuels.1–5 After combustion, the organic compounds in gasoline are converted to carbon oxides (COx), nitrogen oxides (NOx) and sulphur oxides (SOx), among which, sulphur oxides are one of the important reasons for haze and acid rain.6–9 Sulphide emissions from burning gasoline can cause harm to the human lungs and respiratory system, resulting in throat spasms and suffocation.10 Currently, the sulphur content in gasoline in China must be from 50 μg g−1 to 10 μg g−1 according to the National standard of gasoline for motor vehicles (GB17930-2013 and GB17930-2016). Above all, it is necessary to reduce the sulphur content of gasoline and reduce the emission of sulphur oxides into the atmosphere.11–13
The oxidative desulfurization (ODS) technology has many advantages such as mild reaction conditions,14 high desulfurization rate, simple process and low equipment investment, compared with traditional hydrodesulfurization methods. ODS has been widely used for the development of ultra-low sulphur products.15,16 The catalysts used for oxidative desulfurization are very critical. In recent years, IL catalysts has been used in the oxidative desulfurization reaction in gasoline.17–19 However, although these IL catalysts are efficient in desulfurization, the ILs cannot be directly separated and recovered because they are easily dissolved in extracting agents, such as acetonitrile,20 which is not conducive to industrialization. In this study, a new catalyst, [PrSO3HMIm]HSO4@MIL-100, was synthesized by wet impregnation. The effect of several important factors, including the loading amount, reaction temperature, desulfurization system, catalyst dosage, and the recycling of catalyst, on the desulfurization efficiency was studied.
2 Experimental
2.1 Materials
Iron(III) chloride hexahydrate (FeCl3·6H2O) and ethanol were obtained from Damao Chemical Reagent Factory. Acetonitrile, n-octane, 1,3,5-benzenetricarboxylic acid (H3BTC), thiophene (T), benzothiophenen (BT) and dibenzothiophene (DBT) were purchased from J&K Scientific Ltd. 1-Sulfopropyl-3-methyl-imidazolium hydrosulphate ([PrSO3HMIm]HSO4) was obtained from Lanzhou Greenchem ILs. All solvents and reagents were used as received without further purification.
2.2 Synthesis of MIL-100(Fe)
MIL-100(Fe) was synthesized according to the previous report under the following methods.21,22 A mixture of FeCl3·6H2O (0.010 mol, 2.70 g) and BTC (0.066 mol, 1.39 g) was dispersed in 50 mL distilled water under weak sonication and was then reacted for 72 h at 130 °C in a Teflon lined autoclave. After being cooled down to room temperature, the light orange solid product was further purified by centrifugation at 6000 rpm for 10 min with ethanol (50 mL × 3). Then the highly purified solid was dried under vacuum at 60 °C overnight.
2.3 Synthesis of [PrSO3HMIm]HSO4@MIL-100(Fe)
[PrSO3HMIm]HSO4@MIL-100(Fe) was prepared by wet impregnation.23,24 A certain amount of anhydrous [PrSO3HMIm]HSO4 was dissolved in 50 mL ethanol. After complete dissolution, 15 g activated MIL-100(Fe) was added to the solution and subjected to continuous magnetic stirring for 24 h. Then, filtration was employed to remove the redundant solvent, followed by drying in vacuum at 80 °C overnight. The orange powder product was donated as X-[PrSO3HMIm]HSO4@MIL-100 (X mmol g−1 [PrSO3HMIm]HSO4@MIL-100), where X means the adding amount of [PrSO3HMIm]HSO4 in the solution (X = 0.7, 0.9, 1.1, 1.3, 1.5).
2.4 Desulfurization
Dibenzothiophene (0.05 g, DBT) was completely dissolved into n-octane to prepare model oil with the sulphur content of 50 ppm. Similarly, the model oils with different sulphur compounds, including thiophene and benzothiophenen, was prepared. The catalyst, acetonitrile and 10 mL model oil were added into a flask. Then the flask was in an oil bath at the desired temperature and stirred for 15 min. H2O2 was injected into the flask. After the start of the reaction, the stirring was stopped at regular intervals, the samples from the upper oil phase were withdrawn and filtered with an organic filter, then sulphur content in the samples were determined by the WK-2D micro-coulometer (Jiangfen Electroanalytical instrument Co., Ltd, China, detection limit: 0.1 ng mL−1). And the conversion rate of the sulphur was calculated according to eqn (1):| |
 | (1) |
where, R is the desulfurization rate, C0 is the initial sulphur content of the oil, and Ce is the sulphur content of the oil after desulfurization.
2.5 Characterization
X-Ray Diffraction (XRD) patterns were collected with a Bruker D8 ADVANCE diffractometer using Cu Kα radiation at a scanning rate of 1° min−1 between 5° and 40°. Infrared spectra were recorded in KBr discs with a Bruker Fourier-transform infrared (FT-IR) spectrometer. The specific surface areas and pore size distributions were obtained from N2 adsorption–desorption isotherms measured on a Micromeritics ASAP-2010 instrument at −196 °C. The contents of C, H, N, and S in the composite material were measured using Elementar's Vario EL III elemental analyzer.
3 Results and discussion
3.1 X-ray diffraction (XRD) analysis
The powder XRD patterns of the virgin MOFs and a series of ILs@MOF are exhibited in Fig. 1. These diffraction patterns agreed with those reported in the literature.25–29 The peak at 10.9° indicated that the pattern corresponded to the reported MIL-100(Fe). The XRD patterns of the ILs@MIL-100(Fe) materials were similar to that of the parent material MIL-100(Fe), which indicated that the crystal structure of MIL-100(Fe) was preserved after the incorporation of [PrSO3HMIm]HSO4, and adding IL did not change the crystal form of MIL-100.
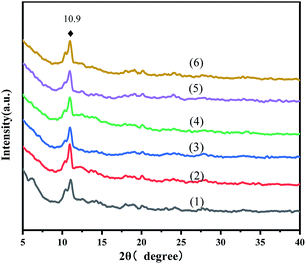 |
| | Fig. 1 XRD patterns of MIL-100(Fe) (1) and X-[PrSO3HMIm]HSO4@MIL-100(Fe) (2–6, X = 0.7, 0.9, 1.1, 1.3, 1.5). | |
3.2 Fourier transform infrared (FT-IR)
The FT-IR spectra of MIL-100(Fe), X-[PrSO3HMIm]HSO4@MIL-100(Fe) and [PrSO3HMIm]HSO4 were recorded in the spectral range of 4000–400 cm−1 (Fig. 2). The peaks of [PrSO3HMIm]HSO4 at 1224 and 1046 cm−1 were related to ν(O![[double bond, length as m-dash]](https://www.rsc.org/images/entities/char_e001.gif) S) asymmetric and symmetric stretching vibrations of the sulfonic acid group.20–22 The characteristic peaks of MIL-100(Fe) at 1714 and 1383 cm−1 attributed to ν(C
S) asymmetric and symmetric stretching vibrations of the sulfonic acid group.20–22 The characteristic peaks of MIL-100(Fe) at 1714 and 1383 cm−1 attributed to ν(C![[double bond, length as m-dash]](https://www.rsc.org/images/entities/char_e001.gif) O) stretching vibration and ν(C–O) stretching vibration in the MIL-100(Fe) matrix could be observed.22,30–32 The characteristic vibrational bands of the C
O) stretching vibration and ν(C–O) stretching vibration in the MIL-100(Fe) matrix could be observed.22,30–32 The characteristic vibrational bands of the C![[double bond, length as m-dash]](https://www.rsc.org/images/entities/char_e001.gif) C and C
C and C![[double bond, length as m-dash]](https://www.rsc.org/images/entities/char_e001.gif) N group at 1573 and 1457 cm−1 were also observed corresponding to the imidazole ring.33,34 It was concluded that [PrSO3HMIm]HSO4 was successfully supported on MIL-100(Fe).
N group at 1573 and 1457 cm−1 were also observed corresponding to the imidazole ring.33,34 It was concluded that [PrSO3HMIm]HSO4 was successfully supported on MIL-100(Fe).
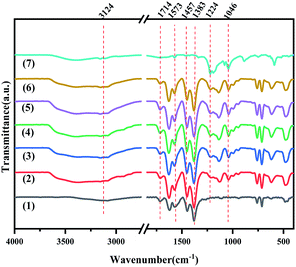 |
| | Fig. 2 The FT-IR spectra of MIL-100(Fe) (1), X-[PrSO3HMIm]HSO4@MIL-100(Fe) (2–6) (X = 0.7, 0.9, 1.1, 1.3, 1.5) and [PrSO3HMIm]HSO4 (7). | |
3.3 Elemental analysis
The S and N elements of the X-[PrSO3HMIm]HSO4@MIL-100(Fe) (X = 0.7, 0.9, 1.1, 1.3, 1.5) composites were analysed to calculate the amount of IL in the hybrid materials. It could be seen from the Table 1 that the S and N elements in the hybrid material showed an increasing trend with the increase of the adding amount of IL, indicating that more IL groups were grafted into the pores of MIL-100(Fe) when more IL was added. The actual loading of [PrSO3HMIm]HSO4 could be calculated by the percentage content of the S elements in the hybrid material. According to the results, it can be seen from Table 1 that there were some certain differences between the actual loading and the theoretical one, because a part of ionic liquids on the surface of the materials were washed away during the process of synthesizing the composite materials.
Table 1 Elemental analysis of MIL-100(Fe) and X-ILs@MIL-100(Fe)
| Samples |
S (wt%) |
N (wt%) |
Actual loading (mmol g−1) |
| MIL-100(Fe) |
— |
1.019 |
— |
| 0.7-ILs@MIL-100(Fe) |
3.515 |
1.516 |
0.549 |
| 0.9-ILs@MIL-100(Fe) |
3.990 |
1.642 |
0.623 |
| 1.1-ILs@MIL-100(Fe) |
4.474 |
1.800 |
0.699 |
| 1.3-ILs@MIL-100(Fe) |
4.921 |
1.940 |
0.769 |
| 1.5-ILs@MIL-100(Fe) |
5.492 |
2.173 |
0.858 |
3.4 N2 adsorption–desorption experiment
Fig. 3 show N2 adsorption–desorption isotherms of MIL-100(Fe) and X-[PrSO3HMIm]HSO4@MIL-100(Fe). The BET surface area and pore volume were obtained from nitrogen physisorption isotherms at 77 K, and the results are given in Table 2.
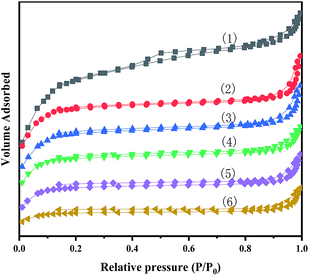 |
| | Fig. 3 N2 adsorption–desorption isotherms for MIL-100(Fe) (1) and X-[PrSO3HMIm]HSO4@MIL-100(Fe) (2–6) (X = 0.7, 0.9, 1.1, 1.3, 1.5). | |
Table 2 Structural properties of MIL-100(Fe) and X-ILs@MIL-100(Fe) (X = 0.7, 0.9, 1.1, 1.3, 1.5) characterized by N2 adsorption
| Samples |
BET surface area (m2 g−1) |
Pore volume (cm3 g−1) |
| MIL-100(Fe) |
1168.1 |
0.74 |
| 0.7-ILs@MIL-100(Fe) |
785.6 |
0.47 |
| 0.9-ILs@MIL-100(Fe) |
674.5 |
0.42 |
| 1.1-ILs@MIL-100(Fe) |
525.7 |
0.33 |
| 1.3-ILs@MIL-100(Fe) |
418.2 |
0.26 |
| 1.5-ILs@MIL-100(Fe) |
170.0 |
0.13 |
It could be seen that the N2 adsorption–desorption isotherms of the series of composites showed a type IV isotherms. There were also hysteresis loops, which were characteristic of mesoporous or microporous materials. In addition, the pore sizes of the samples were greater than 2 nm, indicating that they were both mesoporous materials, and the structure of MIL-100(Fe) were not significantly altered by loading the ionic liquids by the impregnation method. The BET surface area and pore volume for the prepared MIL-100(Fe) was 1168.1 m2 g−1 and 0.74 cm3 g−1, respectively, close to the values reported in the literature.28,30 According to the results, the specific surface area and pore volume decreased after the impregnation process. The decrease could be related to the pore blocking of the support by the attachment of ILs.35
3.5 Catalytic activities for ODS
3.5.1 Effects of time and loading amount on oxidative desulfurization. The ILs loading amount had a significant effect on the reaction. It was evident from Fig. 4 that ODS was catalysed by various catalysts. The desulfurization efficiency of the [PrSO3HMIm]HSO4@MIL-100(Fe) systems was higher than that of the virgin MIL-100(Fe) and [PrSO3HMIm]HSO4 under the same catalysis conditions. The activity was improved by increasing the contents of [PrSO3HMIm]HSO4 in the [PrSO3HMIm]HSO4@MIL-100(Fe) system from 0.7 to 1.1 mmol g−1, and the sulphur removal ratio of 1.1-[PrSO3HMIm]HSO4@MIL-100(Fe) reached 99.31%, showing a beneficial effect of [PrSO3HMIm]HSO4 during the catalysis. However, the sulphur removal of 1.3-ILs@MIL-100(Fe) and 1.5-ILs@MIL-100(Fe) was lower than that of 1.1-ILs@MIL-100(Fe). We speculated that the increased acid ion loading resulted in a reduced MIL-100(Fe) pore volume and reaction specific surface area, which reduced the mass transfer efficiency.36,37 Thus, the loading amount of 1.1 mmol g−1 and the optimal time of 180 min were proper for the following investigation, respectively.
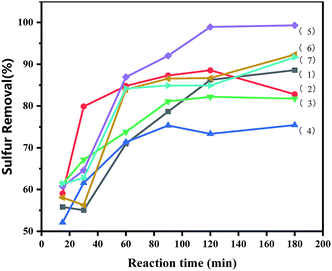 |
| | Fig. 4 Effects of reaction time and loading amount of IL on oxidative desulfurization. (1) [PrSO3HMIm]HSO4, (2) MIL-100(Fe), (3–7) X-ILs@MIL-100(Fe) (X = 0.7, 0.9, 1.1, 1.3, 1.5), the following conditions were used: catalyst, 0.05 g; model oil, 10 mL; acetonitrile, 10 mL; H2O2, 28 μL; t, 180 min; T, 60 °C. | |
3.5.2 Effects of catalyst dosage on oxidative desulfurization. The effects of catalyst dosage on the DBT oxidation were studied systematically. As shown in Fig. 5, the DBT removal was enhanced dramatically with the increasing catalyst usage from 0.03 g to 0.05 g, which can be attributed to the increase of the total amount of the catalytic active sites. Apparently, 0.05 g of catalyst had offered enough catalytic active sites to the conversion of DBT. However, the removal of DBT was decreased with the increasing catalyst usage from 0.05 g to 0.06 g. It may be that more catalysts would promote self-decomposition of H2O2, generating oxygen and water, which was not only detrimental to the progress of the oxidation reaction,11 but also cause waste of the catalysts. So, the optimal catalyst dosage was 0.05 g.
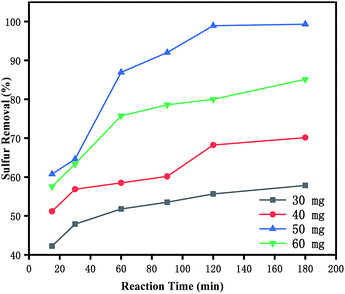 |
| | Fig. 5 Effects of catalyst dosage on oxidative desulfurization. (Black) 0.03 g, (red) 0.04 g, (blue) 0.05 g, and (green) 0.06 g. The experiments were conducted under the following conditions: model oil, 10 mL; acetonitrile, 10 mL; H2O2, 28 μL; t, 180 min; T, 60 °C. | |
3.5.3 Effects of the H2O2/DBT molar ratios on oxidative desulfurization. To investigate the influence of the oxidant dosage, the experiment was carried out under various H2O2/DBT (O/S) molar ratios at 60 °C. As shown in Fig. 6, the removal of DBT increased with the increase of the H2O2 dosage (O/S ≤ 25), which can be attributed to the increasing production quantity of the catalytic activity species. When O/S = 25, the sulphur removal was 99.31%. However, when a higher amount of H2O2 was added, the sulphur removal decreased. On the one hand, this confirmed that water had a negative effect on the desulfurization as the amount of the introduced water increased with the increasing amount of hydrogen peroxide.9,38 On the other hand, excess H2O2 enhanced the hydrogen bond between the catalyst particles in the acetonitrile phase, leading to transfer of the agglomerated catalyst into the oil phase, and thus its less availability for ODS which consequently resulted in lower desulfurization rate.39,40
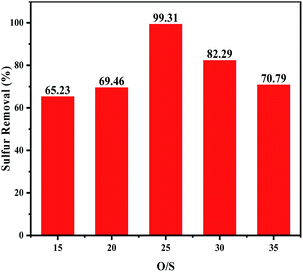 |
| | Fig. 6 Effects of H2O2/DBT ratio on oxidative desulfurization. The experiments were conducted under the following conditions: catalyst, 0.05 g; model oil, 10 mL; acetonitrile, 10 mL; t, 180 min; T, 60 °C. | |
3.5.4 Removal of different sulphur substrates. To investigate the effects of [PrSO3HMIm]HSO4@MIL-100(Fe) on different sulphur compounds, ODS of DBT, BT and T were carried out under the same conditions. The removal rates of DBT, BT and T were shown in Fig. 7. The desulfurization reactivity followed the order: DBT > T > BT. The reactivity should follow the order of the electron density because the removal of sulphur substrates is mainly affected by the electron density on the sulphur atom.41 The unusual lowest reactivity of BT can be attributed to the steric hindrance. These results suggested that the reactivity order was affected by the simultaneous effects of the electron density on the sulphur atom and the steric hindrance of the sulphur compounds in this ODS system. Similar results were present in Lv's studies,42,43 they found that sulphur removal selectivity also followed the order of DBT > BT in their ionic liquids extraction coupled with oxidation desulfurization systems (ECODS), and the catalytic activity of DBT removal could reach 98% at 30 °C in 3 h.
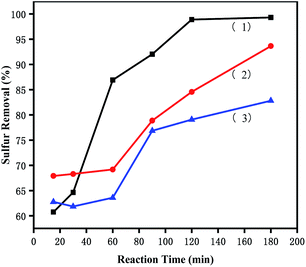 |
| | Fig. 7 Effects of different sulphur substrates on oxidative desulfurization. (1) DBT, (2) T, and (3) BT. The experiments were conducted under the following conditions: catalyst, 0.05 g; model oil, 10 mL; acetonitrile, 10 mL; H2O2, 28 μL; t, 180 min; T, 60 °C. | |
3.5.5 Recycling of catalysts. The catalysts were separated by centrifugation and dried under vacuum at 353 K for 12 h for regeneration. The reutilization for the removal of DBT was performed maintaining the same experimental conditions for each cycle. As is shown in Fig. 8, the catalytic performance of the catalyst decreased to 70% after five cycles, while the sulphur removal in the ECODS systems could remain above 85% after recycling six times in Lv's studies.42,43 The rapid decrease could mainly be attributed to the partial loss of the ionic liquid during the reaction. This show that the carrier with the proper pore structure had a great influence on the catalytic oxidative desulfurization performance.
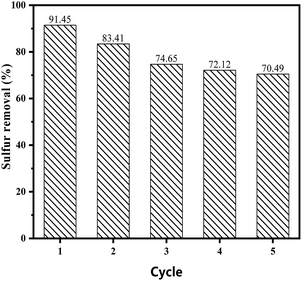 |
| | Fig. 8 Recycling of the catalyst on the sulphur removal in the reaction system. | |
3.5.6 Proposed mechanism of coupled oxidation extraction desulfurization. Several studies have shown that high desulfurization rate can be achieved with H2O2 or molecular oxygen as oxidants and different kinds of ionic liquids as catalysts or extractants. In this paper, a coupled oxidation extraction desulfurization mechanism is proposed according to these studies.42–46 As seen in Scheme 1, take DBT as an example, firstly, some kinds of radicals (mainly, HO2˙)47–49 could be produced by H2O2 with the acidic [PrSO3HMIm]HSO4 and the Brønsted acid sites in MIL-100(Fe) as the catalysts. DBT was then oxidized to the corresponding sulfones by these radicals. Due to their high polarity, the sulfones could be easily removed from the model oil phase by a polar extractant, such as acetonitrile in this study. The sulphur-free fuel was then obtained, and the heterogeneous catalyst ([PrSO3HMIm]HSO4@MIL-100(Fe)) could be recycled by static settlement or centrifugation.
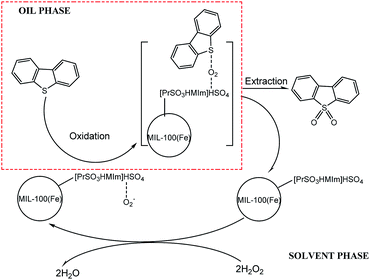 |
| | Scheme 1 Proposed mechanism of coupled oxidation extraction desulfurization. | |
4 Conclusions
In summary, [PrSO3HMIm]HSO4 immobilized in MIL-100(Fe) was successfully synthesized through wet-impregnation. The XRD, FT-IR, EA and N2 adsorption–desorption indicated that the ILs@MIL-100(Fe) samples remained in the mesoporous structure of MIL-100(Fe). The [PrSO3HMIm]HSO4@MIL-100(Fe) catalysts displayed significantly higher catalytic performance than [PrSO3HMIm]HSO4 for the oxidative desulfurization of DBT. In the experimental system, the effects of different ILs loading, catalyst dosage, O/S ratio, and different sulphur substrates on the desulfurization rate were investigated, and the optimum reaction conditions were determined. The 1.1-[PrSO3HMIm]HSO4@MIL-100(Fe) sample had the highest oxidative desulfurization efficiency, by which, the sulphur removal of DBT reached 99.3%.
Conflicts of interest
There are no conflicts to declare.
Acknowledgements
This research was funded by National Natural Science Foundation of China (Grant No. 21676099), and the Fundamental Research Funds for the Central Universities, South China University of Technology.
Notes and references
- J. Wu, Y. Gao, W. Zhang, Y. Tan, A. Tang, Y. Men and B. Tang, Appl. Organomet. Chem., 2015, 29, 96–100 CrossRef CAS.
- D. Bokare and W. Choi, J. Hazard. Mater., 2016, 304, 313–319 CrossRef.
- A. Stanislaus, A. Marafi and M. S. Rana, Catal. Today, 2010, 153, 1–68 CrossRef CAS.
- W. Jiang, W. Zhu, Y. Chang, Y. Chao, S. Yin, H. Liu, F. Zhu and H. Li, Chem. Eng. J., 2014, 250, 48–54 CrossRef CAS.
- C. Li, D. Li, S. Zou, Z. Li, J. Yin, A. Wang, Y. Cui, Z. Yao and Q. Zhao, Green Chem., 2013, 15, 2793–2799 RSC.
- W. Ding, W. Zhu, J. Xiong, L. Yang, A. Wei, M. Zhang and H. Li, Chem. Eng. J., 2015, 266, 213–221 CrossRef CAS.
- U. Domanska and M. Wlazlo, Fuel, 2014, 134, 114–125 CrossRef CAS.
- P. S. Kulkarni and C. A. M. Afonso, Green Chem., 2010, 12, 1139–1149 RSC.
- H. Liu, S. Bao, Z. Cai, T. Xu, N. Li, L. Wang, H. Chen, W. Lu and W. Chen, Chem. Eng. J., 2017, 317, 1092–1098 CrossRef CAS.
- Z. Klimont, S. J. Smith and J. Cofala, Environ. Res. Lett., 2013, 8, 014003 CrossRef.
- B. Jiang, H. Yang, L. Zhang, R. Zhang, Y. Sun and Y. Huang, Chem. Eng. J., 2016, 283, 89–96 CrossRef CAS.
- B. Rodriguez-Cabo, H. Rodriguez, E. Rodil, A. Arce and A. Soto, Fuel, 2014, 117, 882–889 CrossRef CAS.
- J. Xiong, W. Zhu, H. Li, Y. Xu, W. Jiang, S. Xun, H. Liu and Z. Zhao, AIChE J., 2013, 59, 4696–4704 CrossRef CAS.
- V. C. Srivastava, RSC Adv., 2012, 2, 759–783 RSC.
- C. Dai, J. Zhang, C. Huang and Z. Lei, Chem. Rev., 2017, 117, 6929–6983 CrossRef CAS.
- L. Li, J. Zhang, C. Shen, Y. Wang and G. Luo, Fuel, 2016, 167, 9–16 CrossRef CAS.
- H. Jin, Y. Li, X. Liu, Y. Ban, Y. Peng, W. Jiao and W. Yang, Chem. Eng. Sci., 2015, 124, 170–178 CrossRef CAS.
- W. Jiang, W. Zhu, H. Li, X. Wang, S. Yin, Y. Chang and H. Li, Fuel, 2015, 140, 590–596 CrossRef CAS.
- Y. Nie, Y. Dong, L. Bai, H. Dong and X. Zhang, Fuel, 2013, 103, 997–1002 CrossRef CAS.
- C. Chen, Z. Wu, Y. Que, B. Li, Q. Guo, Z. Li, L. Wang, H. Wan and G. Guan, RSC Adv., 2016, 6, 54119–54128 RSC.
- H. Wan, C. Chen, Z. Wu, Y. Que, Y. Feng, W. Wang, L. Wang, G. Guan and X. Liu, ChemcatChem, 2015, 7, 441–449 CrossRef CAS.
- M. Han, Z. Gu, C. Chen, Z. Wu, Y. Que, Q. Wang, H. Wan and G. Guan, RSC Adv., 2016, 6, 37110–37117 RSC.
- J. Wang, D. Xie, Z. Zhang, Q. Yang, H. Xing, Y. Yang, Q. Ren and Z. Bao, AIChE J., 2017, 63, 2165–2175 CrossRef CAS.
- F. P. Kinik, A. Uzun and S. Keskin, ChemSusChem, 2017, 10, 2842–2863 CrossRef CAS.
- N. M. Mahmoodi, J. Abdi, M. Oveisi, M. A. Asli and M. Vossoughi, Mater. Res. Bull., 2018, 100, 357–366 CrossRef CAS.
- S. Huang, K. Yang, X. Liu, H. Pan, H. Zhang and S. Yang, RSC Adv., 2017, 7, 5621–5627 RSC.
- Z. Chen, B. Xu, X. Wang, L. Zhang, X. Yang and C. Li, Catal. Commun., 2017, 102, 17–20 CrossRef CAS.
- S. D. Taherzade, J. Soleimannejad and A. Tarlani, Nanomaterials, 2017, 7, 215 CrossRef.
- D. Wang, Y. Pan, L. Xu and Z. Li, J. Catal., 2018, 361, 248–254 CrossRef CAS.
- N. U. Qadir, S. A. M. Said, R. B. Mansour, K. Mezghani and A. Ul-Hamid, Dalton Trans., 2016, 45, 15621–15633 RSC.
- J. Cai, X. Wang, Y. Zhou, L. Jiang and C. Wang, Phys. Chem. Chem. Phys., 2016, 18, 10864–10867 RSC.
- Y. Kong, X. Cheng, H. An, X. Zhao and Y. Wang, Chin. J. Chem. Eng., 2018, 26, 330–336 CrossRef.
- F. Zhang, J. Shi, Y. Jin, Y. Fu, Y. Zhong and W. Zhu, Chem. Eng. J., 2015, 259, 183–190 CrossRef CAS.
- S. Abednatanzi, A. Abbasi and M. Masteri-Farahani, Catal. Commun., 2017, 96, 6–10 CrossRef CAS.
- L. Zhang, S. Wu, Y. Liu, F. Wang, X. Han and H. Shang, Appl. Organomet. Chem., 2016, 30, 684–690 CrossRef CAS.
- J. Xiong, W. Zhu, W. Ding, L. Yang, Y. Chao, H. Li, F. Zhu and H. Li, Ind. Eng. Chem. Res., 2014, 53, 19895–19904 CrossRef CAS.
- F. Zhang, Y. Jin, J. Shi, Y. Zhong, W. Zhu and M. S. El-Shall, Chem. Eng. J., 2015, 269, 236–244 CrossRef CAS.
- X. Shi, M. Sun, J. Fan, P. Wang, W. Ma and J. Wei, Appl. Organomet. Chem., 2015, 29, 633–637 CrossRef CAS.
- H. Azimzadeh, A. Akbari and M. R. Omidkhah, Chem. Eng. J., 2017, 320, 189–200 CrossRef CAS.
- L. Lu, S. Cheng, J. Gao, G. Gao and M. He, Energy Fuels, 2007, 21, 383–384 CrossRef CAS.
- M. Zhang, W. Zhu, S. Xun, H. Li, Q. Gu, Z. Zhao and Q. Wang, Chem. Eng. J., 2013, 220, 328–336 CrossRef CAS.
- H. Lv, W. Ren, H. Wang, Y. Wang, W. Chen and Z. Suo, Appl. Catal., A, 2013, 453, 376–382 CrossRef.
- H. Lv, C. Deng, W. Ren and X. Yang, Fuel Process. Technol., 2014, 119, 87–91 CrossRef.
- C. Li, Z. Jiang, J. Gao, Y. Yang, S. Wang, F. Tian, F. Sun, X. Sun, P. Ying and C. Han, Chem.–Eur. J., 2004, 10, 2277–2280 CrossRef CAS.
- M. Craven, D. Xiao, C. Olsen, E. Kozhevnikova, F. Blanc, A. Steiner and I. V. Kozhevnikov, Appl. Catal., B, 2018, 231, 82–91 CrossRef CAS.
- S. Gao, J. Lia, X. Chen, A. A. Abdeltawab, S. M. Yakout and G. Yu, Fuel, 2018, 224, 545–551 CrossRef CAS.
- W. Zhu, C. Wang, H. Li, P. Wu, S. Xun, W. Jiang, Z. Chen, Z. Zhao and H. Li, Green Chem., 2015, 17, 2464–2472 RSC.
- P. Wu, W. Zhu, Y. Chao, J. Zhang, P. Zhang, H. Zhu, C. Li, Z. Chen, H. Li and S. Dai, Chem. Commun., 2016, 52, 144–147 RSC.
- W. Jiang, H. Jia, H. Li, L. Zhu, R. Tao, W. Zhu, H. Li and S. Dai, Green Chem., 2019, 21, 3074–3080 RSC.
|
| This journal is © The Royal Society of Chemistry 2019 |
Click here to see how this site uses Cookies. View our privacy policy here.  Open Access Article
 *
*


![[double bond, length as m-dash]](https://www.rsc.org/images/entities/char_e001.gif) S) asymmetric and symmetric stretching vibrations of the sulfonic acid group.20–22 The characteristic peaks of MIL-100(Fe) at 1714 and 1383 cm−1 attributed to ν(C
S) asymmetric and symmetric stretching vibrations of the sulfonic acid group.20–22 The characteristic peaks of MIL-100(Fe) at 1714 and 1383 cm−1 attributed to ν(C![[double bond, length as m-dash]](https://www.rsc.org/images/entities/char_e001.gif) O) stretching vibration and ν(C–O) stretching vibration in the MIL-100(Fe) matrix could be observed.22,30–32 The characteristic vibrational bands of the C
O) stretching vibration and ν(C–O) stretching vibration in the MIL-100(Fe) matrix could be observed.22,30–32 The characteristic vibrational bands of the C![[double bond, length as m-dash]](https://www.rsc.org/images/entities/char_e001.gif) C and C
C and C![[double bond, length as m-dash]](https://www.rsc.org/images/entities/char_e001.gif) N group at 1573 and 1457 cm−1 were also observed corresponding to the imidazole ring.33,34 It was concluded that [PrSO3HMIm]HSO4 was successfully supported on MIL-100(Fe).
N group at 1573 and 1457 cm−1 were also observed corresponding to the imidazole ring.33,34 It was concluded that [PrSO3HMIm]HSO4 was successfully supported on MIL-100(Fe).


