DOI:
10.1039/C9RA03109J
(Paper)
RSC Adv., 2019,
9, 26373-26380
Micro-mechanical properties of a novel silicon nitride fiber reinforced silicon carbide matrix composite via in situ nano-indentation method
Received
25th April 2019
, Accepted 7th August 2019
First published on 22nd August 2019
Abstract
A novel Si3N4 fiber reinforced SiC matrix composite has been prepared and the micro-mechanical properties of the composites in situ have been explored. For the Si3N4 fibers, the micro-mechanical properties in situ remained almost unchanged with the increasing fabrication temperatures. In comparison, for the PCS derived SiC matrix, higher fabrication temperature could trigger more β-SiC formations, which led to enlarging the corresponding micro-mechanical properties. The microstructure analysis of the interfacial zones in the composites revealed strong interfacial reactions existing in the composites fabricated at ≥800 °C. Therefore, the interfacial shear strength of the composite was significantly increased from ∼420 MPa to ∼535 MPa with the fabrication temperature increasing from 800 °C to 1200 °C, thus impeding the toughening mechanisms of the composites. After introducing BN interphase, the interfacial shear strength was significantly reduced to ∼140 MPa and the flexural strength was increased from ∼140 MPa to ∼250 MPa. The work highlights the efficiency of introducing BN interphase to weaken the interfacial interaction, thus to enhance the macro-mechanical properties.
1 Introduction
The silicon carbide (SiC) ceramic has excellent mechanical strength at elevated temperature, high oxidation resistance, and high thermal conductivity, etc.1–5 In addition, owing to the excellent semiconductivity and relatively stable dielectric properties at elevated temperature, SiC can be extended to the potential application for microwave absorption materials at high temperature.6,7 However, due to the inherent brittle failure behavior of monolithic SiC ceramic, it has been gradually substituted by ceramic fibers reinforced SiC matrix composites, like Cf/SiC, SiCf/SiC and Si3N4f/SiC composites, which can significantly improve the toughness of monolithic SiC ceramic.8–11 Among these fiber reinforcements, Si3N4 fiber, owing to its high oxidation resistance and superior electrical insulating property at elevated temperature, is an optimal candidate for the reinforcement of SiC matrix composites in the application for microwave absorption materials.12–14 However, to the best of our knowledge, the systematic mechanical properties of the Si3N4f/SiC composites have been rarely reported in detail.
Motivated by this, the mechanical properties of the Si3N4f/SiC composites fabricated at different temperatures were investigated, including micro- and macro- mechanical properties. The macro-mechanical properties of ceramic fiber reinforced ceramic matrix composites (CFRCMCs), like flexural strength and fracture toughness, can be easily obtained through the testing standards.15 However, due to the test method limitations, the micro-mechanical properties in situ, like the Young's modulus and the fracture toughness of both fiber and matrix, the interfacial shear strength of the fiber/matrix interface, have been barely reported systematically. As is well-known, since the mechanical property of the composites in a micro scale has significant effect on the ultimate strength of the composites, it is critical to study fundamentally the micro-mechanical property in situ. Fortunately, benefited from the development of the instrumented micro-mechanical testing methods like nanoindentation,16–21 fiber push-in/push-out,22–25 micropillar splitting method,26,27 etc., the micro-mechanical properties in situ can be achieved. For example, the Young's modulus and hardness of the ceramic matrix and the ceramic fiber can be quantified by the nanoindentation method; the interfacial shear strength can be measured based on the fiber-push-in/push-out methods.
In addition, due to the predictably interface reactions at the fiber/matrix interface during high-temperature fabrication process (≥800 °C), the Si3N4f/SiC composites can be very brittle, which may lead to catastrophic failures when they are sustained complex stress states.28 By using proper interphase, the interfacial interaction in the composites can be effectively weakened, thus a typical toughening mechanism, crack deflection at interface, can be triggered. BN interphase with low dielectric constant characteristics, as a widely-used interphase material for ceramic matrix composites was introduced into the Si3N4f/SiC composites to weaken the interfacial bonding and thus develop the toughness of the composites.29,30 Consequently, first of all this work contributed to explore the in situ micro-mechanical properties of the Si3N4f/SiC composites without and with BN interphase in detail. Moreover, the macro-mechanical properties of the composites were measured.
2 Experimental
2.1 Materials preparation
A KD-SN type Si3N4 fiber preform (provided by our own laboratory) was chosen as reinforcements of the Si3N4f/SiC composites. The correlated microstructure changes have been reported in our previous report. The Si3N4f/SiC composite was fabricated by conventional precursor infiltration and pyrolysis (PIP) process, using polycarbosilane (PCS, from our own laboratory) as matrix precursor. Three Si3N4f/SiC composites were fabricated finally, labeled Si3N4f/SiC-800 °C, Si3N4f/SiC-1000 °C, Si3N4f/SiC-1200 °C, representing Si3N4f/SiC fabricated at 800 °C, 1000 °C and 1200 °C respectively. More than 15 cycles were performed to obtain a relatively dense microstructure of matrix. This was signified by <1% weight increase of the composite during the subsequent PIP cycles. The BN coatings were prepared on the fiber bundles by chemical vapor deposition (CVD) method prior to the matrix fabrication. Borazine was used as precursors for the BN deposition. The deposition was performed at low pressure (1 kPa) and moderate temperature (1100 °C).
2.2 Materials microstructure characterization
The morphology of these composites were observed by scanning electron microscopy (SEM, Hitachi FEG S4800). The phase composition of these composites was observed by by X-ray diffraction (XRD) analysis using a D8 ADVANCE diffractometer (Bruker, Germany). Microstructures of the SiC matrix and the interfacial microstructures of the composites were performed using an FEI Tecnai F20 transmission electron microscope operating at 200 kV. The TEM of the interfacial microstructures specimens were prepared by a milling-and-lifting out process inside a focused ion beam (FIB) system (FEI Helios 600i).
2.3 Mechanical property characterization
Instrumented nanoindentation test was conducted on the individual Si3N4 fiber and SiC matrix on a finely polished cross-section of the Si3N4f/SiC composite, employing a Berkovich diamond indenter (Keysight G200) to measure the Young's modulus and the hardness of each component versus the indenter depth using the continuous stiffness measurement (CSM) method.31 The load rate was 30 mN s−1. Similarly, the in situ fracture toughness of the SiC matrix on the cross-section of the Si3N4f/SiC composite was measured using the same diamond indenter. The only difference was that the load in the fracture toughness test was much higher than in the common nanoindentation test. The in situ fracture toughness of the Si3N4 fiber was measured using micropillar splitting test which has been reported in our previous study.32
The interfacial shear strength of the composites was quantified by instrumented fiber push-in tests inside the Keysight G200 nano-mechanical testing system. A 5 μm flat diamond punch was used to apply the external force, which was strictly parallel to the interface. The displacement rate was 30 nm s−1 and the maximum depth 2 μm. At least 10 fibers were selected to perform the tests, until reproducible results were obtained. The flexural strength of the Si3N4f/SiC and the Si3N4f/BN/SiC composites was obtained by the three-point bend (TPB) techniques inside an Instron 1342 Universal Testing Machine, according to ASTM D790.
3 Results and discussions
3.1 Microstructure analysis of the Si3N4f/SiC composite
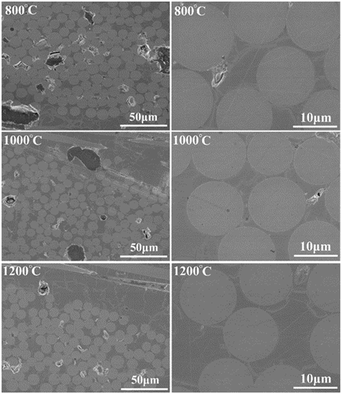
The cross-sectional morphology of the Si3N4f/SiC-800 °C, Si3N4f/SiC-1000 °C, Si3N4f/SiC-1200 °C was shown in Fig. 1. As expected, the fibers with a diameter of ∼12 μm was compactly bridged by dense SiC matrix, with only a few pores observed in the selected region.
 |
| | Fig. 1 Cross-sectional images of Si3N4f/SiC composites fabricated at different temperatures. | |
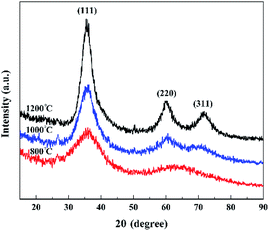
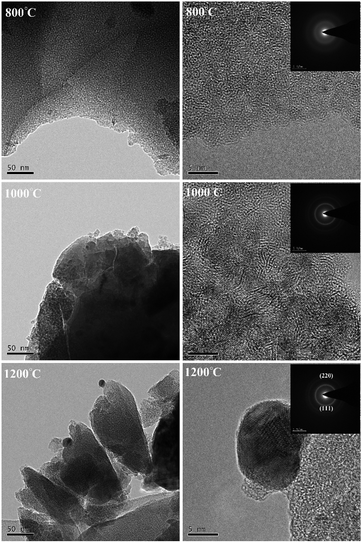
The phase composition of the composites was investigated by XRD analysis, as shown in Fig. 2. It was obviously found that there was mainly composed of SiC phase in the XRD patterns due to the better crystallinity of the SiC matrix than the Si3N4 fiber in the same fabrication temperature. In our previous study, the Si3N4 fiber can still remain amorphous until the temperature was increased up to 1200 °C. With the rise of temperature, the main diffraction peaks at 36° and 60° respectively corresponding to (111) and (220) planes of β-SiC became increasingly apparent, which indicated that for the PCS derived SiC matrix, higher temperature could trigger more β-SiC formations. The pyrolytic process of the PCS could be explained as below: when the fabrication temperature was at 800 °C, the pyrolysis product of PCS remaining amorphous was the homogeneous inorganic substance, including amorphous SiC and Si–O–C structure. With the fabrication temperature up to 1000 °C, the decomposition of Si–O–C structure and the crystallization of the amorphous SiC resulted in the formation of the SiC crystallite. It was proved by the TEM analysis of the SiC matrix as shown in Fig. 3. The high resolution and selected area electronic diffraction (SAED) analysis revealed the amorphous nature of the SiC matrix at 800 °C. When the fabrication temperature was increased up to 1000 °C or above, the SAED ring became more and more distinct and further addressed the stronger diffractions of (111) and (220) crystalline planes of SiC matrix at higher fabrication temperatures.
 |
| | Fig. 2 XRD patterns of Si3N4f/SiC composites fabricated at different temperatures. | |
 |
| | Fig. 3 TEM analysis of SiC matrix fabricated at different temperatures. | |
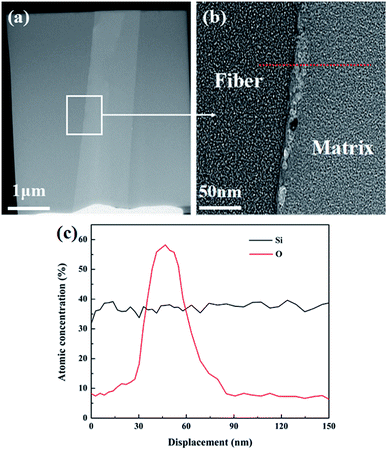
The cross-sectional TEM images of interfacial zones in the Si3N4f/SiC-800 °C composite were shown in Fig. 4. As expected, the Si3N4 fiber was amorphous, even after the harsh PIP process. It was obviously observed an interphase with the thickness of ∼20 nm was formed in the fiber/matrix interface. The EDS analysis in Fig. 4(c) revealed the interphase was mainly composed of Si and O elements, which indicated a formation of SiO2 phase at the fiber/matrix interface. This thin interphase was mainly resulted from the potential interfacial reactions between the two phases at ≥800 °C. In our previous work, the oxygen group of the Si3N4 fiber was mainly distributed on the fiber surface.12 Therefore, this SiO2 interphase was possibly a reaction product of the oxygen group of the Si3N4 fiber with the –Si–O–Si– group of the PCS at the fabrication temperature ≥ 800 °C.33,34 The potential interfacial reactions are as follows:
![[triple bond, length as m-dash]](https://www.rsc.org/images/entities/char_e002.gif) Si–H + O → Si–H + O → ![[triple bond, length as m-dash]](https://www.rsc.org/images/entities/char_e002.gif) Si–OH Si–OH |
2![[triple bond, length as m-dash]](https://www.rsc.org/images/entities/char_e002.gif) Si–OH → Si–O–O–Si Si–OH → Si–O–O–Si![[triple bond, length as m-dash]](https://www.rsc.org/images/entities/char_e002.gif) + H2O + H2O |
 |
| | Fig. 4 (a and b) Interfacial zone analysis of the Si3N4f/SiC-800 °C composite; (c) EDS analysis of the red dashed line in (b). | |
Hence, the fiber/matrix interface in the Si3N4f/SiC composite was reaction-controlled at the fabrication temperature ≥ 800 °C, which would result in strong interfacial reactions.
The strong interfacial reaction in the Si3N4f/SiC composite can be effectively eliminated by depositing BN interphase on the fiber surface via chemical vapor deposition (CVD). The cross-sectional morphology of the Si3N4f/SiC-800 °C composite with BN interphase was shown in Fig. 5. The interphase with ∼400 nm was uniformly deposited around the fibers.
 |
| | Fig. 5 (a) Cross-sectional image of the Si3N4f/SiC-800 °C composite with BN interphase; (b) partial enlarged drawing of the cross-sectional image. | |
The cross-sectional TEM images of interfacial zones in Si3N4f/SiC-800 °C composite with BN interphase were shown in Fig. 6. The high resolution TEM (HR-TEM) and selected area electronic diffraction (SAED) of the BN interphase in Fig. 6(d) indicated the interphase was in graphite-like structure with a short range of crystallinity being on atomic scale, implying the favorable cracks deflection when matrix cracks spread to the interphase. It was obviously found the fiber/interphase/matrix interfaces were chemical sharp, indicating the potential interfacial reactions that occurred in the Si3N4f/SiC composite can be effectively prevented by introducing BN interphase.
 |
| | Fig. 6 Interfacial zone image of the Si3N4f/SiC-800 °C composite with BN interphase: (a) partial enlarged drawing of the interfacial zone image; (b) HR-TEM and SAED of the SiC matrix; (c) HR-TEM of the matrix/interphase interface; (d) HR-TEM and SAED of the BN interphase; (e) HR-TEM of the interphase/fiber interface; (f) HR-TEM and SAED of the Si3N4 fiber. | |
3.2 Young's modulus and hardness of the fiber and matrix
The Young's modulus and hardness of the fiber and matrix were measured by nano-indentation instrument based on Oliver & Pharr method. The fabrication-temperature dependent Young's modulus and hardness of the fiber and matrix in the Si3N4f/SiC composites versus indentation depth were showed in Fig. 7. The data fluctuation in the initial displacement of ∼50 nm was resulted from the contact between the sample and the indenter. Up to a depth of 50–300 nm, the Young's modulus and hardness of both constituents showed independent on the indentation depth. The measured Young's modulus and hardness were listed in Table 1. The Young's modulus and the hardness of the fiber at 800–1200 °C were leveled ∼165 GPa and ∼16 GPa, respectively, which were independent of the fabrication temperature. It was mainly a consequence of the structure stability of the Si3N4 fiber at this temperature interval. In comparison, the increasing fabrication temperature from 800 °C to 1200 °C resulted in the significant enhancements of the Young's modulus from ∼143 GPa to ∼213 GPa and the hardness from ∼14 GPa to ∼21 GPa for the SiC matrix, indicating the strong effect of the composite fabrication temperature on the mechanical property of the SiC matrix. This was expected since the matrix was expected to have a higher ratio of the β-SiC than the α-SiC at higher fabrication temperatures. Since the Young's modulus of β-SiC is much higher than that of the α-SiC, the stiffer and stronger SiC matrix obtained at higher temperatures should be mainly attributed to the higher content β-SiC formations.35,36
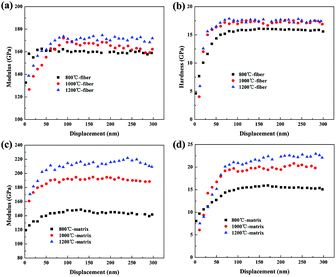 |
| | Fig. 7 (a and b) Young's modulus and hardness of the fiber at different temperatures; (c and d) Young's modulus and hardness of the matrix at different temperatures. | |
Table 1 Young's modulus and hardness of the fiber and matrix
| T (°C) |
Young's modulus (GPa) |
Hardness (GPa) |
| Fiber |
Matrix |
Fiber |
Matrix |
| 800 |
162.1 ± 8.6 |
143.7 ± 7.9 |
15.3 ± 2.2 |
14.1 ± 1.6 |
| 1000 |
165.2 ± 8.2 |
191.2 ± 8.6 |
16.7 ± 1.3 |
19.6 ± 2.9 |
| 1200 |
171.5 ± 9.7 |
213.9 ± 8.9 |
17.3 ± 1.5 |
21.7 ± 1.1 |
3.3 Fracture toughness of the fiber and matrix
The fracture toughness of the SiC matrix was measured by nano-indentation with a cube-corned diamond indenter to generate indents inside the SiC matrix fabricated at different temperatures. The specific experimental process was similar with the above conventional nano-indentation tests. This indentation test needed higher load to generate cracks from the center of the indents. The fracture toughness of the matrix was estimated from the nano-indentation method and typical LEM (Lawn–Evans–Marshall) eqn (1).37| |
 | (1) |
where E was the elastic modulus, H was the hardness, Pmax was the maximum load applied to the matrix, c was the length of the crack path from the center of the indents and α was an empirically determined calibration constant, taken as 0.016.
This test set ∼600 mN as the maximum load on the matrix in order to generate distinct cracks. The corresponding load–displacement curves and indentation morphology of the SiC matrix after indentation tests were shown in Fig. 8. It was clearly observed that the cracks were formed from the center of the indents. With the temperature increased from 800 °C to 1200 °C, the crack length turned into short. The estimated fracture toughness values are summarised in Table 2, which increased from ∼1.03 MPa m1/2 at 800 °C to ∼1.38 MPa m1/2 at 1200 °C, which should be mainly a consequence of the higher crystalline degree of the SiC with more contents of β-SiC at higher fabrication temperatures.
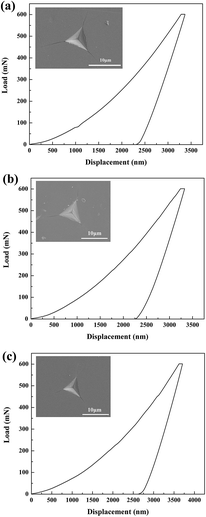 |
| | Fig. 8 Representative load–displacement loading and unloading curves for the SiC matrix inside the composites under a maximum indenting load of 600 mN: (a) 800 °C; (b) 1000 °C; (c) 1200 °C. | |
Table 2 Fracture toughness of the SiC matrix by indentation method
| T (°C) |
Crack length (μm) |
Fracture toughness (MPa m1/2) |
| 800 |
11.68 |
1.03 ± 0.04 |
| 1000 |
8.58 |
1.21 ± 0.06 |
| 1200 |
7.81 |
1.38 ± 0.07 |
The fracture toughness of the Si3N4 fiber was measured by the micropillar splitting method due to the fibers with dimensions generally ≤12 μm. The detailed testing principles has been reported in our previous study. The acquired experimental load–displacement curves of the fibers were shown in Fig. 9(a). It was obviously observed that the curves displayed typical traces of elastic deformation until brittle failure of the micropillar when the critical load Pc was reached. A typically as-fabricated micropillar out of the Si3N4 fiber in the cross-section of the composite before and after tests was shown in Fig. 9(b and c). The diameter and height of the micropillars were both 3 μm. The fracture toughness of the fibers at different fabrication temperatures was estimated from eqn (2) by ref 26 and 27:
| |
 | (2) |
Here,
R is the micropillar radius;
γ depends on the micropillar size, the material properties and the tip geometry, and has been determined as 0.35 based on our previous work. The fracture toughness of the fibers from 800 °C to 1200 °C was close to 2.0 MPa m
1/2 as listed in
Table 3. This is expected due to the high fabrication temperature of these Si
3N
4 fibers (>1300 °C) that the microstructure is almost independent of the composite fabrication temperatures in the temperature range of 800–1200 °C.
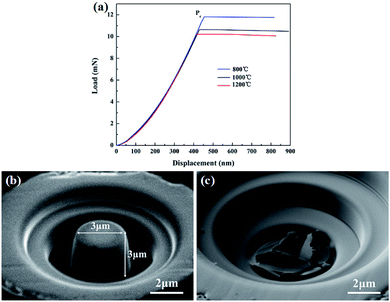 |
| | Fig. 9 (a) Representative load–displacement curves for Si3N4 fiber micropillars inside the composites; (b) the micropillar morphology before indenting; (c) the micropillar morphology after indenting. | |
Table 3 Fracture toughness of the Si3N4 fiber by micropillar splitting method
| T (°C) |
R (μm) |
Pc (mN) |
γ |
Fracture toughness (MPa m1/2) |
| 800 |
1.5 |
11.83 |
0.35 |
2.08 ± 0.06 |
| 1000 |
10.46 |
2.01 ± 0.07 |
| 1200 |
10.28 |
1.99 ± 0.05 |
3.4 Interfacial shear strength of the fiber/matrix interface
The shear property of the fiber/matrix interface in the Si3N4f/SiC composites with and without BN interphase was quantified by fiber push-in test. The typical push-in test involves pushing the vertical aligned Si3N4 fibers with a flat diamond punch until the interface failure, as shown in Fig. 10(b and c). Based on the obtained push-in load–displacement curves in Fig. 10(a), the interfacial shear strength, τ, can be calculated by eqn (3):| |
 | (3) |
Here, S0 is the stiffness of the initial linear regime and PC the critical load leading to the interfacial cracking. Ef is the Young's modulus of Si3N4 fiber based on Section 3.2. R is the radius of the fiber, 6.5 μm. Inputting the corresponding values yielded the interfacial shear strength as listed in Fig. 11. The interfacial shear strength of the Si3N4f/SiC-800 °C with interphase (∼140 MPa) was significantly lower than the Si3N4f/SiC composites (∼420 MPa), which indicated the BN interphase could tailor the interface bondings.
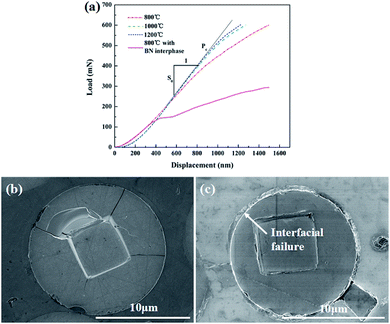 |
| | Fig. 10 (a) Fiber push-in tests for the Si3N4f/SiC composites with and without BN interphase; fiber morphology after push-in tests: (b) without interphase; (c) with interphase. | |
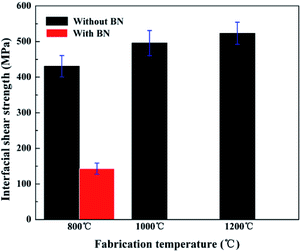 |
| | Fig. 11 Interfacial shear strength of the Si3N4f/SiC composites with and without BN interphase. | |
3.5 Macro-mechanical property of the Si3N4f/SiC composites
The macro-mechanical properties of the Si3N4f/SiC composite with and without BN interphase that are mainly dominated by the measured micro-mechanical properties of the Si3N4 fiber, the SiC matrix and the fiber/matrix interface were quantified here by the macro three-point bend tests. The typical stress–displacement curves of the composites were showed in Fig. 12. The curve of the Si3N4f/SiC composites without BN interphase displayed brittle fracture response after the linear elastic part due to a consequence of the strong fiber/matrix interface that would impede the toughening mechanisms like crack deflection, fiber pull-out, etc. And the curve of the Si3N4f/SiC-800 °C composite with BN interphase displayed significantly toughness fracture response. Meanwhile, the flexural strength was increased from ∼140 MPa to ∼250 MPa. The flat fracture surface as shown in Fig. 13(a and b) evidenced the brittle nature of the Si3N4f/SiC composites without introducing interphase. Fig. 13(c and d) showed introducing BN interphase could lead to toughness responses, like interface debonding and fiber pull-out, etc.
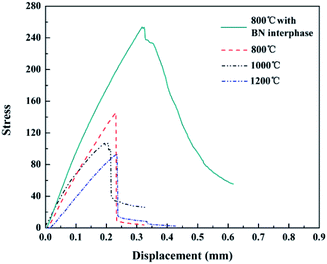 |
| | Fig. 12 Representative stress–displacement curves of the Si3N4f/SiC composites with and without BN interphase. | |
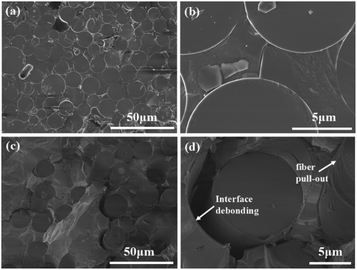 |
| | Fig. 13 Fracture surface of (a and b) the Si3N4f/SiC-800 °C composite and (c and d) Si3N4f/BN/SiC-800 °C composite after three-point bend tests. | |
The difference in the macro-mechanical properties of the Si3N4f/SiC composite and Si3N4f/BN/SiC composite can be attributed to the interfacial property or the mechanical mismatch of the fiber, interface and matrix, which has been well explained by the well-known He–Hutchinson model.38 This model describes the crack penetration/deflection behaviors at the interface of composites. Based on the model, the matrix crack deflection can occur at the fiber/matrix interface when the composites satisfy the following conditions, and a crack penetration behavior the other way around:
| |
 | (4) |
where
Γ is the toughness and the subscripts f refers to the fiber and m the matrix in the Si
3N
4f/SiC composite or the BN interphase in the Si
3N
4f/BN/SiC composite.
G is the energy release rate. The subscripts d and p refer to the matrix crack deflection and penetration, respectively. The ratio of
Gd and
Gp can be expressed as the following equations:
| |
 | (5) |
| |
 | (6) |
| |
 | (7) |
here
α is elastic mismatch coefficient,

is the plane-strain elastic modulus,
Ex and
νx correspond to the Young's modulus and the Poisson's ratio of the phase x, respectively.
Note that Γ can be calculated by eqn (8):
| |
 | (8) |
here
KICx correspond to the fracture toughness of the phase x. Note that the SiC fiber toughness (
Γf) can be quantified using the measured data in this work. The interface toughness (
Γi) in both the Si
3N
4f/SiC composite and Si
3N
4f/BN/SiC composite, though still missing, was approximated as the SiC matrix toughness (
Γm) in the Si
3N
4f/SiC composite and the BN interphase toughness (
ΓBN).
Γm was acquired also based on the experimental measurements in this work. The
ΓBN was chosen 4 J m
−1,
2 and the Young's modulus 70 GPa, based on the literatures.
39
Fig. 14 shows the He–Hutchinson plot of the different temperature processed Si3N4f/SiC composites with and without BN interphase studied in this work. The result suggests although the analysis can only be considered as indicative, the He–Hutchinson prediction showed a crack deflection behavior of the Si3N4f/SiC composite with BN interphase, and a crack penetration behavior of that without BN interphase in the processing temperature range considered, in accordance to the experimental observations above.
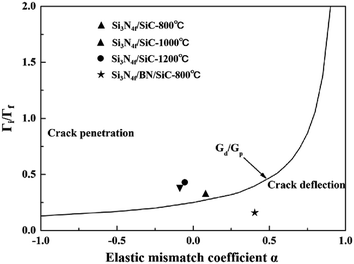 |
| | Fig. 14 Crack deflection mode of the Si3N4f/SiC composites with and without BN interphase based on H–H model. | |
4 Conclusions
In this work, the in situ micro-mechanical properties of the novel Si3N4f/SiC composite fabricated though PIP process have been firstly investigated. Meanwhile, the BN interphase was introduced to tailor the fiber/matrix interface in the composites. The conclusions can be summarized as follows:
(1) In the fabrication temperature considered, due to the stable microstructure, the Si3N4 fiber showed a stable Young’ modulus (∼165 GPa), hardness (∼16 GPa) and fracture toughness (∼2 MPa m1/2), indicating an excellent thermal–mechanical property of the Si3N4 fiber that was barely degraded after high temperature composite fabrication process;
(2) A more crystallized SiC matrix that is mainly attributed to the higher contents of β-SiC formations with the temperatures increased from 800 °C to 1200 °C, which subsequently resulted in enhancements in the Young's modulus, hardness and fracture toughness;
(3) The interfacial microstructure analysis of the Si3N4f/SiC composites showed the interface was reaction-controlled and the fiber bonded with the matrix tightly, as evidenced by the high interfacial shear strength (>420 MPa). After introducing the BN interphase, the interfacial shear strength can be significantly decreased to ∼140 MPa because of preventing the interfacial reactions.
(4) The strong interfacial reactions of the Si3N4f/SiC composites led to the elastic-brittle responses. However, the composites with BN interphase showed a significantly enhanced fracture resistance, due to the triggering of the toughening mechanisms like interfacial debonding, fiber pullout, etc.
To sum up, the methods utilized in the paper likewise can be extended to the other continuous ceramic fibers reinforced ceramic matrix composites.
Conflicts of interest
There are no conflicts to declare.
Acknowledgements
The authors appreciate the Aid Program for Innovative Group of National University of Defense Technology, and the Aid program for Science and Technology Innovative Research Team in Higher Educational Institutions of Hunan Province.
Notes and references
- S. Y. Cao, J. Wang and H. Wang, Mater. Sci. Eng. A, 2016, 673, 55–62 CrossRef CAS.
- H. T. Liu and H. Tian, J. Eur. Ceram. Soc., 2012, 32, 2505–2512 CrossRef CAS.
- S. Y. Cao, J. Wang and H. Wang, J. Mater. Sci., 2016, 51, 1–10 CrossRef.
- Z. M. Li, W. C. Zhou and X. L. Su, J. Alloys Compd., 2011, 509, 973–976 CrossRef CAS.
- T. H. Xu, Q. S. Ma and Z. H. Chen, Mater. Lett., 2011, 65, 1538–1541 CrossRef CAS.
- R. Mo, X. W. Yin and F. Ye, J. Eur. Ceram. Soc., 2019, 39, 743–754 CrossRef CAS.
- H. Luo, W. B. Chen and W. Zhou, Ceram. Int., 2017, 43, 12328–12332 CrossRef CAS.
- H. B. Jin, M. S. Cao and W. Zhou, Mater. Res. Bull., 2010, 45, 247–250 CrossRef CAS.
- C. R. Zou, C. R. Zhang and Y. Xiao, J. Non-Cryst. Solids, 2012, 358, 3338–3341 CrossRef CAS.
- Q. Ding, D. W. Ni and Z. Wang, J. Adv. Ceram., 2018, 7, 266–275 CrossRef CAS.
- X. L. Fan, W. Liu and X. G. Lu, J. Mater. Sci. Lett., 2005, 40, 6033–6036 CrossRef CAS.
- Y. Li and J. C. Gao, Mater. Lett., 2013, 110, 102–104 CrossRef CAS.
- X. Hu, C. W. Shao and J. Wang, J. Mater. Sci., 2016, 52, 7555–7566 CrossRef.
- X. Sun, H. T. Liu and H. F. Cheng, RSC Adv., 2017, 7, 47833–47839 RSC.
- K. Yoshida, J. Ceram. Soc. Jpn., 2010, 118, 82–90 CrossRef CAS.
- R. Naslain, A. Guette and F. Rebillat, J. Mater. Sci., 2004, 39, 7303–7316 CrossRef CAS.
- D. Frazer, M. D. Abad and D. Krumwiede, Composites, Part A, 2015, 70, 93–101 CrossRef CAS.
- D. Blaese, D. E. Garcia and P. Guglielmi, J. Eur. Ceram. Soc., 2015, 35, 1593–1598 CrossRef CAS.
- W. Yan, C. L. Pun and Z. Wu, Composites, Part B, 2011, 42, 2093–2097 CrossRef.
- T. P. Wang, C. F. Liu and L. Christian, Mater. Sci. Eng. A, 2016, 650, 469–477 CrossRef CAS.
- Y. M. He, Y. Sun and J. Zhang, J. Eur. Ceram. Soc., 2012, 32, 3379–3388 CrossRef CAS.
- A. Udayakumar, G. A. Sri and S. Raja, J. Eur. Ceram. Soc., 2011, 31, 1145–1153 CrossRef CAS.
- L. Zhang, C. Ren and C. Zhou, Appl. Surf. Sci., 2015, 357, 1427–1433 CrossRef CAS.
- T. Hinoki, J. Nucl. Mater., 1998, 2, 1567–1571 CrossRef.
- M. Kharrat, A. Chateauminois and L. Carpentier, Composites, Part A, 1997, 28, 39–46 CrossRef.
- M. Sebastiani, K. E. Johanns and E. G. Herbert, Philos. Mag., 2015, 95, 1928–1944 CrossRef CAS.
- M. Sebastiani, K. E. Johanns and E. G. Herbert, Curr. Opin. Solid State Mater. Sci., 2015, 19, 324–333 CrossRef CAS.
- S. Han, L. W. Yang and H. T. Liu, Mater. Des., 2017, 131, 265–272 CrossRef CAS.
- X. K. Ma, X. W. Yin and X. Y. Cao, Ceram. Int., 2016, 42, 3652–3658 CrossRef CAS.
- R. R. Naslain, Composites, Part A, 1998, 29, 1145–1155 CrossRef.
- X. D. Li and B. S. Bharat, Mater. Charact., 2002, 48, 11–36 CrossRef CAS.
- X. Sun, H. T. Liu and H. F. Cheng, Ceram. Int., 2018, 136, 231–235 Search PubMed.
- P. Colombo, G. Mera and R. Riedel, J. Am. Ceram. Soc., 2010, 93, 1805–1837 CAS.
- H. Liu, H. F. Cheng and J. Wang, Mater. Sci. Eng. A, 2009, 525, 121–127 CrossRef.
- J. Lipowitz, J. A. Rabe and K. T. Nguyen, Proc. 19th Annu. Conf. Compos. Adv. Ceram. Mater. Struct. Ceram. Eng. Sci. Proc., John Wiley & Sons, Inc., 1995 Search PubMed.
- M. A. Khakani, M. Chaker and A. Jean, J. Mater. Res., 1994, 9, 96–103 CrossRef.
- B. R. Lawn, A. G. Evans and D. B. Marshall, J. Am. Ceram. Soc., 1980, 20, 574–581 CrossRef.
- M. Y. He, A. G. Evans and J. W. Hutchinson, Int. J. Solids Struct., 1994, 31, 3443–3455 CrossRef.
- D. Cornu and S. Bernard, J. Eur. Ceram. Soc., 2005, 25, 111–121 CrossRef CAS.
|
| This journal is © The Royal Society of Chemistry 2019 |
Click here to see how this site uses Cookies. View our privacy policy here.  Open Access Article
 * and
Haifeng Cheng
![[triple bond, length as m-dash]](https://www.rsc.org/images/entities/char_e002.gif) Si–H + O →
Si–H + O → ![[triple bond, length as m-dash]](https://www.rsc.org/images/entities/char_e002.gif) Si–OH
Si–OH![[triple bond, length as m-dash]](https://www.rsc.org/images/entities/char_e002.gif) Si–OH → Si–O–O–Si
Si–OH → Si–O–O–Si![[triple bond, length as m-dash]](https://www.rsc.org/images/entities/char_e002.gif) + H2O
+ H2O


 is the plane-strain elastic modulus, Ex and νx correspond to the Young's modulus and the Poisson's ratio of the phase x, respectively.


