 Open Access Article
Quantitative study of the pyrolysis of levoglucosan to generate small molecular gases†
Shuai Guo ,
Honglin Liang
 ,
Deyong Che,
Hongpeng Liu and
Baizhong Sun*
School of Energy and Power Engineering, Northeast Electric Power University, Jilin 132000, China. E-mail: sunbaizhong@126.com
First published on 14th June 2019
Abstract
Biomass pyrolysis can be used to obtain clean fuels, such as liquids or gases, and is a promising approach to biomass energy utilization. Levoglucosan (LG) is an important product of biomass pyrolysis. The study of its thermal decomposition process is helpful for understanding the mechanisms underlying biomass pyrolysis. We investigated the decomposition of LG using a density functional theory method based on quantum mechanics. In this paper, we studied 23 possible reaction paths for LG pyrolysis to generate small molecular gases and 51 compounds (including reactants, intermediates, and products), and quantified the 47 transition states involved in the pathway. The optimal reaction path of CO2 is ring opening → decarboxylation, with an energy span of 301 kJ mol−1. The optimal reaction pathway for CO is dehydration → alcohol–ketone tautomerization → ring opening → decarbonylation, with an energy span of 286 kJ mol−1. Therefore, it is theoretically simpler to produce CO from LG than to generate CO2. Moreover, by analysing the dehydration reaction in the pathway, we observed that dehydration is beneficial to the production of CO by LG, but is not conducive to the formation of CO2.
1. Introduction
Biomass pyrolysis is a form of thermochemical conversion and a necessary process for biomass combustion and gasification. Therefore, there has been much research on biomass pyrolysis. As cellulose accounts for the largest proportion of biomass, there are many studies on the pyrolysis mechanism of cellulose. In the past, cellulose pyrolysis has mainly been studied experimentally.1–3 After the development of quantitative theory, many researchers began to study the pyrolysis reaction mechanism of cellulose by means of theoretical calculation software. Zheng et al.4 used the Forcite module in Materials Studio software and selected a compound consisting of multiple 1,4-β-D-glucose monomers (containing six side chains, for a total of 360 monomers) as cellulose moulding. The pyrolysis process in the temperature range from 500 to 1400 K was simulated by reaction molecular dynamics (Reax FF MD). The evolution of thermal cracking products with time and temperature was analysed, and the potential use of theoretical calculations in experimental and industrial applications was explored. Moreover, as the number of constituent atoms increased, the simulation results were closer to the experimental results of cellulose pyrolysis. Zhang et al.5 calculated the ring-opening process of pyran rings in the middle of cellotriose using the DMol3 module in Materials Studio software. The effect of pyran ring structures on both sides on the splitting of the middle pyran ring was analysed. The easiest ring-breaking method to calculate theoretically is the retro-aldol mechanism, followed by the retro-Diels–Alder mechanism. The product calculated by this method is consistent with the experimental results of Paine et al.,6 which demonstrates the reliability of the theoretical calculation path results. Zhang et al.7 selected the basis set M062X/6-31G+(d, p) to study the thermal cracking process of cellobiose using Gaussian 09 software. Based on previous experiments and experiences, they proposed 10 cellobiose reaction pathways, all of which can directly and indirectly reduce the degree of polymerization in cellulose. Furthermore, the parallel competitive reactions in the pyrolysis process were analysed based on thermodynamics and kinetics, and the experimental phenomena of the formation of glycolaldehyde (HAA) and LG were explained theoretically. Wang et al.8 studied the path of sulphated polysaccharide pyrolysis to produce LG, furfural, 5-methyl furfural, etc., by employing the B3LYP density functional theory method with the 6-31G+ (d, p) basis set. The results of the theoretical calculations were consistent with the experimental results (three types of products: pyran, furan, and linear small molecular compounds), and the competitive path for generating these three products was analysed theoretically. To study the formation mechanisms of cellulose pyrolysis to form CO2 and CO, Liu et al.9 used 2,3,4-hydroxyl-butyraldehyde and 2,3,4-hydroxyl-butyric acid as model compounds to study the decarboxylation reaction and decarbonylation reaction using the Gaussian 03 software application. They concluded that dehydration is not conducive to the release of CO, but favours the release of CO2, and the decarbonylation reaction absorbs heat, whereas the decarboxylation reaction is an exothermic reaction. Meng et al.10 found that weak acid (such as formic acid and acetic acid) can increase the yield of LG produced by pyrolysis of cellulose, whereas sulphate can increase the yield of levoglucosenone.LG is one of the main products of the low temperature pyrolysis of cellulose, and has high thermal stability. Studies11 on cellulose pyrolysis have shown that the production of LG is mainly concentrated in the medium-temperature radiation source region of 550–650 °C. The yield has an optimum value as a function of temperature, and a maximum yield of 54.4%, which is obtained at approximately 640 °C. Lindstrom et al.12 used Controlled Pyrolysis Duration (CPD)-Quench to study the volatile and condensed phase products of cellulose pyrolysis over prescribed reaction durations. They found that cellulose produced 54.4 wt% LG for a pyrolysis duration of 300 s. The pyrolysis temperature was 500 °C. Lu13 and Kawamoto et al.14 found that LG has high thermal stability, and only a small amount of LG undergoes secondary pyrolysis, even when the temperature is raised to 600 °C. However, as the temperature increases, the proportion of biomass gas increases significantly, and the proportion of LG is greatly reduced. Li et al.15 studied the mechanism of cellulose pyrolysis in a fixed bed and found that when the pyrolysis temperature was 500 °C, the tar contained a large amount of LG (accounting for 24.55 wt%). The concentration of LG was significantly reduced at 700 °C (12.48 wt%) and 900 °C (not detected). The significant decrease in the LG content indicates that it underwent a secondary reaction.
Shafizadeh et al.16 pyrolyzed LG at a temperature of 600 °C and found that the pyrolysis products were very similar to the pyrolysis products of cellulose, and they all contained a large number of small molecular compounds, such as alcohols, aldehydes, and ketones, and gases such as CO and CO2. The absorption spectra of the pyrolysis products of cellulose and LG at 800 °C were compared using Fourier infrared spectroscopy, and the results were found to be very similar.17 Therefore, studying the pyrolysis mechanism of LG from a theoretical perspective plays an important role in understanding the pyrolysis of cellulose. Zhang et al.18 used Gaussian 09 to study the pathways of the conversion of cellulose chains into LG. They proposed that cellulose chains can form active dehydrated glucose through a homogenization reaction, and then convert the anhydroglucose into LG and formaldehyde after the hydrogen-donor reaction. Zhang et al.19 used a density functional theory (DFT) method to study the pyrolysis reaction pathways and products of LG. The decomposition pathways included direct C–C bond cleavage, direct C–O bond cleavage, and dehydration. Their research indicated that C–O bond breaking is easier than C–C bond breaking due to the lower activation energy and higher energy release. Rocha et al.20 used atomic quantum theory (Gaussian 03 with MP2 single point energies for basis set extrapolation) to verify the existence of intramolecular hydrogen bonds in the most stable conformation of LG.
In general, there have been many experimental studies on the LG pyrolysis process, but there are few theoretical analyses. DFT calculations based on quantum mechanics can provide detailed mechanisms for LG pyrolysis reactions at an atomic/molecular level, and have been used by some researchers to study the biomass pyrolysis mechanism.21–23 As one of the main pyrolysis products of cellulose, we studied the detailed thermal decomposition mechanism of LG using the DFT method in this paper. Several pathways for producing CO, CO2, and acetaldehyde were predicted and verified. All of the reactants, intermediates, transition states, and products included in these pathways were calculated. Furthermore, all of the elementary reactions for each pathway were calculated, and the activation energy and energy span were also obtained to reveal the ease of reaction for each pathway. These theoretically detailed mechanisms for LG decomposition can provide useful information to support the utilization of cellulose.
2. Computational details
The DFT calculation in this study was based on the DMol3 module in Materials Studio 2017R2 software developed by Accelrys. All electrons were included in the calculation system without any processing of the kernel electrons. A double numerical plus a d-orbital polarization function (DND)24 was selected as the computational basis set. For the DFT calculation method, we selected generalized gradient approximation (GGA).25 The geometric optimization and energies of all structures were calculated using the revised Perdew–Burke–Ernzerhof (RPBE)26,27 function of GGA. The thresholds for the convergence criteria of energy, force, and displacement were 1 × 10⁻⁵ Ha, 0.002 Ha Å−1, and 0.005 Å, respectively. The total self-consistent field (SCF) error criteria, integration accuracy criteria, and orbital cut-off quality standards were all set to medium accuracy. Multipolar expansion was set at hexadecapole. A Fermi smearing of 0.005 Ha was selected to improve the calculation performance.The geometry of all stationary point structures was fully optimized under the above criteria, and the optimized structure was calculated as a reactant or product. The geometric optimization was an iterative process that adjusts the coordinates of an atom to bring the energy of the structure to a stable point. The transition state was a stagnation point that had the largest energy in the direction of the reaction coordinate, but the lowest energy in the other reaction directions. This maximum energy was called the activation energy, and the structure corresponding to this energy was called the transition state. The linear synchronous transit (LST) and quadratic synchronous transit (QST)28 methods were used to find the transition state, and further confirmed by the Nudged-Elastic-Band (NEB)29 algorithm.
3. Results and discussion
3.1. LG structure
LG is a crystal structure containing relatively strong –OH⋯O hydrogen bonds and relatively weak –CH⋯O hydrogen bonds.30,31 These intramolecular and intermolecular hydrogen bond interactions are complex. Moreover, the vibration amplitude and frequency of –H and –OH vary with temperature; thus, different researchers have obtained slightly different results when studying the structure of LG. Park32 first determined the structure of LG using X-ray experiments in 1971. The experiments were carried out at room temperature, the non-hydrogen atom determination was refined, and the hydrogen atom was estimated by differential Fourier synthesis. Smrcok30 used the refinement of time-of-flight neutron single-crystal diffraction data to accurately determine the geometric data of hydrogen bonds in LG (results shown in Tables 1 and S1†). Both Huang et al.33 and Wu et al.34 used the B3LYP/6-31G method of the Gaussian 03 program to optimize LG. Due to the different choices of basis set functions, the optimization results differed slightly. As shown in Table 1, the theoretical calculation results were slightly larger than the experimental results. In this paper, the calculated results using the DMol3 module (key length information is shown in Table 1, geometric configuration and atomic number are shown in Fig. S1†) were compared with the experimental results reported by Smrčok, and the relative error was within 2%. The small differences between theoretical and experimental results may be due to differences in the size of the system. As LG is a crystal structure, the experimental measurement is directed to a unit cell structure of a large system containing a plurality of LG molecules, each of which is affected by an adjacent structure. In the theoretical calculation, a small system of single molecules is selected, and the geometric optimization of a single molecule does not take into account the influence of intermolecular hydrogen bonds. In addition, our previous papers35 have demonstrated the correctness of the bond cleavage energy calculated by this parameter.| Bond | Calculation | X-ray32 | Neutron30 | Ref. 33 | Ref. 34 |
|---|---|---|---|---|---|
| C6–O1 | 1.461 | 1.443 | 1.447 | 1.442 | 1.487 |
| C10–O1 | 1.429 | 1.399 | 1.415 | 1.414 | 1.439 |
| C10–O2 | 1.434 | 1.427 | 1.428 | 1.444 | 1.454 |
| O2–C11 | 1.456 | 1.444 | 1.455 | 1.447 | 1.490 |
| C11–C6 | 1.547 | 1.527 | 1.532 | — | 1.539 |
| C6–C7 | 1.546 | 1.516 | 1.532 | 1.537 | 1.535 |
| C7–C8 | 1.560 | 1.540 | 1.549 | — | 1.548 |
| C8–C9 | 1.562 | 1.537 | 1.547 | — | 1.562 |
| C9–C10 | 1.556 | 1.518 | 1.527 | 1.541 | 1.531 |
3.2. Design of the possible reaction paths
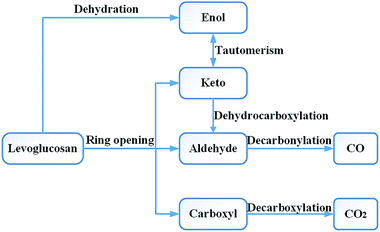
Research on the pyrolysis mechanism of cellulose by Leng et al.36 showed that the cellulose reactions during the high-temperature pyrolysis stage mainly include two types of important reactions: the depolymerization reaction producing anhydrosugar and the pyran ring cleavage reaction of small molecular products. Liao37 carried out a pyrolysis experiment with LG at 610 °C. The main products obtained included acetaldehyde, glycolaldehyde, 1-hydroxy-2-propanone, acetone, 3-hydroxy-2-butanone, 2,3-butanedione, furan, furfural, furfuryl alcohol, etc. Li et al.17 used Fourier transform infrared spectroscopy to study the absorption spectra of cellulose and LG pyrolysis products at 800 °C and obtained very similar results. Therefore, in the design of the reaction pathway, the rationality of the reaction intermediates and products was also considered in combination with the experimental products. Through experimental studies, Shafizadeh16 and Kawamoto38 et al. concluded that LG can also form a chain alcohol–ketone–aldehyde compound by direct ring opening, and then continue to decompose into smaller molecules. Based on Shafizadeh's research conclusions, Huang et al.33 used DFT to design and calculate the path of LG pyrolysis, considering the simultaneous breaking and then ring opening of C10–O1 and C11–O2. Then, four paths were designed for the decomposition of the product after ring opening. Path 1 introduced the CO formation process; in other words, CO was generated through the decarbonization reaction of the aldehyde group compounds. Zhang et al.19 proposed two ring-opening methods for LG. The first was the breaking of bonds between C10–O1, C11–O2 and C9–C10, after which the molecule undergoes dehydration, aldol–ketone tautomerization, and other reactions. The second was that C6–C7 and C8–C9 break first, and then C11–O2 and C6–C9 break to form chain compounds containing hydroxyl groups, carbonyls, double bonds, and ethers. LG contains three hydroxyl groups, which can lead to a dehydration reaction upon pyrolysis. Zhang19 studied six different dehydration modes of LG, but did not further calculate the ring-opening mode of the product after dehydration, and also did not compare the effect of dehydration on ring opening. Based on the products obtained by the LG pyrolysis experiment, Wu et al.34 analysed the enthalpy and free energy changes between LG and the product. The reaction process was studied thermodynamically, but the intermediate process of the reaction was not designed and calculated, and the intermediate product and reaction process remain unknown.The CO generation path used in this paper was based on the above ideas, and the intermediate products and reaction process of CO formation were supplemented and enriched. The CO was derived from the decarbonylation reaction during pyrolysis. The functional groups containing carbonyl groups are the aldehyde (–CHO), ketone (R–CO–R′), and carboxyl (–CO–OH) groups. As the bond cleavage energy is C–C > C–O > C–H, the aldehyde group is most likely to generate CO in pyrolysis. Thus, the problem of CO formation could be translated into a study of the formation of aldehyde-based species, which in turn translates into a study of the source of aldehyde groups. Whereas the aldehyde group may be derived from the ring opening and the cleavage of the hydrocarbyl group on the ketone, the ketone may be derived from the tautomerization reaction of the enol–ketone, which may derive from the dehydration reaction of the adjacent carbon. The overall design idea is shown in Fig. 1.
At present, in the study of the LG pyrolysis process, researchers have given less attention to the generation of CO2, thus we came up with a supplementary design for the path of CO2 generation. According to the current prevailing opinion,9,24,39 the decarboxylation reaction during pyrolysis produces CO2. Wang et al.40 studied the decarboxylation mechanism of benzoic acid and proposed three possible pathways for decarboxylation: direct decarboxylation, stepwise decarboxylation, and a stepwise radical process. According to the results of Wang's calculations, the energy barrier of the direct decarboxylation (246 kJ mol−1) and stepwise decarboxylation (245 kJ mol−1) were much lower than that of the stepwise radical process (470 kJ mol−1). Because the energy barrier of direct decarboxylation was similar to that of stepwise decarboxylation, we simplified the design of the reaction pathway by using direct decarboxylation to calculate the decarboxylation reaction in this paper. There is no carboxyl group in the structure of LG. Therefore, considering the sources of carboxyl groups, we designed the following CO2 generation method: first, fractures occur at C6–O1 and C11–O2, then a carboxyl group is formed at the C10 position, and finally, the carboxyl group undergoes decarboxylation to form CO2.
The pyrolysis reaction pathway for LG designed in this paper can be summarized in terms of the following three schemes:
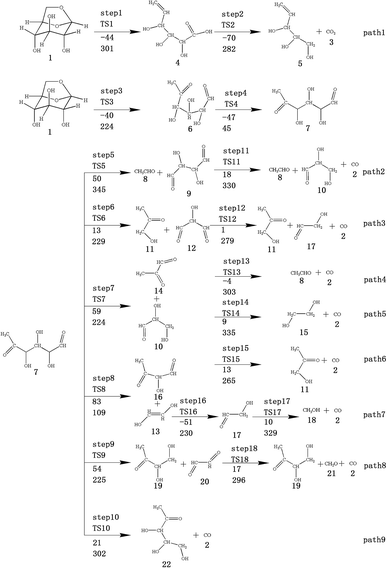
Scheme 1: LG is obtained by ring opening, followed by cracking, including two subclasses: (1) C6–O1 and C11–O2 break simultaneously to form a carboxyl group (see path 1); (2) C10–O1 and C11–O2 break simultaneously (see paths 2–9). The detailed path diagram is shown in Fig. 2.
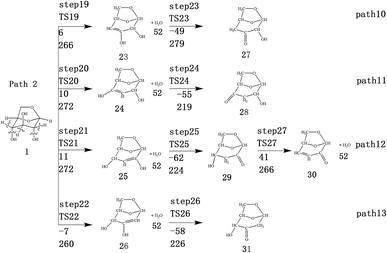
Scheme 2: LG is obtained through a dehydration reaction to generate a double bond, then an enol–ketone tautomerization reaction (see paths 10–13). The detailed path diagram is shown in Fig. 3.
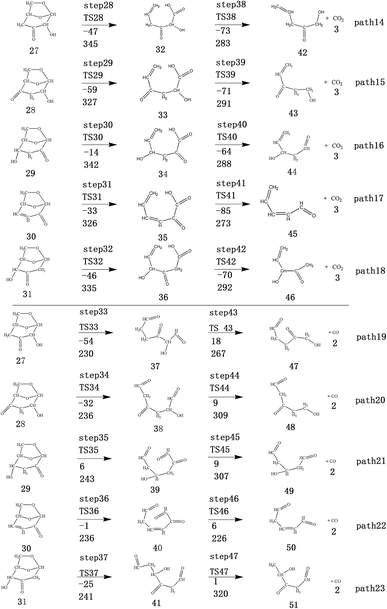
Scheme 3: The dehydration products based on Scheme 2 undergo two types of ring-opening reactions: (1) the C–O bond undergoes a ring-opening reaction to form a carboxyl group, and then a decarboxylation reaction occurs to form CO2 (see paths 14–18); (2) the C–O bond undergoes a ring-opening reaction to form an aldehyde group, and then decarbonylation occurs to form CO (see paths 19–23). The detailed path diagram is shown in Fig. 4.
To understand the reaction mechanism of the decomposition of LG to generate small molecular gases in detail, the following research was carried out. First, we performed geometric optimization and frequency analysis of all reactants, products, and possible intermediates in the reaction process to determine the spatial configuration corresponding to the lowest energy point. The geometric structure diagram of the reactants, products, and intermediates (60 in total) and some bond length information are shown in Fig. S1,† and the total energy is shown in Table 2. The reactants of each elementary reaction were then paired with atoms in the product structure (a channel was created between the reactant and the product, and the LST/QST function was used to calculate the channel and search the transition state). Then, frequency domain analysis of the searched transition state structure was performed to ensure that there was only one unique virtual frequency (if there were multiple virtual frequencies, then transition state optimization was performed). Finally, the NEB method was applied to confirm the transition state, and to ensure that the vibration direction of the transition state was directed to the reactants and products. The virtual frequency values of the 47 transition states are shown in Table 3, and their geometric structure diagrams and some key length data are shown in Fig. S1.†
| Species | Eh/Ha | Species | Eh/Ha | Species | Eh/Ha |
|---|---|---|---|---|---|
| 1 | −610.9237 | 17 + 2 | −342.4766 | 32 | −534.5052 |
| 4 | −610.9403 | 18 + 2 | −229.1130 | 33 | −534.5095 |
| 5 + 3 | −610.9673 | 19 + 20 | −610.9322 | 34 | −534.4979 |
| 6 | −610.9348 | 20 | −227.9119 | 35 | −458.0391 |
| 7 | −610.9527 | 21 + 2 | −227.9053 | 36 | −534.5096 |
| 8 + 2 | −267.2430 | 22 + 2 | −610.9447 | 37 | −534.5076 |
| 8 + 9 | −610.9337 | 23 | −534.4685 | 38 | −534.5012 |
| 9 | −457.0486 | 23 + 52 | −610.9214 | 39 | −534.4906 |
| 10 | −343.6832 | 24 | −534.4679 | 40 | −458.0268 |
| 10 + 2 | −457.0419 | 24 + 52 | −610.9200 | 41 | −534.5016 |
| 11 + 2 | −381.8176 | 25 | −534.4690 | 42 + 3 | −534.5331 |
| 11 + 12 | −610.9477 | 25 + 52 | −610.9194 | 43 + 3 | −534.5368 |
| 12 | −342.4771 | 26 | −534.4701 | 44 + 3 | −534.5320 |
| 13 | −229.0971 | 26 + 52 | −610.9262 | 45 + 3 | −458.0714 |
| 14 | −267.2410 | 27 | −534.4872 | 46 + 3 | −534.5364 |
| 14 + 10 | −610.9300 | 28 | −534.4889 | 47 + 2 | −534.5008 |
| 15 + 2 | −343.6797 | 29 | −534.4928 | 48 + 2 | −534.4977 |
| 16 | −381.8226 | 30 | −458.0264 | 49 + 2 | −534.4873 |
| 16 + 13 | −610.9213 | 30 + 52 | −534.4772 | 50 + 2 | −458.0245 |
| 17 | −229.1167 | 31 | −534.4922 | 51 + 2 | −534.5014 |
| Species | Eh/Ha | Imaginary frequency (cm−1) | Species | Eh/Ha | Imaginary frequency (cm−1) |
|---|---|---|---|---|---|
| TS1 | −610.8092 | −895.68 | TS25 | −534.3838 | −1946.77 |
| TS2 | −610.8330 | −1887.07 | TS26 | −534.3843 | −1967.15 |
| TS3 | −610.8382 | −763.06 | TS27 | −534.4028 | −1706.65 |
| TS4 | −610.9178 | −251.6 | TS28 | −534.3556 | −2003.19 |
| TS5 | −610.8213 | −1813.41 | TS29 | −534.3623 | −1101.51 |
| TS6 | −610.8656 | −66.44 | TS30 | −534.3624 | −1126.28 |
| TS7 | −610.8675 | −67.13 | TS31 | −457.9027 | −1034.96 |
| TS8 | −610.9114 | −138.8 | TS32 | −534.3649 | −1136.41 |
| TS9 | −610.8671 | −212.28 | TS33 | −534.3994 | −798.26 |
| TS10 | −610.8379 | −1433.2 | TS34 | −534.3997 | −912.18 |
| TS11 | −456.9259 | −1469.23 | TS35 | −534.4004 | −865.02 |
| TS12 | −342.3709 | −1064.35 | TS36 | −457.9373 | −985.16 |
| TS13 | −267.1261 | −1528.53 | TS37 | −534.4006 | −828.22 |
| TS14 | −343.5555 | −1522.85 | TS38 | −534.3972 | −1956.01 |
| TS15 | −381.7214 | −615.74 | TS39 | −534.3990 | −1988.85 |
| TS16 | −229.0092 | −2114.53 | TS40 | −534.3981 | −1992.21 |
| TS17 | −228.9914 | −1562.07 | TS41 | −457.9350 | −1969.98 |
| TS18 | −227.7991 | −1341.52 | TS42 | −534.3982 | −1936.02 |
| TS19 | −610.8223 | −1941.52 | TS43 | −534.4059 | −1130.54 |
| TS20 | −610.8201 | −1932.72 | TS44 | −534.3837 | −1304.15 |
| TS21 | −610.8200 | −1993.15 | TS45 | −534.3735 | −1340.77 |
| TS22 | −610.8247 | −1686.2 | TS46 | −457.9416 | −925.24 |
| TS23 | −534.3617 | −1184.02 | TS47 | −534.3798 | −1527.44 |
| TS24 | −534.3844 | −2046.49 |
3.3. Direct ring-opening pyrolysis of LG
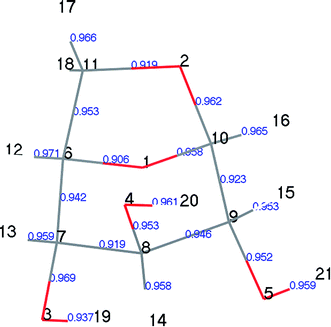
Population number analysis41 was used to calculate the distributions of electron charges between the atoms of each component. The electron charge distributions on atoms, atomic orbitals, and between two atoms can be obtained by population analysis. These are called the atomic, orbital, and bond populations, respectively. We used Mayer population analysis to calculate the key level to determine the strength of the key. A useful property of the Mayer population is described in the help manual for the Materials Studio Software, which is that the Mayer quantity is less dependent on the selection of base groups than the Mulliken key level, thus they can be used to describe similar molecules.In designing the LG pyrolysis pathway, we first calculated the Mayer population of LG, as shown in Fig. 5. We can see from Fig. 5 that the C6–O1 and C11–O2 populations are the smallest in the LG structure (0.906 and 0.919, respectively). The corresponding bond lengths are 1.461 Å and 1.456 Å (see Table 4 for bond length information), and their bond length is the longest of all C–O keys. Therefore, LG cleavage was most likely to open the ring at this point, leading to the formation of Compound 4, containing one carboxyl group. The results of this step were calculated and recorded as step 1. Table 4 lists the partial bond length data of LG (Compound 1), transition state TS1, and Compound 4 in step 1. From the data on TS1, we found that the C6–O1 and C11–O2 bond lengths increased from 1.461 and 1.456 Å to 2.512 and 2.339 Å, respectively, and the C10–H16 bond length also increased, whereas the C6–C11 bond was greatly shortened. The above changes indicate that the reaction process is as follows: two C–O bonds are broken, and H16 is transferred from C10 to O2 to form hydroxyl (–O2H16). During this process, the lone electrons on C11 and C6 were paired, thus forming a C11![[double bond, length as m-dash]](https://www.rsc.org/images/entities/char_e001.gif) C6 double bond. Thereafter, the carboxyl group was decarboxylated to form CO2 and Compound 5.
C6 double bond. Thereafter, the carboxyl group was decarboxylated to form CO2 and Compound 5.
| Bond | Compound 1 | TS1 | Compound 4 |
|---|---|---|---|
| C6–C11 | 1.547 | 1.347 | 1.341 |
| C11–O2 | 1.456 | 2.339 | — |
| O2–C10 | 1.434 | 1.370 | 1.358 |
| C10–O1 | 1.426 | 1.272 | 1.226 |
| C10–H16 | 1.106 | 1.216 | — |
| O1–C6 | 1.461 | 2.512 | — |
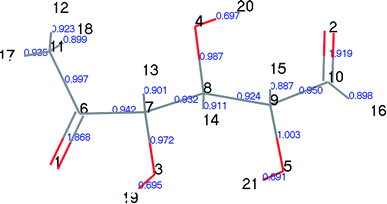
At the same time, we referred to Zhang19 and Huang's42 ideas about C–O bond cleavage in LG, who believed that the LG opening process was a simultaneous cleavage of the C11–O2 bond and the O1–C10 bond, forming a ketone at the C6 position and forming an aldehyde group at the C10 position. Based on this idea, we continued by considering the subsequent cleavage reaction of Compound 7 after breaking the bond. Fig. 6 shows the population calculation of Compound 7. We can see that the population of carbon skeletons from small to large is C8–C9 (0.924), C7–C8 (0.932), C6–C7 (0.942), C9–C10 (0.950), and C6–C11 (0.997). Aside from the excessive population number of C–C bonds, the other four C–C bonds are smaller and more prone to breakage. For the four easily broken parts, six types of breaking steps were designed, steps 5–10. Fig. 7 shows the geometric structures of the compounds and transition states involved in plan 1 and some important bond length information. The reaction described in step 5 is that C6–C7 is broken, then H19 is transferred to C6, and an aldehyde group is formed at C7. The products were acetaldehyde and Compound 9, and the reaction energy barrier was 345 kJ mol−1.
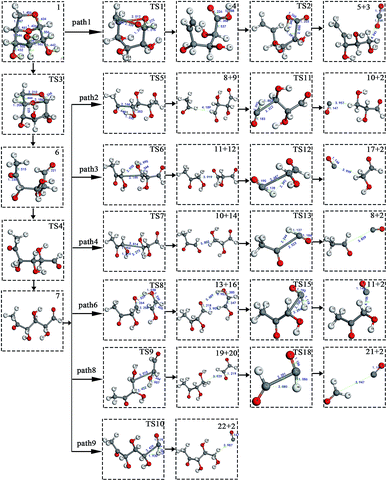 | ||
| Fig. 7 Structure and partial bond length information of compounds and transition states in Scheme 1. | ||
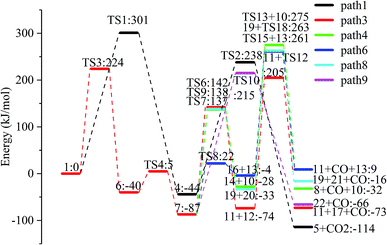
Both steps 6 and 7 were first fractured at C7–C8, but due to the different H transfer mechanisms, two possible cases were designed. The transition from H20 to C7 is recorded as step 6, and the transition from H19 to C8 is recorded as step 7. As the spatial positions of the above two hydroxyl hydrogens are different, the distance between H20 and C7 is 3.246 Å, which is larger than the distance between C19 and C8 (3.00 Å). When the H atom is transferred, it is affected by its dihedral angle, and its angle of rotation around the oxygen atom is also different (H20–O4–C8–C7 has a dihedral angle of 165°, whereas H19–O3–C7–C8 has a dihedral angle of 109°). Thus, from the structure, we can predict that the response of step 6 is more difficult than that of step 7. The energy barriers of these two steps were then calculated. The results are shown in Fig. 2. The step 6 energy barrier is 229 kJ mol−1, and the step 7 energy barrier is 5 kJ mol−1, larger than that of step 6. This result is consistent with the previous predictions based on structural analysis. The population of C8–C9 is the smallest in the carbon chain. When the C–C bond is broken, there are two possible H transfer modes, H20 → O2 of step 8 and H21 → C8 of step 9. Step 8 forms a six-membered ring transition state when H is transferred, and C–C bond rupture occurs (see TS8 in Fig. S1† for the structure). In this ring structure, the atomic distance between H20 and O2 is only 1.940 Å, and the six atoms of the six-membered ring are substantially in the same plane. Therefore, this is more likely to occur in the bond-breaking reaction, and the reaction energy barrier is only 109 kJ mol−1. In step 9, the distance between H21 and C8 is larger, at 2.538 Å. When H21 is transferred to the C8 position, it encounters a larger steric hindrance than the hydrogen transfer process in step 8. Regarding the energy barrier, step 9 is 225 kJ mol−1, which is much larger than the 109 kJ mol−1 of step 8. The last method for breaking bonds is the direct decarbonylation of the aldehyde groups; that is, C9–C10 is broken and H10 is transferred to C9. The energy barrier of this reaction is 302 kJ mol−1. The products of the six bond-breaking reactions above all contain large amounts of aldehyde groups and ketones, and these parts of the functional groups will also undergo subsequent bond-breaking reactions and decarbonylation reactions to form smaller molecules. Therefore, based on the above products, we studied the subsequent bond-breaking reactions and designed eight reaction paths (paths 2–9). Some of the compounds involved in these reactions were identified in the experimental results reported by Vinu43 and Shen,44 as detailed in Table 5.
| Compound number | English name | ChemSpider id | Reference source |
|---|---|---|---|
| 8 | Acetaldehyde | 172 | Vinu |
| 10 | Glyceraldehyde | 731 | Shen |
| 11 | Hydroxyacetone | 21![[thin space (1/6-em)]](https://www.rsc.org/images/entities/char_2009.gif) 106 106![[thin space (1/6-em)]](https://www.rsc.org/images/entities/char_2009.gif) 125 125 |
Vinu |
| 13 | Ethylene-1,2-diol | 2![[thin space (1/6-em)]](https://www.rsc.org/images/entities/char_2009.gif) 300 300![[thin space (1/6-em)]](https://www.rsc.org/images/entities/char_2009.gif) 359 359 |
Vinu; Shen |
| 14 | Pyruvic aldehyde | 857 | Shen |
| 16 | 2-Hydroxy-3-oxobutanal | 60![[thin space (1/6-em)]](https://www.rsc.org/images/entities/char_2009.gif) 634 634![[thin space (1/6-em)]](https://www.rsc.org/images/entities/char_2009.gif) 474 474 |
Vinu; Shen |
| 17 | Glycolaldehyde | 736 | Vinu; Shen |
| 20 | Glyoxal | 7572 | Vinu; Shen |
| 21 | Formaldehyde | 692 | Vinu; Shen |
The reaction energy and energy barriers in these eight reaction paths are shown in Fig. 2. The level of the energy barrier determines the ease of the reaction to a certain extent: the larger the energy barrier for the basic reaction, the more difficult the reaction. By analysing the energy barrier of 14 steps in the eight paths in Fig. 2, we can see that the energy barriers of four steps are particularly high (step 5, 345 kJ mol; step 11, 330 kJ mol; step 14, 335 kJ mol; and step 17, 329 kJ mol−1). Therefore, the path containing these steps was omitted from the analysis of the potential energy profile, and the remaining paths were analysed. The potential energy diagram is shown in Fig. 8.
At present, some of the literature mentions the concept of a rate-determining step (the largest step in the energy barrier in the reaction), which is considered to have the greatest impact on the speed of the reaction process. However, Kozuch et al.45 considered that for multi-step reactions, it is more reasonable to use the rate-determining state to describe the reaction rate and ease of a multi-step reaction. Taking Fig. 9 as an example, the biggest step in the energy barrier is step 2, but the reaction kinetic rate is determined by the state of both TDTS and TDI. The energy difference between these two states is called the energy span (ΔE, energetic span). When studying the reaction path, we will use Kozuch's point of view to analyse the six paths screened in Scheme 1 from the energy span and compare their reaction kinetics. Path 1 is the process of the decarboxylation of LG to generate CO2 after ring opening. The reaction is divided into two steps, and the reaction process is simple. We can see from Fig. 8 that the rate-determining state is LG (Compound 1) and transition state TS1 of step 1, with a ΔE of 301 kJ mol−1. The reaction step is complicated by the decarbonylation reaction of the aldehyde group after the ring opening of LG. For example, when calculating the decarbonylation of Compound 6 to Compound 22 and CO, we found that this step is not a primitive reaction, and there is a Compound 7 with a lower energy than Compound 6, indicating that Compound 7 is a more stable structure. We then calculated the cracking process of Compound 7. We can see from the potential energy profile that the corresponding ΔE of paths 3, 4, 6, 8, and 9 are 292 kJ mol−1 (difference between E11+TS12 and E7), 362 kJ mol−1 (difference between ETS13+10 and E7), 348 kJ mol−1 (difference between ETS15+13 and E7), 350 kJ mol−1 (difference between E19+TS18 and E7), and 302 kJ mol−1 (the difference between ETS10 and E7), respectively. Among these, path 3 has the smallest energy span. In steps 1–18, the reaction energy barrier of step 8 (109 kJ mol−1) in paths 6 and 7 is the smallest. The energy barrier of the subsequent cracking reaction is high, and the overall energy span is large. Therefore, this is not the most kinetically optimal reaction path.
Furthermore, by observing the reaction energy barrier of each step in Fig. 2, we can see that the energy barrier of the decarbonylation reaction of the aldehyde group (step 11, 330 kJ mol; step 12, 279 kJ mol; step 13, 303 kJ mol; step 15, 265 kJ mol; and step 18, 296 kJ mol−1) is generally larger than the carbon chain fracture energy barrier (step 6, 229 kJ mol; step 7, 224 kJ mol; step 8, 109 kJ mol; and step 9, 225 kJ mol−1).
3.4. Enol–ketone tautomerization after LG dehydration
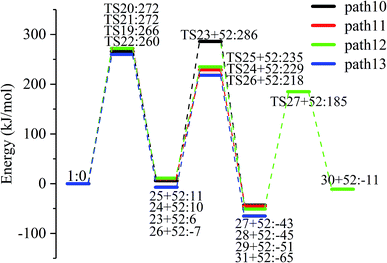
LG contains three hydroxyl groups. During the dehydration process, there are six dehydration methods depending on the dehydrogenation position, namely O3H19 + H12, O3H19 + H14, O4H20 + H13, O4H20 + H15, O5H21 + H14 and O5H21 + H16. Among them, the energy barriers of dehydration reaction of O3H19 + H12 and O5H21 + H16 are larger,19 and the dehydrated product cannot undergo enol–keto tautomerization to form a carbonyl group, so these two dehydration reactions are not analysed here. Therefore, this paper only considers the other four kinds of reactions that can form carbonyl after dehydration. The corresponding steps are steps 19–22, respectively, and the corresponding energy barriers are shown in Fig. 3. The energy barriers for these four steps are 266 kJ mol−1, 272 kJ mol−1, 272 kJ mol−1 and 260 kJ mol−1, respectively. The results are very close to the calculation obtained by Zhang19 using the B3LYP method. Fig. 10 shows the structure and partial bond length information of various compounds and transition states during the dehydration of L-glucan. The breaking process of C–OH and C–H in the dehydration reaction can be clearly seen here.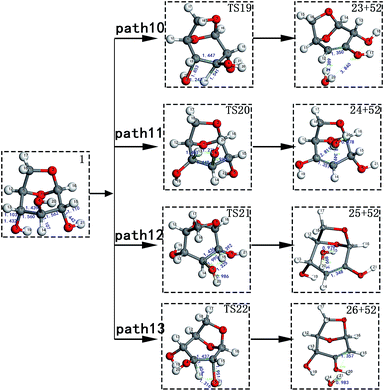 | ||
| Fig. 10 Structure and partial bond length information of various compounds and transition states during the dehydration of LG in Scheme 2. | ||
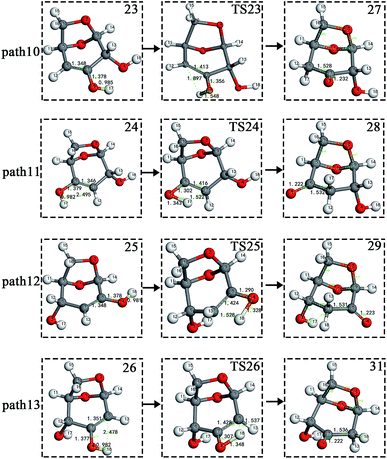
The carbon–carbon double bond and the hydroxyl group on the carbon in the structure of the product formed by hydrolysis of LG can undergo tautomerization to form a carbonyl group, and steps 23–26 are such reactions. Fig. 11 shows the structure and partial bond length information of each compound involved in the tautomeric reaction in Scheme 2. Fig. 12 shows the potential energy profile of the reaction path in Scheme 2. It can be seen from Fig. 12 that the energy barrier for the conversion of enol into a ketone is mostly about 220 kJ mol−1. However, the energy barrier of the dehydration reaction is greater than 260 kJ mol−1, indicating that the isomerization reaction is easier than dehydration.
 | ||
| Fig. 11 Structure and partial bond length information of compounds and transition states in tautomeric reactions in Scheme 2. | ||
As shown in Fig. 12, the total energies of the isomerized products (Compounds 27–31) are lower than those of the dehydrated products (Compounds 23–26), and thus the stability of the isomerized products are also higher than that of the dehydrated ones. The tautomerization is a reversible reaction. Observing the potential energy profile of the tautomerization reaction of steps 23–26, it can be seen that the energy barrier of the reverse reaction is higher than the positive one, and thus the reaction tends to form a ketone. Among the four tautomeric reactions, step 23 is worthy of attention because its reaction energy barrier is 50 kJ mol−1 higher than the other three similar reactions. For this step, it can be seen from the structure of the reactant 23 in Fig. 11 that the spatial positions of H17 and O4 are relatively close (their distance is 2.273 Å, the distance between O4 and their hydrogen bond acceptor O3 is 2.815 Å), and hydrogen bonds O3–H17⋯O4 may be formed. Therefore, in this step, the transfer of H17 to C6 must overcome the influence of hydrogen bonding, while the other three reactions have no effects, so the energy barrier of step 23 is higher than the other three reactions.
3.5. Ring-opening pyrolysis after LG dehydration
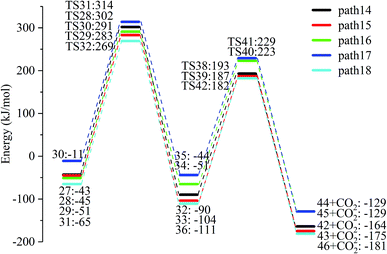
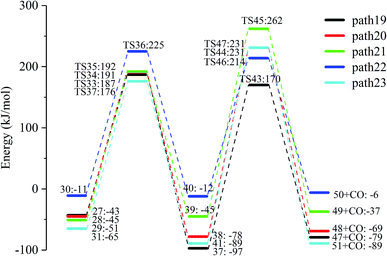
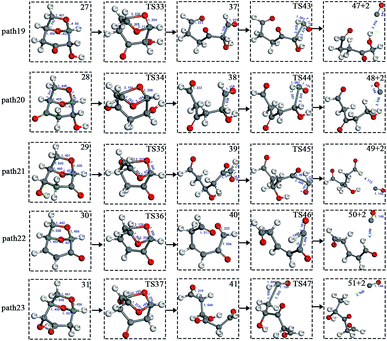
After the dehydration of LG, the products of the enol–keto tautomerization are Compounds 27–31, and the functional groups on the carbon chains undergo a large change, but the cyclic ether structure in their carbon skeleton remains consistent. Two types of reactions are designed for the different C–O fracture modes of the five compounds (27–31). The first type is the formation of carboxyl groups by CO cleavage (see Fig. 13), followed by decarboxylation to form CO2, which is path 14–18; the second is CO cleavage to form aldehyde groups (see Fig. 15), followed by aldehyde decarbonylation to form CO (see paths 19–23). Fig. 14 shows the potential energy profile of the decarbonylation pathway in Scheme 3; Fig. 16 is a potential energy profile of the decarbonylation pathway in Scheme 3.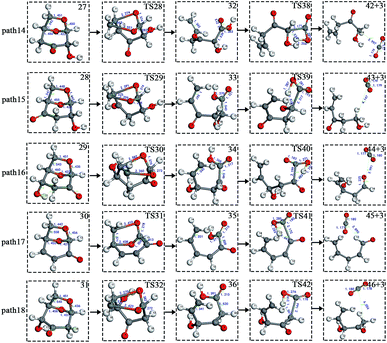 | ||
| Fig. 13 Structure and partial bond length information of compounds and transition states in decarboxylation reactions in Scheme 3. | ||
 | ||
| Fig. 15 Structure and partial bond length information of compounds and transition states in decarbonylation reactions in Scheme 3. | ||
As shown in Fig. 14, the reaction energy span of path 17 is a minimum of 324 kJ mol−1 in the five reaction paths. Combined with the data in Fig. 14, the transition state of TS31 is comparable to that of reactant 30, and the bond lengths of C4–O1 and C9–O2 increase from 1.455 Å and 1.422 Å to 2.438 Å and 2.410 Å, respectively. At the same time, the O2–C8 bond length is shortened from 1.456 Å to 1.278 Å, H13 is close to O1, and then a double bond (O2![[double bond, length as m-dash]](https://www.rsc.org/images/entities/char_e001.gif) C8) and hydroxyl (–O1H13) are formed. Reactant 35, which forms after ring opening, contains a carboxyl group, and the decarboxylation reaction energy barrier in this step is 273 kJ mol−1, which is the lowest energy barrier of the five decarboxylation reactions of steps 38–42. Combined with the decarboxylation process of step 2, we observed that the carboxyl-containing geometry and decarboxylation process are similar, and their reaction energy barriers are relatively close. The maximum energy barrier is 292 kJ mol−1 in step 42 and the minimum is 273 kJ mol−1 in step 41. Therefore, step 41 is taken as an example to analyse the specific process of the carboxyl decarboxylation reaction. The reaction mechanism is as follows: H13 on the carboxyl group of reactant 35 is rotated to face the C7 position. The O1–H13 bond length increases from 0.998 Å to 1.253 Å, while the distance between H13 and C7 is reduced to 1.641 Å. As seen from the transition state TS41, the distance of C8–C7 increases from 1.559 Å to 2.172 Å, and gradually breaks. Moreover, due to the P–π conjugation, the bond lengths of the two C–O bonds (O1–C8 and O2–C8) tend to be averaged, shortened to 1.285 Å and 1.185 Å, and finally the CO2 molecules are directly extracted.
C8) and hydroxyl (–O1H13) are formed. Reactant 35, which forms after ring opening, contains a carboxyl group, and the decarboxylation reaction energy barrier in this step is 273 kJ mol−1, which is the lowest energy barrier of the five decarboxylation reactions of steps 38–42. Combined with the decarboxylation process of step 2, we observed that the carboxyl-containing geometry and decarboxylation process are similar, and their reaction energy barriers are relatively close. The maximum energy barrier is 292 kJ mol−1 in step 42 and the minimum is 273 kJ mol−1 in step 41. Therefore, step 41 is taken as an example to analyse the specific process of the carboxyl decarboxylation reaction. The reaction mechanism is as follows: H13 on the carboxyl group of reactant 35 is rotated to face the C7 position. The O1–H13 bond length increases from 0.998 Å to 1.253 Å, while the distance between H13 and C7 is reduced to 1.641 Å. As seen from the transition state TS41, the distance of C8–C7 increases from 1.559 Å to 2.172 Å, and gradually breaks. Moreover, due to the P–π conjugation, the bond lengths of the two C–O bonds (O1–C8 and O2–C8) tend to be averaged, shortened to 1.285 Å and 1.185 Å, and finally the CO2 molecules are directly extracted.
Combined with the potential energy profile shown in Scheme 2 (Fig. 12) and the potential energy profile of the decarboxylation pathway in Scheme 3 (Fig. 14), we calculated the energy span of several paths that generate CO2. The calculation results are shown in Table 6. We can see that the optimal paths for generating CO2 are paths 11 and 15, and its ΔE is at least 327 kJ mol−1. This path specifically includes the dehydrogenation of LG and produces Compound 24. Compound 24 then undergoes alcohol–keto tautomerization to form Compound 28, followed by a ring-opening reaction to form a carboxyl group containing Compound 33, and finally decarboxylation to CO2. We can also see from Table 6 that the critical states of these CO2 generation paths are mostly related to the ring-opening reaction. The energy span for generating CO2 in Scheme 1 is also equal to the energy barrier of the ring-opening reaction. This indicates that ring opening has the greatest influence on the reaction process during the entire CO2 formation process. Comparing the five ring-opening energy barriers of steps 28–32 with the energy barrier of step 1, we calculated that the dehydration increases the ring-opening energy barrier to at least 25 kJ mol−1. Therefore, dehydration increases the difficulty of opening the ring and inhibits the formation of CO2.
| Pathway | TDI (kJ mol−1) | TDTS (kJ mol−1) | Energy span ΔE (kJ mol−1) |
|---|---|---|---|
| Path 10 + path 14 | 27![[thin space (1/6-em)]](https://www.rsc.org/images/entities/char_2009.gif) : :![[thin space (1/6-em)]](https://www.rsc.org/images/entities/char_2009.gif) −43 −43 |
TS28![[thin space (1/6-em)]](https://www.rsc.org/images/entities/char_2009.gif) : :![[thin space (1/6-em)]](https://www.rsc.org/images/entities/char_2009.gif) 302 302 |
345 |
| Path 11 + path 15 | 28![[thin space (1/6-em)]](https://www.rsc.org/images/entities/char_2009.gif) : :![[thin space (1/6-em)]](https://www.rsc.org/images/entities/char_2009.gif) −45 −45 |
TS29![[thin space (1/6-em)]](https://www.rsc.org/images/entities/char_2009.gif) : :![[thin space (1/6-em)]](https://www.rsc.org/images/entities/char_2009.gif) 282 282 |
327 |
| Path 12 + path 16 | 29![[thin space (1/6-em)]](https://www.rsc.org/images/entities/char_2009.gif) : :![[thin space (1/6-em)]](https://www.rsc.org/images/entities/char_2009.gif) −51 −51 |
TS30![[thin space (1/6-em)]](https://www.rsc.org/images/entities/char_2009.gif) : :![[thin space (1/6-em)]](https://www.rsc.org/images/entities/char_2009.gif) 291 291 |
342 |
| Path 12 + path 17 | 29![[thin space (1/6-em)]](https://www.rsc.org/images/entities/char_2009.gif) : :![[thin space (1/6-em)]](https://www.rsc.org/images/entities/char_2009.gif) −51 −51 |
TS31![[thin space (1/6-em)]](https://www.rsc.org/images/entities/char_2009.gif) : :![[thin space (1/6-em)]](https://www.rsc.org/images/entities/char_2009.gif) 315 315 |
366 |
| Path 13 + path 18 | 31![[thin space (1/6-em)]](https://www.rsc.org/images/entities/char_2009.gif) : :![[thin space (1/6-em)]](https://www.rsc.org/images/entities/char_2009.gif) −65 −65 |
TS32![[thin space (1/6-em)]](https://www.rsc.org/images/entities/char_2009.gif) : :![[thin space (1/6-em)]](https://www.rsc.org/images/entities/char_2009.gif) 270 270 |
335 |
Fig. 15 and 16 reflect the process and potential energy diagram of CO formation after the opening of dehydration products 27–31. The first step in the design of the ring-opening reaction is to determine the position of the ring-opening reaction according to the population of Reactants 27–31. The second step is decarbonylation. As reactants 37–41 have more carbonyl groups, the bond-breaking reaction is more complicated. To simplify the reaction route and facilitate comparisons with each other, only the decarbonylation reaction of the aldehyde group at the C9 position at the ring-opening position is considered. The energy span of the reaction pathway for the production of CO from LG was calculated. The results are shown in Table 7. We can see from Table 7 that the minimum energy span is 286 kJ mol−1 for path 10 + path 19. Similarly, we compared the ring-opening reaction of the compound after dehydration, steps 33–37, with step 3 and found that the energy barrier increased by at least 6 kJ mol−1. Therefore, dehydration also inhibits the formation of aldehyde groups by ring opening.
| Pathway | TDI (kJ mol−1) | TDTS (kJ mol−1) | Energy span ΔE (kJ mol−1) |
|---|---|---|---|
| Path 10 + path 19 | 1![[thin space (1/6-em)]](https://www.rsc.org/images/entities/char_2009.gif) : :![[thin space (1/6-em)]](https://www.rsc.org/images/entities/char_2009.gif) 0 0 |
TS23![[thin space (1/6-em)]](https://www.rsc.org/images/entities/char_2009.gif) : :![[thin space (1/6-em)]](https://www.rsc.org/images/entities/char_2009.gif) 286 286 |
286 |
| Path 11 + path 20 | 38![[thin space (1/6-em)]](https://www.rsc.org/images/entities/char_2009.gif) : :![[thin space (1/6-em)]](https://www.rsc.org/images/entities/char_2009.gif) −78 −78 |
TS44![[thin space (1/6-em)]](https://www.rsc.org/images/entities/char_2009.gif) : :![[thin space (1/6-em)]](https://www.rsc.org/images/entities/char_2009.gif) 231 231 |
309 |
| Path 12 + path 21 | 29![[thin space (1/6-em)]](https://www.rsc.org/images/entities/char_2009.gif) : :![[thin space (1/6-em)]](https://www.rsc.org/images/entities/char_2009.gif) −51 −51 |
TS45![[thin space (1/6-em)]](https://www.rsc.org/images/entities/char_2009.gif) : :![[thin space (1/6-em)]](https://www.rsc.org/images/entities/char_2009.gif) 262 262 |
313 |
| Path 12 + path 22 | 29![[thin space (1/6-em)]](https://www.rsc.org/images/entities/char_2009.gif) : :![[thin space (1/6-em)]](https://www.rsc.org/images/entities/char_2009.gif) −51 −51 |
TS31![[thin space (1/6-em)]](https://www.rsc.org/images/entities/char_2009.gif) : :![[thin space (1/6-em)]](https://www.rsc.org/images/entities/char_2009.gif) 315 315 |
366 |
| Path 13 + path 23 | 41![[thin space (1/6-em)]](https://www.rsc.org/images/entities/char_2009.gif) : :![[thin space (1/6-em)]](https://www.rsc.org/images/entities/char_2009.gif) −89 −89 |
TS47![[thin space (1/6-em)]](https://www.rsc.org/images/entities/char_2009.gif) : :![[thin space (1/6-em)]](https://www.rsc.org/images/entities/char_2009.gif) 231 231 |
320 |
4. Conclusion
In this study, we investigated some typical decomposition pathways for LG, and studied the reaction mechanisms of CO and CO2 gas formation by calculating the potential energy difference of the reaction pathways. The main conclusions are as follows: (1) the direct ring opening of LG to form an aldehyde group (step 3, 224 kJ mol−1) is easier than the formation of a carboxyl group (step 1, 301 kJ mol−1). Furthermore, the ring-opening reaction is inhibited after dehydration, making it difficult to form an aldehyde group and a carboxyl group by ring opening. The energy spans of CO generated before and after dehydration were 292 kJ mol−1 and 286 kJ mol−1, respectively. The energy span of CO2 before dehydration was 301 kJ mol−1, and this increased to 327 kJ mol−1 after dehydration. The above descriptions show that dehydration is beneficial to the pyrolysis of LG to form CO, which is not conducive to the formation of CO2. (2) The optimal reaction pathway for CO2 is step 1 (open loop) → step 2 (decarboxylation), with an energy span of 301 kJ mol−1. The optimal reaction path for CO is step 19 (dehydration) → step 23 (alcohol–keto isomerization) → step 33 (open loop) → step 43 (decarbonylation), with an energy span of 286 kJ mol−1, which is 15 kJ mol−1 smaller than the energy span of CO2. Therefore, it is theoretically simpler to produce CO from LG than to generate CO2. (3) The decarboxylation reaction is more difficult than the decarbonylation reaction of an aldehyde group. The lowest decarboxylation barrier is step 41 (273 kJ mol−1), and the lowest decarbonylation barrier is step 46 (226 kJ mol−1). Moreover, the decarboxylation reaction is less affected by the surrounding functional groups, and the decarboxylation energy barriers of different compounds containing carboxyl groups are relatively close (the maximum energy barrier is 292 kJ mol−1 for step 42 and the minimum is 273 kJ mol−1 for step 41). The decarbonylation energy barrier of aldehydes is greatly affected by the length of the carbon chain and the surrounding functional groups (the maximum decarbonylation barrier is 335 kJ mol−1 for step 14, and the minimum is 226 kJ mol−1 for step 46).Conflicts of interest
There are no conflicts to declare.Acknowledgements
We gratefully acknowledge the financial support provided by the National Natural Science Funds for Young Scholars of China (No. 51806033), National Key Technologies Research and Development Program (No. 2018YFB0905104) and Jilin Provincial Science and Technology Development Program (No. 20190201096JC).Notes and references
- D. Shen, R. Xiao, S. Gu and K. Luo, RSC Adv., 2011, 1, 1166–1641 Search PubMed.
- A. Dufour, J. Weng, L. Jia, X. Tang, B. Sirjean, R. Fournet, H. L. Gall, N. Brosse, F. Billaud, G. Mauviel and F. Qi, RSC Adv., 2013, 3, 4786–4792 RSC.
- M. N. Uddin, W. M. A. W. Daud and H. F. Abbas, RSC Adv., 2014, 4, 10467 RSC.
- M. Zheng, Z. Wang, X. Li, X. Qiao, W. Song and L. Guo, Fuel, 2016, 177, 130–141 CrossRef CAS.
- M. Zhang, Z. Geng and Y. Yu, Comput. Theor. Chem., 2015, 1067, 13–23 CrossRef CAS.
- J. B. Paine, Y. B. Pithawalla and J. D. Naworal, J. Anal. Appl. Pyrolysis, 2008, 83, 10–41 CrossRef.
- Y. Zhang, C. Liu and X. Chen, J. Anal. Appl. Pyrolysis, 2015, 113, 621–629 CrossRef CAS.
- S. Wang, Z. Xia, Q. Wang, Z. He and H. Li, J. Anal. Appl. Pyrolysis, 2017, 126, 118–131 CrossRef CAS.
- C. Liu, J. Huang, X. Huang, H. Li and Z. Zhang, Comput. Theor. Chem., 2011, 1–3, 207–212 CrossRef.
- X. Meng, H. Zhang, C. Liu and R. Xiao, Energy Fuels, 2016, 30, 8369–8376 CrossRef CAS.
- S. R. Wang, Y. F. Liao, H. Tan, Z. Y. Luo and K. F. Cen, J. Fuel Chem. Technol., 2003, 31, 133–138 Search PubMed.
- J. K. Lindstrom, J. Proano-Aviles, P. A. Johnston, C. A. Peterson, J. S. Stansell and R. C. Brown, Green Chem., 2019, 21, 178–186 RSC.
- Q. Lu, X. Yang, C. Dong, Z. Zhang, X. Zhang and X. Zhu, J. Anal. Appl. Pyrolysis, 2011, 92, 430–438 CrossRef CAS.
- H. Kawamoto, H. Morisaki and S. Saka, J. Anal. Appl. Pyrolysis, 2009, 85, 247–251 CrossRef CAS.
- S. D. Li, X. L. Chen, L. Wang and G. S. Yu, J. Fuel Chem. Technol., 2014, 42, 414–419 CAS.
- F. Shafizadeh and Y. Z. Lai, J. Org. Chem., 1972, 37, 278–284 CrossRef CAS.
- S. Li, J. Lyons-Hart, J. Banyasz and K. Shafer, Fuel, 2001, 80, 1809–1817 CrossRef CAS.
- X. Zhang, J. Li, W. Yang and W. Blasiak, Energy Fuels, 2011, 25, 3739–3746 CrossRef CAS.
- X. Zhang, W. Yang and W. Blasiak, J. Anal. Appl. Pyrolysis, 2012, 96, 110–119 CrossRef CAS.
- I. M. Rocha, T. L. P. Galvao, E. Sapei and M. D. M. C. Silva, J. Chem. Eng. Data, 2013, 58, 1813–1821 CrossRef CAS.
- S. Wu, H. Yang, J. Hu, D. Shen, H. Zhang and R. Xiao, J. Anal. Appl. Pyrolysis, 2016, 120, 252–257 CrossRef CAS.
- P. Charoenwiangnuea, T. Maihom, P. Kongpracha, J. Sirijaraensre and J. Limtrakul, RSC Adv., 2016, 6, 105888–105894 RSC.
- S. Wu, H. Yang, D. S. Jun Hu, H. Zhang and R. Xiao, J. Anal. Appl. Pyrolysis, 2016, 120, 252–257 CrossRef CAS.
- L. X. Ling, L. Y. Zhao, R. G. Zhang and B. J. Wang, CIESC J., 2009, 60, 1224–1230 CAS.
- J. P. Perdew, K. Burke and M. Ernzerhof, Phys. Rev. Lett., 1996, 77, 3865–3868 CrossRef CAS PubMed.
- B. Hammer, Phys. Rev. B: Condens. Matter Mater. Phys., 1998, 11, 7413–7421 Search PubMed.
- B. Delley, J. Chem. Phys., 2000, 113, 7756–7764 CrossRef CAS.
- N. Govind, M. Petersen, G. Fitzgerald, D. King-Smith and J. Andzelm, Comput. Mater. Sci., 2003, 28, 250–258 CrossRef CAS.
- J. B. Bruce, Classical and quantum dynamics in condensed phase simulations, World Scientific Publishing Co Pte Ltd, 1998 Search PubMed.
- L. Smrcok, M. Sládkovičová, V. Langer, C. C. Wilson and M. Koóš, Acta Crystallogr., Sect. B: Struct. Sci., 2006, 62, 912–918 CrossRef PubMed.
- M. Sládkovicová, P. Mach, L. U. Smrcok and H. Rundlöf, Open Chem., 2007, 5, 55–70 Search PubMed.
- Y. J. Park, H. SKim and G. A. Jeffrey, Acta Crystallogr., Sect. B: Struct. Crystallogr. Cryst. Chem., 1971, 27, 220–227 CrossRef CAS.
- J. B. Huang, C. Liu, G. S. Zeng, Y. Xie, H. Tong and W. M. Li, J. Fuel Chem. Technol., 2012, 40, 807–815 CrossRef CAS.
- S. Wu, D. Shen, S. Gao, X. Zha and R. Xiao, J. Southeast Univ., 2013, 3, 282–288 Search PubMed.
- B. Z. Sun, H. L. Liang, D. Y. Che, H. P. Liu and S. Guo, RSC Adv., 2019, 9, 9099–9105 RSC.
- E. W. Leng, X. Gong, Y. Zhang and M. H. Xu, CIESC J., 2018, 69, 239–248 CAS.
- Y. F. Liao, Mechanism Study of Cellulose Pyrolysis, Zhejiang University, 2003 Search PubMed.
- H. Kawamoto, M. Murayama and S. Saka, J. Wood Sci., 2003, 49, 469–473 CrossRef CAS.
- E. Jakab, O. Faix, F. Till and T. Székely, J. Anal. Appl. Pyrolysis, 1995, 35, 167–179 CrossRef CAS.
- M. Wang, Z. Zuo, R. Ren, Z. Gao and W. Huang, Energy Fuels, 2016, 30, 2833–2840 CrossRef CAS.
- J. Wang, M. Yang, D. Deng and S. Qiu, J. Mol. Model., 2017, 23, 262 CrossRef PubMed.
- J. B. Huang, C. Liu, G. S. Zeng, Y. Xie, H. Tong and W. M. Li, J. Fuel Chem. Technol., 2012, 40, 807–815 CrossRef CAS.
- R. Vinu and L. J. Broadbelt, Energy Environ. Sci., 2012, 5, 9808–9826 RSC.
- D. K. Shen and S. Gu, Bioresour. Technol., 2009, 100, 6496–6504 CrossRef CAS PubMed.
- S. Kozuch and S. Shaik, Acc. Chem. Res., 2011, 44, 101–110 CrossRef CAS PubMed.
Footnote |
| † Electronic supplementary information (ESI) available: 3D images of all optimized structures. See DOI: 10.1039/c9ra03138c |
| This journal is © The Royal Society of Chemistry 2019 |

