 Open Access Article
Application of micro-impinging stream reactors in the preparation of Co and Al co-doped Ni(OH)2 nanocomposites for supercapacitors and their modification with reduced graphene oxide
Renjie Gua,
Xuelei Lib,
Kunpeng Chenga and
Lixiong Wen *ab
*ab
aState Key Laboratory of Organic-Inorganic Composites, Beijing University of Chemical Technology, Beijing 100029, China. E-mail: wenlx@mail.buct.edu.cn; Fax: +86-10-64434784; Tel: +86-10-64443614
bResearch Center of the Ministry of Education for High Gravity Engineering and Technology, Beijing University of Chemical Technology, Beijing 100029, China
First published on 15th August 2019
Abstract
A micro-impinging stream reactor (MISR) consisting of a commercial T-junction and steel capillaries, which is of intensified micromixing efficiency as compared with traditional stirred reactors (STR), was applied for the preparation of Co and Al co-doped Ni(OH)2 nanocomposites and their modification with reduced graphene oxide (RGO). The co-precipitation preparation process was conducted under precisely controlled proportions and concentrations of reactants in the MISR. Therefore, element analysis showed a higher uniform distribution of metal ions within the nanocomposites obtained through the MISR. The structural characterization and electrochemical measurements also showed that the MISR-prepared metal-doped nanocomposites were of more uniform dispersion and superior electrochemical performance than those prepared with STR. In addition, by modifying with RGO in the MISR, the electrochemical performance of Co and Al co-doped Ni(OH)2 nanocomposites could be further improved. The Co and Al co-doped Ni(OH)2/RGO prepared under optimal conditions achieved an ultrahigh specific capacitance of 2389.5 F g−1 at the current density of 1 A g−1 and displayed an excellent cycling stability with 83.7% retention of the initial capacitance after 1000 charge/discharge cycles in 6 M KOH aqueous solution.
1. Introduction
Nickel-based materials have attracted intense research interest for applications in supercapacitors due to their high electrochemical activity and environmental friendliness.1–3 In recent years, much attention has been devoted to doping other metallic materials like Co(OH)2 and Al(OH)3 and carbon materials like graphene with Ni(OH)2 in order to develop hybrid materials with excellent electrochemical properties.4–11 It has been reported that Ni(OH)2 can exist in two forms, i.e., α-Ni(OH)2 and β-Ni(OH)2.12 The former possesses better electrochemical activity than the latter. However, the α-Ni(OH)2 phase is difficult to prepare because of its unstable nature in strong alkaline electrolyte and it can be easily transformed to β-Ni(OH)2.13 Research also indicated that the doping of metallic materials like Co and Al can enhance the stability of α-Ni(OH)2 and improve the electrochemical performance of Ni(OH)2.14 However, Ni(OH)2 has its intrinsic weakness as supercapacitor material because of its poor electrical conductivity and rate capability.15,16 Graphene is a state-of-the-art carbon material with large surface area and high conductivity.17 Adding graphene into Ni(OH)2 is considered to be an effective approach to overcome the above weakness of Ni(OH)2.18 Graphene can provide a support with high specific surface area for the deposition of Ni(OH)2. In addition, graphene is expected to construct a 3D conductive network among metal oxide particles,19 which can enhance the transmitting of ions between composites and electrolytes. Therefore, the combined doping route, which can fully take advantage of the synergetic effects among Ni(OH)2, the other metallic materials and graphene, seems a promising method to prepare nanocomposites for supercapacitors with excellent electrochemical properties.Several methods have been applied to synthesize nickel-based materials, such as microwave-incorporated hydrothermal synthesis,5 facile chemical co-precipitation,20 in situ growth,21 etc. Co-precipitation method was widely used due to its flexibility and simplicity. Recently, Chen et al. successfully synthesized Al–Co–Ni/graphene by a facile chemical co-precipitation route and found that the produced composites showed an ultrahigh specific capacitance and fine cycling stability.14 Tiruneh et al. prepared lamellar Co–Ni(OH)2/reduced graphene oxide (RGO) nanocomposites with high capacitance retention and good cycling stability by co-precipitation followed by hydrothermal synthesis.22 A similar result was obtained by Yan et al., who successfully anchored Ni(OH)2 on graphene sheets by a facile chemical precipitation approach.17 It has been demonstrated that co-precipitation is an effective approach for doping additional metal ions.
The co-precipitation process (often fast reaction) is sensitive to the mixing condition within the reactor. It is usually considered that the achievement of supersaturation-thermodynamic controlled phase transition is important during the precipitation of crystal particles.23 The nucleation and growth rate depends highly on the supersaturation level. Therefore, a uniform micromixing condition will be expected to promote the uniform level of high supersaturation and hence the product properties. However, uniform supersaturation is hard to be obtained in a traditional stirred reactor (STR) due to its poor micromixing performance, which will have great effects on the crystal size distribution of the co-precipitation process.24 When one co-precipitation process occurs in a uniform micromixing condition in MISR, reactants will react at a homogeneous rate leading to a more uniform size distribution of crystal particles. In addition, when the co-precipitation process contains a variety types of elements, these elements may distribute uniformly within the MISR-prepared products, which might enhance the synergetic effects among all the components. Therefore, a uniform micromixing condition is essential to the quality of co-precipitation products.
In the past few years, a lot of micro-structured reactors have been developed for the enhancement of micromixing performance such as silicone microreactors,25 micro-sieve dispersion reactor,26 segmented flow microreactors,27 tube-in-tube microchannel reactor,28 etc. Wang et al. successfully prepared uniform titanium dioxide particles with a mean particle size of ∼10 nm by the microchannel reactor, demonstrating the great advantage of the microchannel reactor for the control of particle sizes.29 All the micro-structured reactors possess precision structure and can obtain a certain degree of intensification on the micromixing efficiency. However, most of the micro-structured reactors are limited by low throughput and severe blocking problems when applied to precipitation process. Besides, due to the precision structure, most of the micro-structured reactors are hard for massive fabrication and scale up, which was restricted in part by the high cost.
In this work, a micro-impinging stream reactor (MISR) based on our previous studies,30,31 which possesses a superior micromixing performance, was applied to prepare Co and Al co-doped Ni(OH)2 (Ni–Co–Al(OH)n) nanocomposites. The MISR consists of two stainless steel capillaries connected with a commercial T-junction. A uniform supersaturation will be obtained at the moment when the two streams impinge on each other directly in the T-junction; therefore, a homogeneous environment for the co-precipitation of particles can be provided, which is expected to enhance the synergetic effects of the hybrid materials so that nanocomposites with excellent electrochemical performance will be obtained. In addition, graphene oxide was also added with MISR to further improve the electrochemical performance of the Ni–Co–Al(OH)n nanocomposites.
2. Experimental
2.1 Materials
Nickel sulfate hexahydrate [NiSO4·6H2O], hydrogen peroxide [H2O2] and hydrazine hydrate [N2H4·H2O] were purchased from Macklin Biochemical Co., Ltd. (Shanghai, China). Aluminum sulfate hydrate [Al2(SO4)3·7H2O], polyvinylidene fluoride [PVDF], potassium hydroxide [KOH], acetylene black [C2H2] and potassium chloride [KCl] were provided by Sinopharm Chemical Reagent Co., Ltd. (Shanghai, China). Sodium hydroxide [NaOH], ammonia [NH3·7H2O] and sodium sulfate [Na2SO4] were obtained from Aladdin Biochemical Technology Co., Ltd. (Shanghai, China). Absolute ethyl alcohol [C2H6O] was supplied by Tongguang Fine Chemical Co., Ltd. (Beijing, China). Cobalt sulfate heptahydrate [CoSO4·7H2O] was acquired from Thermo Fisher Scientific (Shanghai, China). Flake graphite was purchased from Huatai Lube Seals Technology Co., Ltd. (Qingdao, China). All reagents were of analytical grade and used without further purification.2.2 Construction of MISR
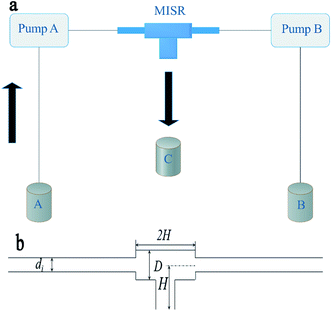
As shown in Fig. 1(a), MISR was constructed with two stainless steel capillaries and a commercial T-junction (Beijing Xiongchuan Technology Co. Ltd., SS-1UTF). The two streams impinged on each other directly inside the T-junction at a certain volumetric flow rate by two constant-flux pumps (Beijing Satellite Manufacture Factory, 2PB00C) to create a quick and constant supersaturation level so that a more homogeneous nucleation environment was provided. The products through the outlet were collected for further treatment after reaction. The internal structure and geometrical details of the T-junction are shown in Fig. 1(b).2.3 Preparation of Ni–Co–Al(OH)n nanocomposites
The preparation of Ni–Co–Al(OH)n was conducted with an MISR and a stirred reactor (STR), respectively. In a typical preparation, 0.009375 mol NiSO4·6H2O, 0.0009375 mol Al2(SO4)3·7H2O and 0.00125 mol CoSO4·7H2O were dissolved in 100 mL water as solution A. 0.025 mol NaOH was dissolved in another 100 mL water as solution B. The two solutions were injected into MISR simultaneously by the two pumps and impinged on each other directly inside the T-junction before flowing into a collecting vessel, or mixed by stirring in STR for 3 h. The precipitates were then aged for 3 h after reaction. The Ni–Co–Al(OH)n nanocomposites would be obtained after the products were washed, filtered and dried overnight at 60 °C.2.4 Synthesis of Ni–Co–Al(OH)n/RGO composites
The synthesis of Ni–Co–Al(OH)n/RGO composites was conducted by MISR. RGO was prepared with the improved Hummers' method.32 In a typical preparation, 0.009375 mol NiSO4·6H2O, 0.0009375 mol Al2(SO4)3·7H2O and 0.00125 mol CoSO4·7H2O along with 0.05 g GO, which was ultrasounded for 2 h in advance, were dispersed in 100 mL water and stirred for 2 h as solution A. 0.025 mol NaOH was dispersed in another 100 mL water as solution B. The two solutions impinged on each other directly inside MISR. The precipitates were then aged for 3 h after reaction and the obtained precursors were reduced for 1 h at 100 °C with N2H4·H2O. Finally, the Ni–Co–Al(OH)n/RGO composites would be obtained after the reduced products being washed, filtered and dried overnight at 60 °C.2.5 Characterization
The structure of the samples was examined by X-ray diffraction (XRD, Shimadzu XRD-6000) with Cu Kα radiation (λ = 0.15406 nm) at a scan rate of 3° min−1. XRD patterns were recorded in the range of 5–90°. Raman spectra were measured and collected using a 633 nm laser by a Raman spectrometer (Invia Reflex manufactured by Renishaw). The range of Raman shift was 120–5500 cm−1. SEM analysis was conducted with a Hitachi S-7800 scanning electron microscope operated at 10 kV. TEM analysis was conducted with a Hitachi HT7700 transmission electron microscope operated at 120 kV. Energy dispersive spectroscopy (EDS) analysis was conducted with a Hitachi S-4700 spectrum analyzer to analyze the element distributions of the prepared materials, so as to compare the effects of different synthetic methods on the element distribution. X-ray photoelectron spectroscopy (XPS) was conducted by a PHI-5000 Versaprobe spectrometer with a monochromated Al Kα radiation.2.6 Electrochemical measurement
All electrochemical tests were carried out in a three-electrode system with Pt electrode as an auxiliary electrode, HgO electrode as a reference electrode and 6 M KOH as electrolyte. The working electrodes were prepared by pressing mixtures of the as-prepared samples, acetylene black and polyvinylidene fluoride (PVDF) binder (at weight ratio of 0.08![[thin space (1/6-em)]](https://www.rsc.org/images/entities/char_2009.gif) :
:![[thin space (1/6-em)]](https://www.rsc.org/images/entities/char_2009.gif) 0.015
0.015![[thin space (1/6-em)]](https://www.rsc.org/images/entities/char_2009.gif) :
:![[thin space (1/6-em)]](https://www.rsc.org/images/entities/char_2009.gif) 0.005) together with an appropriate amount of N-methyl-2-pyrrolidone (NMP) onto a nickel foam current collector. Each working electrode had a geometric surface area of about 1 cm2. About 4 mg active substances were accurately weighed before electrochemical measurements. Cyclic voltammetry (CV) (with a window potential of 0–0.6 V) and electrochemical impedance spectroscopy (EIS) were carried out in an CH660e electrochemical workstation (Wuhan Land Electronic Co., Ltd., China). Galvanostatic charge/discharge (GCD) tests (0–0.4 V) were carried out with a CT2001A battery performance testing system (Shanghai Chenhua Instrument Co., Ltd., China). The specific capacitance (CS) of the electrode could be calculated from the galvanostatic charge/discharge curves according to the following equation:
0.005) together with an appropriate amount of N-methyl-2-pyrrolidone (NMP) onto a nickel foam current collector. Each working electrode had a geometric surface area of about 1 cm2. About 4 mg active substances were accurately weighed before electrochemical measurements. Cyclic voltammetry (CV) (with a window potential of 0–0.6 V) and electrochemical impedance spectroscopy (EIS) were carried out in an CH660e electrochemical workstation (Wuhan Land Electronic Co., Ltd., China). Galvanostatic charge/discharge (GCD) tests (0–0.4 V) were carried out with a CT2001A battery performance testing system (Shanghai Chenhua Instrument Co., Ltd., China). The specific capacitance (CS) of the electrode could be calculated from the galvanostatic charge/discharge curves according to the following equation:
 | (1) |
In addition, hybrid supercapacitors were also fabricated using Ni–Co–Al(OH)n/RGO and activated carbon as the positive and negative electrodes, respectively. To maintain the charge balance of the hybrid cell, the mass of the active materials was set as 1 mg (Ni–Co–Al(OH)n/RGO) and 7 mg (activated carbon). The total mass of the two electrodes in the hybrid capacitor was 8 mg.
3. Results and discussion
3.1 Electrochemical properties and characterization of Ni–Co–Al(OH)n nanocomposites
Fig. 2a presents XRD patterns of the Ni–Co–Al(OH)n nanocomposites produced in MISR under different doping conditions: no doping, doping with Al3+ or Co2+, and doping with both Al3+ and Co2+. It shows that the crystal structure of Ni(OH)2 was changed after doping in MISR. On the XRD curve for pure Ni(OH)2, the diffraction peaks corresponding to the (001), (100), (101), (102), (110) planes, represent the crystal form of β-Ni(OH)2. However, the diffraction peaks corresponding to the (003), (006), (101), (012), (101) and (113) planes, which represent the crystal form of α-Ni(OH)2, became dominant after pure Ni(OH)2 was doped. Such XRD result implies that the crystal form of β-Ni(OH)2 might change to α-Ni(OH)2 after being doped with other metal ions.14 Due to the synergetic effect of the inserted metal ions, the stability of the structure of α-Ni(OH)2 would be strengthened.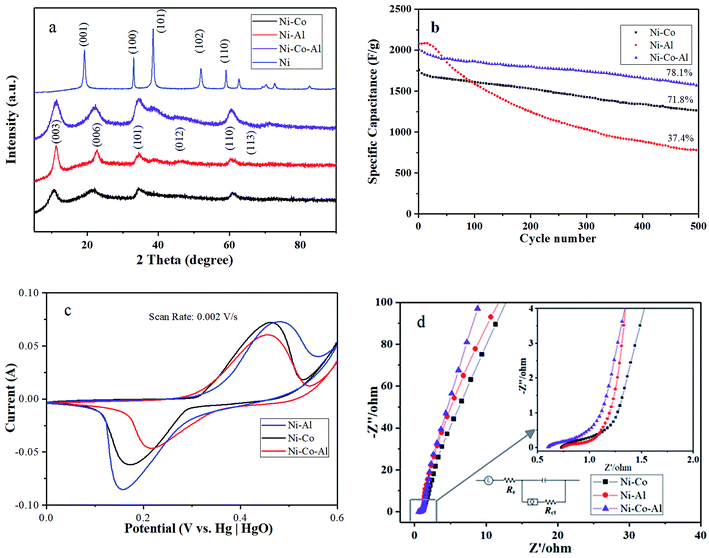 | ||
| Fig. 2 (a) XRD patterns; (b) cycle performance; (c) CV curves at a scan rate of 2 mV s−1 and (d) EIS spectra of the nanocomposites produced in MISR with different doping agents. | ||
The transformation of the crystal form reveals that Al3+ or Co2+ was well doped in nickel hydroxide, which demonstrates that MISR could be applied effectively to dope additional metal ions. In addition, it showed that the nanocomposites doped with Al3+ and Co2+ had the biggest full width at half maximum and the highest peak intensity of the (003) plane among these different doping scenarios, indicating that the crystal shape was the most integrated and the grain was the smallest. It also suggested that a better product quality could be obtained by doping Al3+ and Co2+ uniformly in nickel hydroxide with the benefit of superior micromixing performance of MISR.
Fig. 2b and c present the cycle performance and CV diagrams at a scan rate of 2 mV s−1 to verify the effects of doping agents on the electrochemical performance of the synthesized nanocomposites under different doping conditions. It showed that the highest maximum specific capacitance but poorest cycle performance was obtained when the materials were only doped with Al3+, while a better cycle performance but poor maximum specific capacitance was obtained when only Co2+ was doped. By doping with both Co2+ and Al3+ at a suitable ratio, both good cycle performance and high specific capacitance could be achieved, as shown in Fig. 2b and c. In this work, the ratio of Ni2+ to the doping ions was chosen as 3![[thin space (1/6-em)]](https://www.rsc.org/images/entities/char_2009.gif) :
:![[thin space (1/6-em)]](https://www.rsc.org/images/entities/char_2009.gif) 1. It has been reported that the addition of Al3+ could significantly enhance the specific capacitance. However, when only Al3+ was doped, the ratio of Ni2+
1. It has been reported that the addition of Al3+ could significantly enhance the specific capacitance. However, when only Al3+ was doped, the ratio of Ni2+![[thin space (1/6-em)]](https://www.rsc.org/images/entities/char_2009.gif) :
:![[thin space (1/6-em)]](https://www.rsc.org/images/entities/char_2009.gif) Al3+ was 3
Al3+ was 3![[thin space (1/6-em)]](https://www.rsc.org/images/entities/char_2009.gif) :
:![[thin space (1/6-em)]](https://www.rsc.org/images/entities/char_2009.gif) 1, which is an excessive content for Al3+, leading to increasing difficulty to charge due to the high charge potential.12 Therefore, the discharge capacities would decrease quickly and the cycle performance was poor. Co2+ doping is considered to be an effective approach to improve the lifetime.33 But when just Co2+ was doped, the increase of the maximum specific capacitance was not as significant as when Al3+ was doped. Therefore, when Co2+ and Al3+ were both doped at a suitable ratio, both of cycle performance and specific capacitance could be improved.14 The eventual specific proportion of Ni2+
1, which is an excessive content for Al3+, leading to increasing difficulty to charge due to the high charge potential.12 Therefore, the discharge capacities would decrease quickly and the cycle performance was poor. Co2+ doping is considered to be an effective approach to improve the lifetime.33 But when just Co2+ was doped, the increase of the maximum specific capacitance was not as significant as when Al3+ was doped. Therefore, when Co2+ and Al3+ were both doped at a suitable ratio, both of cycle performance and specific capacitance could be improved.14 The eventual specific proportion of Ni2+![[thin space (1/6-em)]](https://www.rsc.org/images/entities/char_2009.gif) :
:![[thin space (1/6-em)]](https://www.rsc.org/images/entities/char_2009.gif) Co2+
Co2+![[thin space (1/6-em)]](https://www.rsc.org/images/entities/char_2009.gif) :
:![[thin space (1/6-em)]](https://www.rsc.org/images/entities/char_2009.gif) Al3+ was chosen as 15
Al3+ was chosen as 15![[thin space (1/6-em)]](https://www.rsc.org/images/entities/char_2009.gif) :
:![[thin space (1/6-em)]](https://www.rsc.org/images/entities/char_2009.gif) 3
3![[thin space (1/6-em)]](https://www.rsc.org/images/entities/char_2009.gif) :
:![[thin space (1/6-em)]](https://www.rsc.org/images/entities/char_2009.gif) 2 after careful study in this work.
2 after careful study in this work.
The CV diagram of Fig. 2c also showed that, when Al3+ and Co2+ were added at the same time, the peak separation of the redox peak (ΔE) of the materials was 239 mV, far less than 288 mV and 327 mV. A smaller peak separation means a faster electron transfer rate and a better reversibility.34,35 The CV diagram agrees well with the cycle performance. The most symmetrical CV curve was obtained when both Al3+ and Co2+ were doped, indicating the best reversibility during the redox process. Due to the high reversibility, the electrochemical performance of the nanocomposites would not decrease greatly during the charge–discharge process. The results of the electrochemical tests were in good agreement with that of XRD. It demonstrated that additional metal ions were well inserted into the lattice of Ni(OH)2 by MISR so that the positive synergetic effects would be successfully motivated, which is the key to enhance the stability of α-Ni(OH)2 and achieve superior electrochemical performance.
Fig. 2d presents the EIS diagram of the nanocomposites with different doping agents. The semicircle of the Nyquist plots reflects charge transfer resistance (Rct) and double-layer capacitance (Cdl). Rct is caused by Faradaic reactions and Cdl is on the grain surface. At low frequencies, the slope of the curve is controlled by the electrolyte diffusion in the electrode pores and the proton diffusion in the host materials (a Warburg impedance). The curve at very high frequencies is related to the intrinsic resistance of substrate, ionic resistance of electrolyte and contact resistance at the active material/current collector interface.13 From Fig. 2d, it can be observed that the semicircle of the plot for the Ni–Co–Al electrode was the smallest, indicating that the charge transfer resistance decreased slightly after the materials were modified with both Al3+ and Co2+. Based on the above analysis, it suggested that Al3+ and Co2+ could be doped well in nickel hydroxide by MISR so that a better electrochemical performance could be achieved.
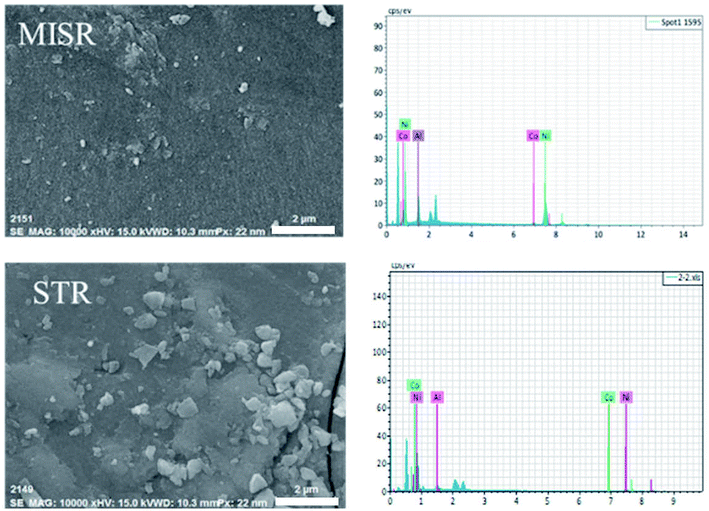
For further studying the performance of MISR in the preparation of nanocomposites and verifying the importance of micromixing in the co-precipitation process, the structure and morphology of both Ni–Co–Al(OH)n nanocomposites prepared by MISR and STR, respectively, were investigated. SEM and TEM images of the Ni–Co–Al(OH)n nanocomposites prepared by MISR and STR are presented in Fig. 3a and b, respectively, both showing an irregular microsphere morphology of the nanocomposites with an average size less than 100 nm. However, the MISR-prepared Ni–Co–Al(OH)n nanocomposites were less aggregated than the STR-prepared samples with a much smaller and more uniform particle size, due to the enhanced micromixing performance of MISR over the traditional STR, which is similar to the preparation of other composites with MISR and STR as reported previously.30,31 The structure with loose distribution of the nanocomposites obtained by MISR could provide more surface area and higher pore volume than those by STR, which is essential for achieving superior electrode performance as a supercapacitor material.
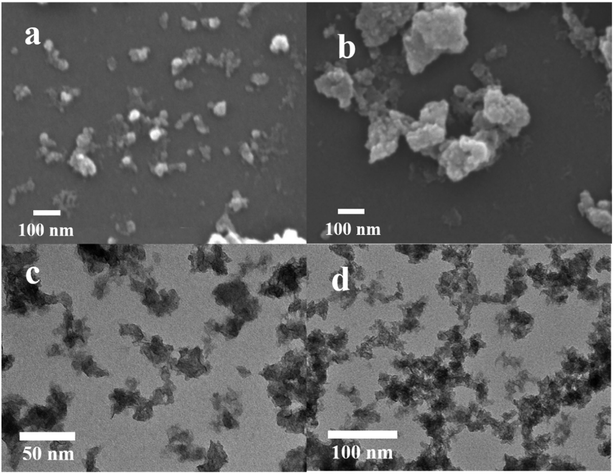 | ||
| Fig. 3 SEM images of Ni–Co–Al(OH)n prepared: (a) by MISR; (b) by STR; TEM images of Ni–Co–Al(OH)n prepared: (c) by MISR; (d) by STR. | ||
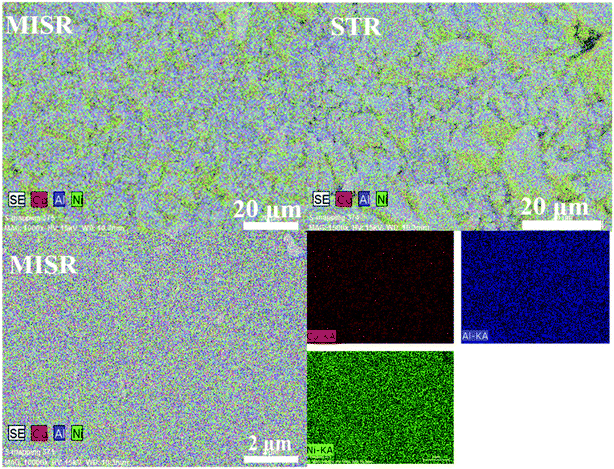
Fig. 4 and Table 1 show the element distributions of Ni, Co and Al of two different nanocomposite samples for each of the MISR route and STR route at the same feeding atomic ratio of the raw materials. It was found that the element distributions of the two MISR-prepared samples were similar and both close to the feeding ratio, while big difference of the element distributions between the two STR-prepared samples was observed. The EDS images of Fig. 5 displays the element distributions of Ni, Co and Al in the prepared Ni–Co–Al(OH)n nanocomposites visually. It also shows that the element distribution in nanocomposites prepared by MISR was more uniform than that of the STR-prepared samples, which agreed well with Fig. 4 and Table 1. The element distribution of the prepared nanocomposites is greatly affected by the reactor micromixing performance. Quicker micromixing can provide a more uniform environment for the crystal formation and growth, leading to a more uniform element distribution and more stable product quality, which is essential for the excellent performance of supercapacitor materials. Therefore, these results confirmed that MISR is a promising technology for preparing composites with high and stable quality due to its enhanced micromixing performance over STR.
| Atom (at%) | Feed | MISR | STR | ||
|---|---|---|---|---|---|
| Ni | 65.21 | 68.43 | 64.42 | 54.61 | 77.22 |
| Al | 26.09 | 24.19 | 26.65 | 29.44 | 16.37 |
| Co | 8.70 | 7.38 | 8.93 | 17.95 | 6.41 |
Fig. 6a presents XRD patterns of the nanocomposites prepared by MISR and STR, respectively. As shown in Fig. 6a, the XRD patterns of the two nanocomposites are quite different. The crystal structure of the nanocomposites prepared by MISR was similar to that of α-Ni(OH)2, with the (003), (006), (101), (110) and (113) crystal planes; while the crystal structure of the STR-prepared nanocomposites was mostly of β-Ni(OH)2, with the (001), (100), (101), (102) and (110) crystal planes. Due to the low micromixing efficiency of STR, the doped metal ions might not be inserted into the Ni(OH)2 crystal lattice uniformly during the precipitation reaction, leading to severe element aggregation within the crystal lattice, which is consistent with the element distributions in the EDS images. The element aggregation weakens the synergetic effects of metal ions. As a result, the STR doping route would not change the crystal form of Ni(OH)2 but only reduce the intensity of the characteristic peaks of Ni(OH)2, which confirms the importance of micromixing in the co-precipitation process again.
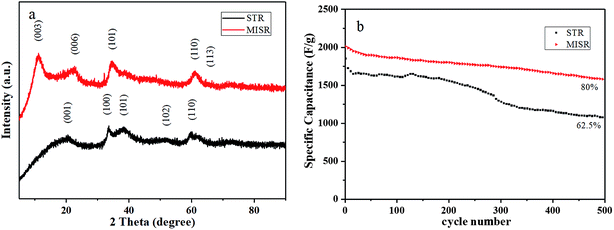 | ||
| Fig. 6 (a) XRD patterns and (b) cycle performance of Ni–Co–Al(OH)n nanocomposites prepared by MISR and STR, respectively. | ||
Fig. 6b presents the cycle performance of the nanocomposites prepared by MISR and STR, respectively. It shows that the initial specific capacitance of the two prepared nanocomposites under the same optimal doping conditions was 2010.8 and 1850.4 F g−1 at 1 A g−1 current density, respectively. After 500 cycles of charging and discharging, the specific capacity retention rate was 80% and 62.5%, respectively. Such results demonstrated that the modified nanocomposites prepared by MISR showed not only higher initial specific capacity, but also better cycle performance, owing to the more uniform distribution of metal ions obtained through the MISR route.
3.2 Structure and morphology of RGO
In order to improve the electrical conductivity and also extend the cycle life of the Ni–Co–Al(OH)n nanocomposites, reduced graphene oxide (RGO) was selected to further modify the nanocomposites by making use of the high conductivity and large specific surface area of RGO.RGO was firstly prepared by the Hummers' method,36 and the Raman spectra of RGO are presented in Fig. 7a. The Raman characteristic peaks of carbon materials mostly include two: peak G and peak D.37,38 Peak G around 1580 cm−1 reflects the in-plane bond-stretching motion of the pairs of C sp2 atoms (the E2g phonons) and peak D around 1360 cm−1 has a relationship with breathing modes of rings or K-point phonons of A1g symmetry.39,40 As shown in Fig. 7a, the characteristic peak D and peak G of the prepared RGO appeared more pronounced after the flake graphite was oxidized and then reduced. The ratio of ID/IG was 1.13, indicating that the disorder degree of the RGO prepared with the Hummers' method is much greater than that of graphite. Besides, the ID/IG ratio of RGO is also bigger than that of GO, indicating a decrease in the average size of sp2 domains upon reduction of GO,37 which is typical in GO and chemically reduced graphene.32
 | ||
| Fig. 7 (a) Raman spectra of graphite, GO and RGO; (b) XRD patterns of graphite, GO and RGO; (c) TEM image of RGO. | ||
XRD patterns of graphite, GO and RGO are presented in Fig. 7b. It shows that the peaks of RGO changed remarkably after reduction. There was a characteristic diffraction peak of graphene at 25° in the RGO XRD curve, and no (001) reflection of GO was observed, indicating that GO was effectively reduced into graphene.41
Fig. 7c presents TEM image of the prepared RGO. It shows that the RGO has some wrinkles and the lamellae are very thin like nearly transparent films, demonstrating that the RGO has a high specific surface area and can provide sufficient sites for the loading of metal hydroxide.42
3.3 Electrochemical properties and characterization of Ni–Co–Al(OH)n/RGO composites
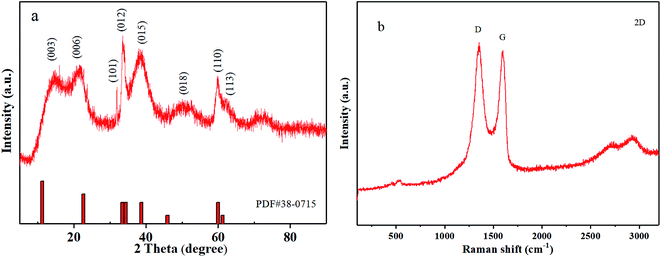
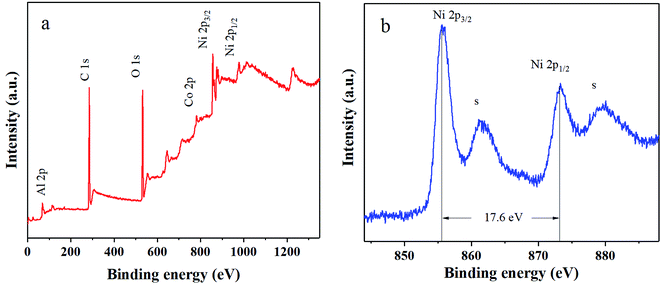
As discussed above, the stability of α-Ni(OH)2 has been successfully enhanced with the addition of Co and Al ions by MISR. However, the electrical conductivity and rate capability of the prepared nanocomposites still have room for improvement. Therefore, the prepared RGO was used to modify the Ni–Co–Al(OH)n nanocomposites within MISR. Fig. 8a presents the XRD pattern of the obtained Ni–Co–Al(OH)n/RGO. It shows that the α-Ni(OH)2 (JCDPS no. 38-0715) crystal structure was remained after the addition of RGO. There were no obvious characteristic diffraction peaks around 25° and 42°, which might be due to that the multilayers were prevented by the deposited metal ions14 so that the peaks for graphene could not be observed. This result implies the uniform loading of Ni(OH)2 on RGO within MISR may provide the possibility of full utilization of the large surface area and high conductivity of RGO. Fig. 8b presents the Raman spectra of Ni–Co–Al(OH)n/RGO. It shows that there were two prominent peaks at 1360 and 1580 cm−1, corresponding to peak D and peak G of RGO, respectively. ID/IG remained a high value of 1.05, indicating that the RGO after loading still kept a high degree of disorder, which was probably because that the stacking of graphene was effectively inhibited by the deposition of Ni(OH)2. In addition, there was a peak at 550 cm−1 belonging to metal hydride, confirming that Ni(OH)2 has been successfully loaded on RGO by MISR.To confirm the formation of Ni–Co–Al(OH)n/RGO, the surface electronic states of the as-obtained products were examined and analyzed by XPS, as demonstrated in Fig. 9. It shows that the composites were primarily composed of Ni, Co, Al, C and O elements. Two major peaks of Ni 2p centered around 855.7 and 873.3 eV with a spin-energy separation of 17.6 eV due to Ni 2p1/2 and Ni 2p3/2, which are characteristic Ni2+ peaks in Ni(OH)2. In addition, there were two extra peaks located at 879.5 and 861.6 eV, attributing to the satellite peaks of the major Ni 2p1/2 and Ni 2p3/2 peaks. The results are in good agreement with other literatures.17,43
Fig. 10 presents TEM and SEM images of the Ni–Co–Al(OH)n/RGO composites. Compared with the TEM image of RGO, the surface of the Ni–Co–Al(OH)n/RGO composites was obviously much rougher than that of RGO, which is owing to the loading of metal hydroxides on RGO. The uniform loading and covering of Ni–Co–Al(OH)n on the surface of RGO would benefit to the full use of large surface area and high conductivity of RGO. In addition, the close combination between Ni–Co–Al(OH)n composites and RGO would form electron superhighways,44 which allows charges transporting rapidly and efficiently and improves the overall electronic conductivity. In the high magnification SEM image (Fig. 10b), some unique folds of graphene could be easily observed and the uniform loading of Ni–Co–Al(OH)n nanoparticles on the surfaces of RGO was also clearly demonstrated. In addition, the uniformly dispersed nanoparticles might also play the role as spacers, which could prevent the agglomeration of RGO. Hence the mutual promotion between Ni–Co–Al(OH)n and RGO will remarkably modify the electrochemical performance of the materials as supercapacitors. The overall morphology and particle size distribution can also be observed clearly in the low magnification SEM image (Fig. 10c) of the composites.
Fig. 11a presents the CV curves at various scan rates of the Ni–Co–Al(OH)n/RGO composites. The CV diagram was similar to that of Ni–Co–Al(OH)n nanocomposites, showing strong redox peaks due to the Faradaic reaction. It can be seen that the CV curve at a scan rate of 2 mV s−1 of the material was highly symmetric, and ΔE was 199 mV, far less than 239 mV of Ni–Co–Al(OH)n, showing a great modification in reversibility. In addition, shifts of oxidation and reduction peaks can be observed with the increasing scan rate, which is owing to the resistance of the electrode.45
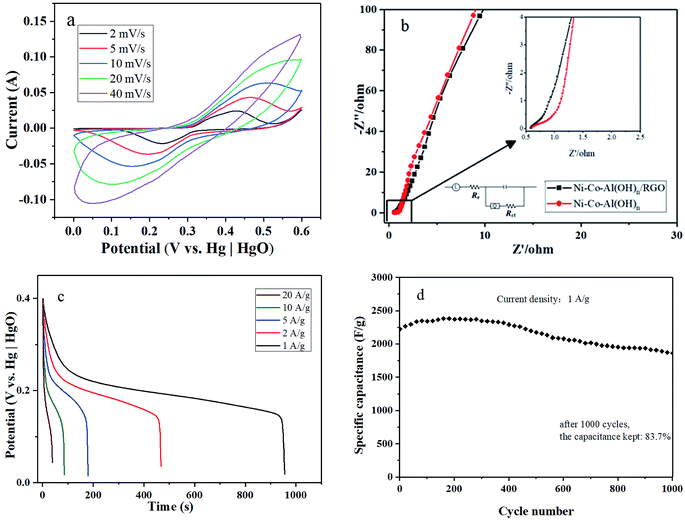 | ||
| Fig. 11 (a) CV curves at various scan rates, (b) EIS spectra, (c) constant current discharge diagram at different current densities, and (d) cycle performance of the Ni–Co–Al(OH)n/RGO composites. | ||
Fig. 11b shows the Nyquist plots for the Ni–Co–Al(OH)n and Ni–Co–Al(OH)n/RGO composites. The semicircle of the plot was slightly reduced after modification with RGO, indicating the decrease of Rct and the enhanced electrical conductivity of Ni(OH)2 by the addition of RGO due to the uniform loading process in MISR.
Fig. 11c illustrates that when the current density was 1, 2, 5, 10 and 20 A g−1, respectively, the initial specific capacitance of the Ni–Co–Al(OH)n/RGO composites was 2230.9, 2195.7, 2080.6, 1947.4 and 1687.5 F g−1, respectively. Compared to that at the current density of 1 A g−1, which was the highest one, the retention rate of the initial specific capacitance was 98.4%, 93.3%, 87.3%, and 75.6% for the current density of 2, 5, 10 and 20 A g−1, respectively. It demonstrates that the prepared Ni–Co–Al(OH)n/RGO composites can achieve a high rate capability, satisfying requirements for fast charging and discharging. The satisfying rate capability is due to the fast transmitting of ions through the 3D conductive network constructed by RGO, which demonstrates the uniform loading of metal hydroxides again. Compared with the 2010.8 F g−1 of Ni–Co–Al(OH)n at the current density of 1 A g−1, the specific capacitance of Ni–Co–Al(OH)n/RGO was successfully promoted with RGO due to its large surface area.
The cycle performance is a crucial parameter for the application of supercapacitors. Fig. 11d shows the cycle performance of Ni–Co–Al(OH)n/RGO composites. The initial specific capacitance was 2230.9 F g−1. After full activation for about 200 cycles, the maximum specific capacitance reached 2389.5 F g−1. After 1000 cycles, the capacity remained 83.7% of the initial specific capacitance. Table 2 compares the electrochemical performance of these Ni–Co–Al(OH)n/RGO composites prepared by the MISR technology with some similar materials prepared by different approaches as reported in literatures, which shows that the MISR-prepared samples have the highest initial specific capacitance but with a little poorer cycling stability. However, the MISR route processes several significant advantages over the other methods. Firstly, the MISR setup is very easy to build and operate. Secondly, it can run at a continuous manner rather than drop by drop adding to reduce the reaction time dramatically. Thirdly, MISR production capacity can be expanded by a numbering-up method with almost no negative scaling-up effects. Therefore, the MISR approach is a promising technology for the preparation of high performance nanocomposites through co-precipitation process with more uniform element distributions and more stable product quality.
| Materials | Methods | Electrolyte | Initial specific capacitance (F g−1) | Capacity retention rate |
|---|---|---|---|---|
| Ni–Co–Al(OH)n/RGO (this work) | MISR | 6 M KOH | 2389.9 (1 A g−1) | 83.7% (1 A g−1, 1000 cycles) |
| RGO/Ni1−xCoxAl42 | Situ self-reduction | 6 M KOH | 1902 (1 A g−1) | 98.6% (1 A g−1, 1000 cycles) |
| Al–Co–Ni(OH)2/GNS14 | Co-precipitation | 6 M KOH | 2257 (2 mV s−1) | 77% (2 mV s−1, 1000 cycles) |
| RGO/Ni0.75−xCoxAl0.25 (ref. 46) | Hydrothermal | 6 M KOH | 1544 (1 A g−1) | Almost unchanged (10 A g−1, 2000 cycles) |
| Ni/Co/Al-layered triple hydroxide@brominated graphene47 | Situ crystallization hydrothermal method | 6 M KOH | 1504 (20 A g−1) | 91% (20 A g−1, 2000 cycles) |
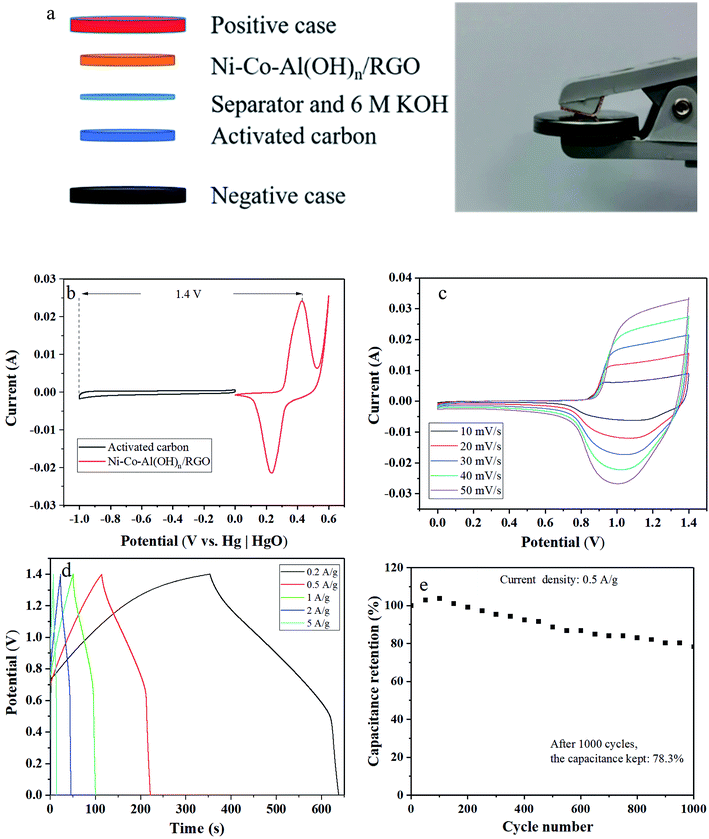
In addition, asymmetric supercapacitors (ASC) containing the prepared Ni–Co–Al(OH)n/RGO (as the positive electrode) was also constructed, as shown in Fig. 12a, to further evaluate its electrochemical performance. Fig. 12b demonstrates that the CV curves of the activated carbon negative electrode possessed the fine rectangular shape of the electronic double-layer capacitor behavior with the potential window ranged from 0 to −1 V. Therefore, the stable operating voltage window of the ASC device could be extended to 1.4 V (Fig. 12b). Fig. 12c showed the CV curves of the ASC device at various scan rates ranging from 10 to 50 mV s−1. The broad redox peaks indicates the battery-type capacitive properties of the ASC device arising from the Ni–Co–Al(OH)n/RGO electrode. The initial charge and discharge curves of the ASC device shown in Fig. 12d were almost symmetric to each other, which suggested a good capacitive characteristic. The initial calculated specific capacitances of the ASC device were 40.8, 38.3, 35.3, 32.6 and 25.4 F g−1 at the current densities of 0.2, 0.5, 1, 2, 5 A g−1, respectively, based on the total mass of the electrode materials. In addition, the ASC device exhibited a good electrochemical stability with 78.3% of the maximum capacitance retention after 1000 cycles at a current density of 0.5 A g−1 (Fig. 12e).
4. Conclusions
In this study, Ni–Co–Al(OH)n as electrode materials for supercapacitors was successfully prepared by co-precipitation with a novel micro-impinging stream reactor (MISR). MISR processes a much intensified micromixing performance over the traditional stirring reactors (STR) so that a more homogeneous nucleation environment for reaction will be provided. As a result, more stable structure and higher degree of crystallinity of the nanocomposites was obtained by MISR, and more uniform dispersion of Ni, Co, Al elements was achieved for the Co and Al co-doped Ni(OH)2 nanocomposites as well. In addition, RGO was used to further modify the nanocomposites through MISR. At the current density of 1 A g−1, the initial specific capacitance of the Ni–Co–Al(OH)n/RGO composites was 2230.9 F g−1, and the maximum specific capacitance could reach 2389.5 F g−1 after full activation. After 1000 cycles, the capacity could remain 83.7%. Under the current density of 20 A g−1, the specific capacitance of Ni–Co–Al(OH)n/RGO could reach 1687.5 F g−1, and the retention rate was 75.6%, indicating an excellent rate capability. The work demonstrated that the MISR technology would be a promising synthesis route for nanocomposites as electrode materials for supercapacitors.Conflicts of interest
There are no conflicts of interest to declare.Acknowledgements
The authors gratefully acknowledge the financial support provided by National Natural Science Foundation of China (No. 21576012) and the National Key Research and Development Program of China (2017YFB0307202).References
- B. Li, M. B. Zheng, H. G. Xue and H. Pang, Inorg. Chem. Front., 2016, 3, 175–202 RSC.
- H.-Y. Sun, L.-Y. Lin, Y.-Y. Huang and W.-L. Hong, Electrochim. Acta, 2018, 281, 692–699 CrossRef CAS.
- C. Hao, S. S. Zhou, J. J. Wang, X. H. Wang, H. W. Gao and C. W. Ge, Ind. Eng. Chem. Res., 2018, 57, 2517–2525 CrossRef CAS.
- T. Nguyen, M. Boudard, M. João Carmezim and M. Fátima Montemor, Energy, 2017, 126, 208–216 CrossRef CAS.
- J. Xu, Y. Z. Dong, J. Y. Cao, B. Guo, W. C. Wang and Z. D. Chen, Electrochim. Acta, 2013, 114, 76–82 CrossRef CAS.
- J.-W. Lang, L.-B. Kong, W.-J. Wu, M. Liu, Y.-C. Luo and L. Kang, J. Solid State Electrochem., 2009, 13, 333–340 CrossRef CAS.
- X. Ge, C. D. Gu, Z. Y. Yin, X. L. Wang, J. P. Tu and J. Li, Nano Energy, 2016, 20, 185–193 CrossRef CAS.
- H. B. Zhang, H. S. Liu, X. J. Cao, S. J. Li and C. C. Sun, Mater. Chem. Phys., 2003, 79, 37–42 CrossRef CAS.
- H. L. Wang, H. S. Casalongue, Y. Y. Liang and H. J. Dai, J. Am. Chem. Soc., 2010, 132, 7472–7477 CrossRef CAS PubMed.
- S. Huang, Y. H. Jin and M. Q. Jia, Electrochim. Acta, 2013, 95, 139–145 CrossRef CAS.
- A. K. Das, R. K. Layek, N. H. Kim, D. Jung and J. H. Lee, Nanoscale, 2014, 6, 10657–10665 RSC.
- H. Chen, J. M. Wang, T. Pan, Y. L. Zhao, J. Q. Zhang and C. N. Cao, J. Power Sources, 2005, 143, 243–255 CrossRef CAS.
- D.-L. Fang, Z.-D. Chen, X. Liu, Z.-F. Wu and C.-H. Zheng, Electrochim. Acta, 2012, 81, 321–329 CrossRef CAS.
- X. Chen, C. L. Long, C. P. Lin, T. Wei, J. Yan, L. L. Jiang and Z. J. Fan, Electrochim. Acta, 2014, 137, 352–358 CrossRef CAS.
- S. D. Min, C. J. Zhao, Z. M. Zhang, K. Wang, G. R. Chen, X. Z. Qian and Z. P. Guo, RSC Adv., 2015, 5, 62571–62576 RSC.
- G. X. Hu, C. X. Li and H. Gong, J. Power Sources, 2010, 195, 6977–6981 CrossRef CAS.
- J. Yan, W. Sun, T. Wei, Q. Zhang, Z. Fan and F. Wei, J. Mater. Chem., 2012, 22, 11494–11502 RSC.
- J. W. Lee, T. Ahn, D. Soundararajan, J. M. Ko and J. D. Kim, Chem. Commun., 2011, 47, 6305–6307 RSC.
- Z.-S. Wu, G. M. Zhou, L.-C. Yin, W. C. Ren, F. Li and H.-M. Cheng, Nano Energy, 2012, 1, 107–131 CrossRef CAS.
- J. Zhang, L.-B. Kong, J.-J. Cai, H. Li, Y.-C. Luo and L. Kang, Microporous Mesoporous Mater., 2010, 132, 154–162 CrossRef CAS.
- J. Chang, H. Xu, J. Sun and L. Gao, J. Mater. Chem., 2012, 22, 11146–11150 RSC.
- S. N. Tiruneh, B. K. Kang, Q. T. Ngoc and D. H. Yoon, RSC Adv., 2016, 6, 4764–4769 RSC.
- H. C. Schwarzer and W. Peukert, AIChE J., 2004, 50, 3234–3247 CrossRef CAS.
- M.-C. Fournier, L. Falk and J. Villermaux, Chem. Eng. Sci., 1996, 51, 5187–5192 CrossRef CAS.
- A. Castedo, I. Uriz, L. Soler, L. M. Gandía and J. Llorca, Appl. Catal., B, 2017, 203, 210–217 CrossRef CAS.
- C. Dong, J. S. Zhang, K. Wang and G. S. Luo, Chem. Eng. J., 2014, 253, 8–15 CrossRef CAS.
- L. Yang, M. J. Nieves-Remacha and K. F. Jensen, Chem. Eng. Sci., 2017, 169, 106–116 CrossRef CAS.
- K. Te, Y. Le, J.-X. Wang, G.-W. Chu, J.-F. Chen and L. Shao, Mater. Lett., 2010, 64, 1717–1719 CrossRef.
- H. Wang, H. Nakamura, M. Uehara, M. Miyazaki and H. Maeda, Chem. Commun., 2002, 1, 1462–1463 RSC.
- Q.-C. Zhang, K.-P. Cheng, L.-X. Wen, K. Guo and J.-F. Chen, RSC Adv., 2016, 6, 33611–33621 RSC.
- Z. W. Liu, L. Guo, T. H. Huang, L. X. Wen and J. F. Chen, Chem. Eng. Sci., 2014, 119, 124–133 CrossRef CAS.
- C. L. Bao, L. Song, W. Y. Xing, B. H. Yuan, C. A. Wilkie, J. L. Huang, Y. Q. Guo and Y. Hu, J. Mater. Chem., 2012, 22, 6088–6096 RSC.
- L. Zhang, S. Song and H. Shi, J. Alloys Compd., 2018, 751, 69–79 CrossRef CAS.
- T. Yan, R. Y. Li, L. Zhou, C. Y. Ma and Z. J. Li, Electrochim. Acta, 2015, 176, 1153–1164 CrossRef CAS.
- Y. X. Xu, Z. Y. Lin, X. Q. Huang, Y. Wang, Y. Huang and X. F. Duan, Adv. Mater., 2013, 25, 5779–5784 CrossRef CAS PubMed.
- W. S. Hummers and R. E. Offeman, J. Am. Chem. Soc., 1958, 80, 1339 CrossRef CAS.
- S. Stankovich, D. A. Dikin, R. D. Piner, K. A. Kohlhaas, A. Kleinhammes, Y. Y. Jia, Y. Wu, S. T. Nguyen and R. S. Ruoff, Carbon, 2007, 45, 1558–1565 CrossRef CAS.
- C. Russo and A. Ciajolo, Combust. Flame, 2015, 162, 2431–2441 CrossRef CAS.
- J. Yan, T. Wei, B. Shao, Z. J. Fan, W. Z. Qian, M. L. Zhang and F. Wei, Carbon, 2010, 48, 487–493 CrossRef CAS.
- A. C. Ferrari and J. Robertson, Phys. Rev. B: Condens. Matter Mater. Phys., 2000, 61, 14095–14107 CrossRef CAS.
- X. C. Chen, C. Y. Hou, Q. H. Zhang, Y. G. Li and H. Z. Wang, Mater. Sci. Eng., B, 2012, 177, 1067–1072 CrossRef CAS.
- J. Xu, S. L. Gai, F. He, N. Niu, P. Gao, Y. J. Chen and P. P. Yang, Dalton Trans., 2014, 43, 11667–11675 RSC.
- J. Yang, C. Yu, X. M. Fan, Z. Ling, J. S. Qiu and Y. Gogotsi, J. Mater. Chem. A, 2013, 1, 1963–1968 RSC.
- D. W. Wang, F. Li, M. Liu, G. Q. Lu and H. M. Cheng, Angew. Chem., Int. Ed., 2008, 120, 379–382 CrossRef.
- V. Gupta, S. Gupta and N. Miura, J. Power Sources, 2009, 189, 1292–1295 CrossRef CAS.
- C. H. Zheng, T. Yao, T. R. Xu, H. A. Wang, P. F. Huang, Y. Yan and D. L. Fang, J. Alloys Compd., 2016, 678, 93–101 CrossRef CAS.
- M. Jabeen, M. Ishaq, W. Song, L. Xu and Q. Deng, RSC Adv., 2017, 7, 46553–46565 RSC.
| This journal is © The Royal Society of Chemistry 2019 |

