 Open Access Article
Cerium(III) complexes with azolyl-substituted thiophenolate ligands: synthesis, structure and red luminescence†
Vasily A. Ilichev *a,
Liubov I. Silantyevaa,
Ivan D. Grishinb,
Anton V. Rozhkov
 c,
Roman V. Rumyantcev
 a,
Georgy K. Fukina and
Mikhail N. Bochkarev
 ab
ab
aG. A. Razuvaev Institute of Organometallic Chemistry of Russian Academy of Sciences, Tropinina 49, 603950 Nizhny Novgorod, Russian Federation. E-mail: ilichev@iomc.ras.ru
bNizhny Novgorod State University, Gagarina Avenue 23/2, 603950 Nizhny Novgorod, Russian Federation
cSaint Petersburg State University, Universitetskaya Emb. 7/9, 199034 St Petersburg, Russian Federation
First published on 5th August 2019
Abstract
In order to obtain molecular Ce(III) complexes which emit red light by f–d transitions the azolyl-substituted thiophenolates were used as the ligands. The thiophenolate Ce(III) complexes were synthesized by the reaction of Ce[N(SiMe3)2]3 with respective thiophenols 2-(2′-mercaptophenyl)benzimidazole (H(NSN)), 2-(2′-mercaptophenyl)benzoxazole (H(OSN)) and 2-(2′-mercaptophenyl)benzothiazole (H(SSN)) in DME media. The structures of the benzimidazolate (Ce(NSN)3(DME)) and benzothiazolate (Ce(SSN)3(DME)) derivatives were determined by X-ray analysis which revealed that the cerium ion in the molecules is coordinated by one DME and three anionic thiophenolate ligands. The lanthanum complex La(OSN)3(DME) has been synthesized similarly and structurally characterized. It was found that the solids of Ce(SSN)3(DME) and Ce(OSN)3(DME) exhibit a broad band photoluminescence peaking at 620 nm which disappears upon solvatation. With an example of OSN derivatives it was proposed that this behaviour is caused by the blue shift of the f–d transition of Ce3+ ions.
Introduction
Molecular lanthanide(III) complexes exhibiting bright and efficient photoluminescence (PL) have been successfully applied in various modern technologies including lasers and fiber amplifiers,1 light emitting diodes and solar cells,2–7 bioassays and medicine.8–11 Among these compounds, the main attention was focused on the derivatives of lanthanides that emit in the visible or near infrared region due to the intraconfigurational transitions inside the 4f subshell, while the field of luminescent complexes that have other emitting configurations was almost undeveloped. First of all, this relates to f–d luminescent Ce(III) derivatives. This ion is a key component of a huge number of inorganic phosphors,12,13 but the overall number of its luminescent molecular species is very limited to date.A new surge of interest in luminescent trivalent cerium complexes is directly associated with the discovery of photoredox catalytic activity of these compounds in some reactions.14–16 The most active photoredox-catalytic complexes are luminescent derivatives of ruthenium and iridium, which have long-lived triplet excited states.17–20 In the case of Ce(III) complexes the existence of relatively long-lived excited states is attributed to 5d states of the cerium ion. The energies of 5d states, in contradistinction to 4f states, are extremely sensitive to ligand environment. It is known that some cerium complexes with silylamide,21 guanidinate, aryloxide,15 alkoxide,22 cyclopentadienyl,23–25 tripodal,26,27 carboxylate,28,29 bipyridyl,30 Schiff-base31 and crown-ether32 ligands exhibit the PL in the range from near ultraviolet (UV) to yellow colour. To the best of our knowledge the red luminescent Ce(III) complexes are still unknown.
It was showed by Dorenboos that the energy and wavelength of f–d transitions of the Ce(III) ions doped in inorganic hosts varies in the range from near UV to red light.33–35 Noticeable, that the lowest energies and maximal wavelengths of these transitions are observed in sulphide matrices. Therefore, it is reasonable to expect that the Ce(III) molecular complexes with organosulphide ligands could emit red light. Such compounds can be used as red luminophores as well as potential photoredox catalysts which efficiently harvest the visible light. In present work we have used a set of azolyl-substituted thiophenolates to be applied as ligands for the design of red luminescent Ce(III) molecular complexes.
Results and discussion
In order form novel cerium complexes we have used the thiophenols which contain in o-position the heterocyclic substituents – 2-benzimidazolyl (H(NSN)), 2-benzoxazolyl (H(OSN)) and 2-benzothiazolyl (H(SSN)). The reaction of the cerium silylamide complex with respective thiophenols readily proceeds at room temperature in DME media (Scheme 1) resulting in a formation of targeted complexes in good yields. In case of benzimidazolyl-substituted thiophenol (H(NSN)) an ultrasonic treatment was applied because of poor solubility of H(NSN) in DME. The Ce(III) complexes were isolated as air-sensitive orange or yellow-orange powders.In cases of benzimidazolyl and benzothiazolyl derivatives the X-ray suitable crystals of the cerium complexes were grown. However, all the attempts to obtain such crystals for the benzoxazolyl derivative were failed. In order to study the structure by X-rays the lanthanum analogue of OSN-based complex was synthesized similarly to Scheme 1 but with the use of La[N(SiMe3)2]3 as the rare-earth precursor. The X-ray suitable crystals of this lanthanum complex were successfully grown. According to X-ray data, the lanthanide complexes have a similar molecular structure. These complexes are monomers in which the Ln3+ cations are coordinated by three SSN (Ce(SSN)3(DME)), NSN (Ce(NSN)3(DME)) and OSN (La(OSN)3(DME)) ligands and one neutral molecular DME (Fig. 1). Thus, the coordination number of each lanthanide atom in these complexes is eight, and the coordination environment of Ln3+ is a distorted square antiprism (Fig. 2).
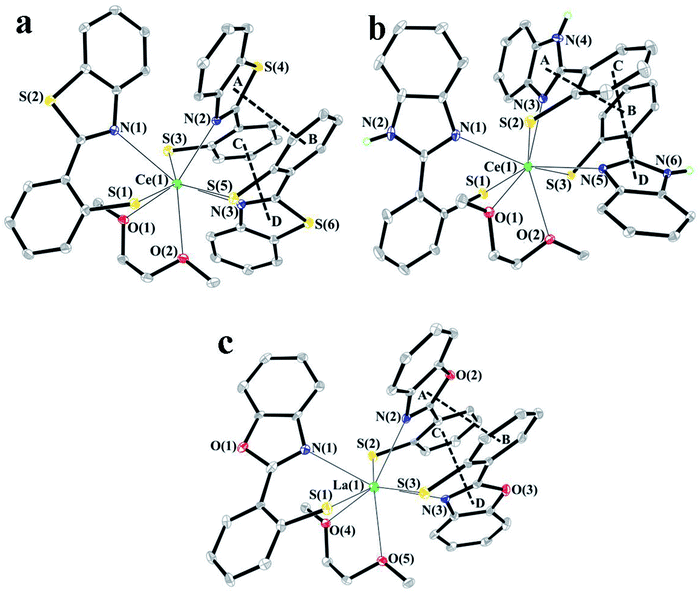 | ||
| Fig. 1 Molecular structures of complexes Ce(SSN)3(DME) (a), Ce(NSN)3(DME) (b) and La(OSN)3(DME) (c). The probability ellipsoids are drawn at the 30% level. The hydrogen atoms are omitted for clarity. | ||
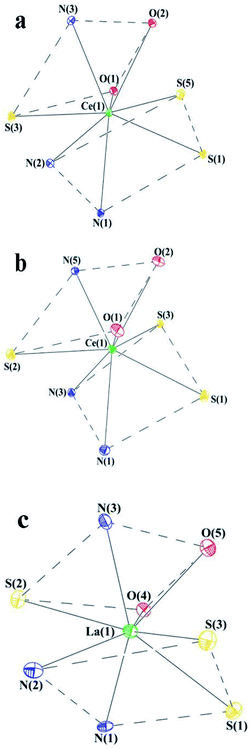 | ||
| Fig. 2 The coordination environment of Ln in complexes Ce(SSN)3(DME) (a), Ce(NSN)3(DME) (b) and La(OSN)3(DME) (c). | ||
The S(1)S(5)N(1)N(2) and S(3)N(3)O(1)O(2) planes in Ce(SSN)3(DME), the S(1)S(3)N(1)N(3) and S(2)N(5)O(1)O(2) planes in Ce(NSN)3(DME) and the S(1)S(3)N(1)N(2) and S(2)N(3)O(4)O(5) ones in La(OSN)3(DME) are located almost parallel to each other. The dihedral angles between these planes are 8.96°, 8.50° and 11.64° in Ce(SSN)3(DME), Ce(NSN)3(DME) and La(OSN)3(DME), respectively.
The NSN, SSN and OSN ligands in these complexes are largely non-flat. Such geometry is characteristic of related ligands.36 The dihedral angles between the thiophenolate and benzothiazolyl, benzimidazolyl and benzoxazolyl fragments are 38.93 ÷ 56.13°, 40.29 ÷ 49.77° and 21.06 ÷ 25.69°, respectively.
It is interesting to note that the NSN and OSN ligands in Ce(SSN)3(DME) and La(OSN)3(DME) complexes are arranged in such a way that the planes of the five-membered heterocycle of one ligand (A, D) and the phenyl ring of the thiophenolate fragment of the second ligand (B, C) are almost parallel to each other (the dihedral angles are 15.62° (A⋯B), 27.02° (C⋯D) and 16.21° (A⋯B), 12.20 (C⋯D) in Ce(SSN)3(DME) and La(OSN)3(DME), respectively), and the distances between the centers of these fragments are 3.376 Å (A⋯B), 3.639 Å (C⋯D) and 3.583 Å (A⋯B), 3.528 Å (C⋯D) in Ce(SSN)3(DME) and La(OSN)3(DME), respectively (Fig. 1a and c). These geometrical parameters indicate the presence of intramolecular π⋯π interactions in both complexes.37 Unlike them, in the Ce(NSN)3(DME) complex, the corresponding values are 3.712 Å and 25.52° (A⋯B), 3.891 Å and 35.62° (C⋯D) (Fig. 1b). Such values slightly exceed the geometric criterion for the presence of pi–pi interactions.37
The Ce–S distances in Ce(SSN)3(DME) and Ce(NSN)3(DME) lie in the range of 2.8588(8) ÷ 2.9330(11) Å and these values are in a good agreement both with each other and with previously published cerium complexes containing thiophenolate fragments.38–40 The coordination bonds of Ce–N and Ce–O in complexes Ce(SSN)3(DME) and Ce(NSN)3(DME) vary over a wider range (2.549(4) ÷ 2.891(3) Å (Ce–N) and 2.568(2) ÷ 2.661(2) Å (Ce–O)) (Table 2S†). All Ln–X (X = S, N, O) distances (Table 2S†) in complex La(OSN)3(DME) are also in the range of values characteristic for lanthanum complexes.40–42
Despite the large number of aromatic systems in the SSN, NSN and OSN ligands, intermolecular π⋯π interactions in all structurally characterized complexes are not detected. It is interesting to note that the molecules of Ce(NSN)3(DME) form a dimeric pair in a crystal (Fig. 3). The ligands of neighboring molecules are arranged in such a way that the distance between the nitrogen atom of one ligand and the sulfur atom of the other ligand is 3.375 Å. This value indicates the existence of the N–H⋯S interaction.43
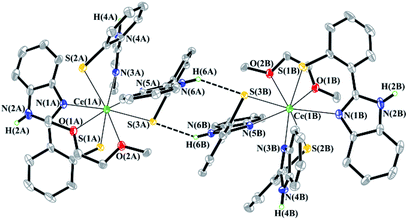 | ||
| Fig. 3 Fragment of crystal packing of the Ce(NSN)3(DME) complex. Some hydrogen atoms and non-coordinated DME molecules are omitted for clarity. | ||
The structure of Ce(OSN)3(DME) was not determined by X-rays but the elemental analysis, similarity of the MALDI-TOF spectra of this compound and its lanthanum counterpart and identity of IR spectra of the La(III) and Ce(III) complexes indicate that the complex Ce(OSN)3(DME) has a similar structure to its lanthanum analogue. The most intensive signals in mass-spectra of complexes Ce(SSN)3(DME), La(OSN)3(DME) recorded in positive mode (Fig. 1Sa†) are ones corresponding to ML2+ and M2L5+ species. The molecules of DME do not present in the structures of the formed ions indicating its weak coordination. It should be mentioned that the mass spectrum of La(OSN)3(DME) is similar to the spectrum of another complexes and contains the same peaks corroborating the identical structure of the complex. The spectra of these compounds recorded in negative mode depicted on the figure of 1Sb† are also similar and contain identical signals of MxLy− – type ions. The presence of additional sulfur and oxygen atoms may be result of partial decomposition of DME or ligand under laser impact.
The complexes Ce(OSN)3(DME) and Ce(SSN)3(DME) in the solid state exhibit PL in the red range of visible light (Fig. 4). While the complex Ce(NSN)3(DME) is non-luminescent. The broad shape of the spectra, the location in the red region of the spectrum and the independence of the emission intensities from the temperature indicate the f–d nature of the PL. The absence of such PL in the case of benzimidazole derivative is caused, apparently, by quenching effect of hydrogen bounds.
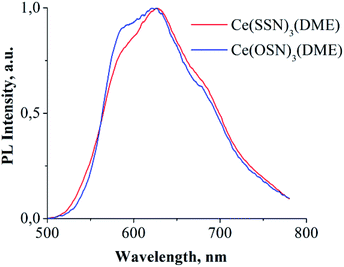 | ||
| Fig. 4 PL spectra of solid complexes Ce(OSN)3(DME) and Ce(SSN)3(DME). Excitation – 405 nm laser diode. | ||
But in the DME solutions the observed red PL of the Ce(III) complexes disappears. In order to understand this feature, it is reasonable to use the lanthanum derivatives as reference complexes. A comparison of the optical properties of lanthanum and cerium complexes has been provided with an example of OSN ligand. The complex La(OSN)3(DME) exhibit a broad band PL peaked at 500–530 nm in solid state (Fig. 2S†). The PL behavior in DME solution of both (La and Ce) complexes is similar to their Gd counterpart.36 As one can see from a photo of the samples of La(OSN)3(DME) and Ce(OSN)3(DME) the compounds have different color (Fig. 5).
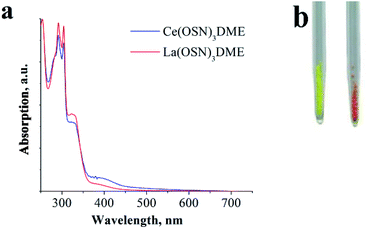 | ||
| Fig. 5 DME solution absorption spectra (a) and photo (b) of complexes Ce(OSN)3(DME) (right) and La(OSN)3(DME) (left). | ||
This difference, evidently, is caused by the f–d absorption of Ce3+ ions. Orange color corresponds to the absorption in the bluish-green region at about 500 nm. However, in the DME solutions the absorption spectra of both compounds are almost identical, no absorption at 500 nm is observed for the cerium complex. Apparently, this behavior is caused by a shifting of the f–d absorption towards blue region upon solvatation. It is known that the energy of f–d transitions in free Ce3+ ion corresponds to UV region and it can be only red shifted by the crystal field of the ligands.33 The most powerful shifters are sulphides. Consequently, the solvatation and dissociation of cerium organosulphide complexes may result only in blue shift of the f–d transitions. It is important to note that typical values of absorption coefficients range at hundreds of L mol−1 cm−1 (ref. 44) for f–d transitions of Ce3+ while absorption of the substituted thiophenolates exceed thousands of L mol−1 cm−1.36 As a result of overlapping of these absorption bands the orange color of Ce(OSN)3(DME) virtually disappears in the solution.
Experimental
General procedures
All manipulations were carried out under vacuum using standard Schlenk techniques or in an argon glove box (H2O < 0.1 ppm; O2 < 1 ppm). The reagents including thiosalicylic acid, polyphosphoric acid, o-aminophenol, o-aminothiophenol, o-phenylenediamine, lanthanum and cerium amides Ln[N(SiMe3)2]3 (95–98% purity) were purchased from commercial sources and used as received. The solvents 1,2-dimetoxyethane (DME), hexane and toluene were dried by refluxing over sodium for 12 h. The C, H, N and S elemental analyses were performed on a Euro EA 3000 elemental analyser. The lanthanide contended was analysed by complexometric titration. IR spectra were obtained on a PerkinElmer 577 spectrometer and recorded from 4000 to 450 cm−1 as a Nujol mull on KBr plates. Photoluminescence of solid samples was excited with a 100 mW, 405 nm laser diode or 365 nm UV diode and detected in a region 365–1000 nm with Ocean Optics USB2000 spectrometer. The spectroscopic measurements of the compounds were performed in DME solution using a 1 cm vacuumed quartz cell. The absorption spectra were recorded with a PerkinElmer Lambda 25 UV/VIS spectrometer from 200 to 800 nm. The PL and PLE spectra were recorded with a PerkinElmer LS 55 fluorescence spectrometer. MALDI-TOF mass-spectra of the compounds were obtained on a Bruker Microflex LT spectrometer equipped with a nitrogen laser (337 nm). During experiments 0.5 mg of solid samples were deposited on a stainless steel target plate, rubbed over the surface by using a spatula and analysed.Synthetic procedures
X-ray
The X-ray diffraction data for the complexes were collected on a Bruker AXS SMART APEX (Ce(SSN)3(DME)) and Oxford Xcalibur Eos (La(OSN)3(DME), Ce(NSN)3(DME)) diffractometers (Mo-Kα radiation, ω-scan technique, λ = 0.71073 Å). The intensity data were integrated by SAINT (Ce(SSN)3(DME))45 and CrysAlisPro (La(OSN)3(DME), Ce(NSN)3(DME))46 programs. SADABS (Ce(SSN)3(DME))47 and SCALE3 ABSPACK (La(OSN)3(DME), Ce(NSN)3(DME))48 programs were used to perform absorption corrections. The La(OSN)3(DME) complex was solved by direct method and Ce(NSN)3(DME) and Ce(SSN)3(DME) complexes were solves by dual method.49 All structures were refined on Fhkl2 using SHELXTL package.50 All non-hydrogen atoms were refined anisotropically. All hydrogen atoms were placed in calculated positions and were refined in the riding model (Uiso(H) = 1.5Ueq(C) for CH3-groups and Uiso(H) = 1.2Ueq(C, N) for other groups). The main crystallographic data and structure refinement details for Ce(NSN)3(DME), La(OSN)3(DME), Ce(SSN)3(DME) are presented in Table 1S.† The asymmetric unit of Ce(SSN)3(DME) contains a solvate molecule of DME whereas the crystals of Ce(NSN)3(DME) contain 1.25 disordered molecules of DME per one complex molecule.CCDC 1907215 (La(OSN)3(DME)), 1907216 (Ce(NSN)3(DME)) and 1907217 (Ce(SSN)3(DME)) contain the supplementary crystallographic data.†
Conclusions
In summary, we have synthesized a set of novel Ce(III) complexes with azolyl-substituted thiophenolate ligands – 2-(2′-mercaptophenyl)benzimidazole (NSN(H)), 2-(2′-mercaptophenyl)benzoxazole (OSN(H)) and 2-(2′-mercaptophenyl)benzothiazole (SSN(H)). The lanthanum complex with OSN ligand has been also synthesized to be used as a reference compound. The data of X-ray and MALDI-TOF revealed that all the synthesized complexes are monomeric species which contain three anionic thiophenolate ligands and one coordinated neutral DME molecule. It was found that Ce(OSN)3(DME) and Ce(SSN)3(DME) in the solid state exhibit the PL peaked at 620 nm. This is the maximal wavelength ever observed for f–d luminescent Ce(III) molecular complexes. But no red PL is observed in the solutions of these complexes that is caused, apparently, by the blue shift of the f–d transitions. We believe that synthesis of novel molecular Ce(III) f–d luminophores with long-lived and low-energy 5d states would become a modern challenge in coordination chemistry because these compounds will be useful as red or infrared emitters and can replace noble metal derivatives in photoredox catalyzed processes.Conflicts of interest
There are no conflicts to declare.Acknowledgements
This work was supported by the Russian Foundation for Basic Research (project no. 18-33-20103). The structure of the complexes was defined in the Framework of the Russian State Assignment (Theme 45.6, Reg. N AAAA-A19-119011690055-0). The work was performed using the instrumental base of the Analytical Center of the G. A. Razuvaev Institute of Organometallic Chemistry, Russian Academy of Sciences. The analysis of complexes using MALDI mass spectrometry was done in accordance with the task of Ministry of Science and Higher Education of Russia (task 4.5706.2017/B).References
- I. Hernandez and W. P. Gillin, Handbook on the Physics and Chemistry of Rare Earths, 2015, vol. 47, p. 1 Search PubMed.
- J.-C. Bünzli, Handbook on the Physics and Chemistry of Rare Earths, 2016, vol. 50, p. 141 Search PubMed.
- E. M. Chan, Chem. Soc. Rev., 2015, 44, 1653 RSC.
- L. Wang, Z. Zhao, C. Wei, H. Wei, Z. Liu, Z. Bian and C. Huang, Adv. Opt. Mater., 2019, 7, 1801256 CrossRef.
- A. P. Pushkarev and M. N. Bochkarev, Russ. Chem. Rev., 2016, 85, 1338 CrossRef CAS.
- M. A. Katkova and M. N. Bochkarev, Dalton Trans., 2010, 39, 6599 RSC.
- J.-C. Bünzli and A.-S. Chauvin, Handbook on the Physics and Chemistry of Rare Earths, 2014, vol. 44, p. 169 Search PubMed.
- J.-C. G. Bunzli, Eur. J. Inorg. Chem., 2017, 5058 CrossRef.
- H. Li, C. Xie, R. Lan, S. Zha, C.-F. Chan, W.-Y. Wong, K.-L. Ho, B. D. Chan, Y. Luo, J.-X. Zhang, G.-L. Law, W. C. S. Tai, J.-C. G. Bünzli and K.-L. Wong, J. Med. Chem., 2017, 60, 8923 CrossRef CAS PubMed.
- J.-C. G. Bünzli, J. Lumin., 2016, 170, 866 CrossRef.
- J.-C. G. Bunzli, Luminescence Bioimaging with Lanthanide Complexes, Luminescence of Lanthanide Ions in Coordination Compounds and Nanomaterials, Wiley, 1st edn, 2014, vol. 4, p. 125 Search PubMed.
- X. Qin, X. Liu, W. Huang, M. Bettinelli and X. Liu, Chem. Rev., 2017, 117, 4488 CrossRef CAS PubMed.
- G. Li, Y. Tian, Y. Zhaoa and J. Lin, Chem. Soc. Rev., 2015, 44, 8688 RSC.
- Y. Qiao and E. J. Schelter, Acc. Chem. Res., 2018, 51, 2926 CrossRef CAS PubMed.
- H. Yin, P. J. Carroll, B. C. Manor, J. M. Anna and E. J. Schelter, J. Am. Chem. Soc., 2016, 138, 5984 CrossRef CAS PubMed.
- J.-J. Guo, A. Hu, Y. Chen, J. Sun, H. Tang and Z. Zuo, Angew. Chem., Int. Ed., 2016, 55, 15319 CrossRef CAS PubMed.
- R. Konduri, H. Ye, F. M. MacDonnell, S. Serroni, S. Campagna and K. Rajeshwar, Angew. Chem., 2002, 114, 3317 CrossRef.
- S. H. Lee, J. H. Kim and C. B. Park, Chem.–Eur. J., 2013, 19, 4392 CrossRef CAS PubMed.
- N. A. Till, R. T. Smith and D. W. C. MacMillan, J. Am. Chem. Soc., 2018, 140, 5701 CrossRef CAS PubMed.
- H. Xiang, J. Cheng, X. Ma, X. Zhou and J. Chruma, Chem. Soc. Rev., 2013, 42, 6128 RSC.
- H. Yin, P. J. Carroll and E. J. Schelter, J. Am. Chem. Soc., 2015, 137, 9234 CrossRef CAS PubMed.
- D. M. Kuzyaev, T. V. Balashova, M. E. Burin, G. K. Fukin, R. V. Rumyantcev, A. P. Pushkarev, V. A. Ilichev, I. D. Grishin, D. L. Vorozhtsov and M. N. Bochkarev, Dalton Trans., 2016, 45, 3464 RSC.
- P. N. Hazin, C. Lakshminarayan, L. S. Brinen, J. L. Knee, J. W. Bruno, W. E. Streib and K. Folting, Inorg. Chem., 1988, 27, 1393 CrossRef CAS.
- P. N. Hazin, J. W. Bruno and H. G. Brittain, Organometallics, 1987, 6, 913 CrossRef CAS.
- M. D. Rausch, K. J. Moriarty, J. L. Atwood, J. A. Weeks, W. E. Hunter and H. G. Brittain, Organometallics, 1986, 5, 1281 CrossRef CAS.
- X.-L. Zheng, Y. Liu, M. Pan, X.-Q. Lu, J.-Y. Zhang, C.-Y. Zhao, Y.-X. Tong and C.-Y. Su, Angew. Chem., Int. Ed., 2007, 46, 7399 CrossRef CAS PubMed.
- A. Baschieri, A. Mazzanti, S. Stagni and L. Sambri, Eur. J. Inorg. Chem., 2013, 2432 CrossRef CAS.
- M. E. Azenha, H. D. Burrows, S. M. Fonseca, M. L. Ramos, J. Rovisco, J. S. de Melo, A. J. F. N. Sobrala and K. Kogejb, New J. Chem., 2008, 32, 1531 RSC.
- H. Kunkely and A. Vogler, J. Photochem. Photobiol., A, 2002, 151, 45 CrossRef CAS.
- P. R. Matthes and K. Müller-Buschbaum, Z. Anorg. Allg. Chem., 2014, 640, 2847 CrossRef CAS.
- Y. Jiao, J. Wang, P. Wu, L. Zhao, C. He, J. Zhang and C. Duan, Chem.–Eur. J., 2014, 20, 2224 CrossRef CAS PubMed.
- T. Yu, W. Su, W. Li, R. Hua, B. Chu and B. Li, Solid-State Electron., 2007, 51, 894 CrossRef CAS.
- P. Dorenbos, Phys. Rev. B: Condens. Matter Mater. Phys., 2000, 62, 15640 CrossRef CAS.
- P. Dorenbos, Phys. Rev. B: Condens. Matter Mater. Phys., 2000, 62, 15650 CrossRef CAS.
- P. Dorenbos, Phys. Rev. B: Condens. Matter Mater. Phys., 2001, 64, 125117-1 CrossRef.
- V. A. Ilichev, A. V. Rozhkov, R. V. Rumyantcev, G. K. Fukin, I. D. Grishin, A. V. Dmitriev, D. A. Lypenko, E. I. Maltsev, A. N. Yablonskiy, B. A. Andreev and M. N. Bochkarev, Dalton Trans., 2017, 46, 3041 RSC.
- C. Janiak, J. Chem. Soc., Dalton Trans., 2000, 3885 RSC.
- M. Roger, N. Barros, T. Arliguie, P. Thuery, L. Maron and M. Ephritikhine, J. Am. Chem. Soc., 2006, 128, 8790 CrossRef CAS PubMed.
- J. H. Melman, C. Rohde, T. J. Emge and J. G. Brennan, Inorg. Chem., 2002, 41, 28 CrossRef CAS PubMed.
- S. Bannerjee, T. J. Emge and J. G. Brennan, Inorg. Chem., 2000, 43, 6307 CrossRef PubMed.
- T. Lathion, L. Guenee, C. Besnard, A. Bousseksou and C. Piguet, Chem.–Eur. J., 2018, 24, 16873 CrossRef CAS PubMed.
- G. B. Deacon, P. C. Junk and A. Urbatsch, Eur. J. Inorg. Chem., 2011, 3592 CrossRef CAS.
- J. Donohue, J. Mol. Biol., 1969, 45, 231 CrossRef CAS PubMed.
- A. Vogler and H. Kunkley, Inorg. Chim. Acta, 2006, 359, 4130 CrossRef CAS.
- SAINT, Data Reduction and Correction Program v. 8.27B, Bruker AXS, Madison, Wisconsin, USA, 2014 Search PubMed.
- Data Collection, Reduction and Correction Program. Version 1.171.37.35, CrysAlisPro – Software Package, Agilent Technologies, 2012 Search PubMed.
- L. Krause, R. Herbst-Irmer, G. M. Sheldrick and D. Stalke, J. Appl. Crystallogr., 2015, 48, 3 CrossRef CAS PubMed.
- R. C. Clark and J. S. Reid, Acta Crystallogr., Sect. A: Found. Crystallogr., 1995, 51, 887 CrossRef.
- G. M. Sheldrick, Acta Crystallogr., Sect. A: Found. Adv., 2015, 71, 3 CrossRef PubMed.
- G. M. Sheldrick, Acta Crystallogr., Sect. C: Struct. Chem., 2015, 71, 3 Search PubMed.
Footnote |
| † Electronic supplementary information (ESI) available: MALDI-TOF spectra, details of crystallographic, collection and refinement data for Ce(SSN)3(DME), Ce(NSN)3(DME) and La(OSN)3(DME); PL spectra of solid La(OSN)3(DME). CCDC 1907215–1907217. For ESI and crystallographic data in CIF or other electronic format see DOI: 10.1039/c9ra03199e |
| This journal is © The Royal Society of Chemistry 2019 |

