 Open Access Article
Enzymatic characterization and molecular mechanism of a novel aspartokinase mutant M372I/T379W from Corynebacterium pekinense†
Yunna Gaoab,
Caijing Hanab,
Chunlei Liuab,
Ji Wangab,
Lan Zhaoab,
Li Fang*ab and
Weihong Min *ab
*ab
aCollege of Food Science and Engineering, Jilin Agricultural University, Changchun 130118, China. E-mail: fangli@jlau.edu.cn; Tel: +86-138-4486-2551
bNational Engineering Laboratory of Wheat and Corn Deep Processing, Changchun 130118, China. E-mail: minwh2000@jlau.edu.cn; Tel: +86-139-4491-9697
First published on 9th July 2019
Abstract
A novel aspartokinase mutant M372I/T379W from Corynebacterium pekinense was constructed by using site-directed mutagenesis. The enzyme was then purified, characterized, and its molecular mechanism was comprehensively analyzed. Compared with wild-type AK, the catalytic activity of M372I/T379W AK was 16.51 fold higher and the optimum temperature increased from 28 to 35 °C. The thermostability of M372I/T379W AK was significantly improved. Microscale thermophoresis analysis indicated that M372I/T379W AK not only weakened the inhibitory effect of Lys, but also had stronger binding force with Asp. Molecular dynamics simulation showed that mutations M372I and T379W could regulate the activity of CpAK through affecting the flexibility of Asp and ATP binding pocket residues and the hydrogen bond between CpAK and Asp. In addition, mutations could affect the relative position of protein domains. The width of the Asp binding pocket entrance gate Arg169–Ala60 of M372I/T379W AK was greater than that in wild-type AK and the CpAK switched from T-state to R-state, which promoted the binding of the enzyme to Asp and improving the catalytic efficiency of this enzyme. These results explain the molecular mechanism of M372I/T379W AK, which will greatly facilitate the rational design of more aspartokinase mutants, with have potential applications in aspartic acid metabolism.
1 Introduction
Aspartokinase (AK) participates in the first step of the biosynthesis of the aspartate family of amino acids in microorganisms and plants.1 AK transfers the phosphate group of ATP to aspartate and is responsible for the formation of aspartyl-4-phosphate,2 which is ultimately converted into lysine, threonine, isoleucine, and methionine.3 In addition, AK is an allosteric enzyme that can flexibly control the carbon flow depending on the accumulation of metabolites and can adjust the reaction speed of the whole biosynthetic pathway, thus having a major impact on the accumulation of the aspartate family of amino acid products.4Due to the complex regulatory mechanism of the aspartic acid metabolism pathway, AK has different regulatory modes in different organisms. According to reported AK crystal structures, AKs can be categorized into single-function AKs (AKI, AKII, and AKIII) and dual-function AKs (AK-HSDHI and AK-HSDHII).2,5 For instance, Arabidopsis thaliana has five forms of AK, among which AKI is inhibited by lysine and S-adenosylmethionine synergistically, AKII and AKIII are inhibited only by lysine,6,7 and the other two are bifunctional AKs that bind to high-serine dehydrogenase (HSDH) and are inhibited by leucine and threonine.8,9 Similarly, Escherichia coli possesses three AKs.10,11 AK-HSDHI is inhibited by threonine, whereas AKIII is inhibited by lysine. The inhibitor Lys binds only to the regulatory domain of AKIII, thereby triggering conformational changes in the catalytic domain to induce unlocking of the AKII latch, allowing rotation of the catalytic domain and blocking ATP binding by concomitant movement of the loop.12 Moreover, CgAK (AKII from Corynebacterium glutamicum) and PaAK (AKII from Pseudomonas aeruginosa) are inhibited by Lys plus Thr in a synergistic manner.13–15 Furthermore, Chang-Cheng Li et al. found that the residues involved in inter-domain or intra-domain mobility in PaAK, which were crucial for Lys to suppress signal transmission, and selected key residues related to domain movement.16
The aspartate family of amino acids are widely used in food, feed, cosmetics, pharmaceuticals, etc.17,18 Currently, they are mainly produced by protein hydrolysis, chemical synthesis and microbial fermentation.19 Protein hydrolysis and chemical synthesis will gradually be eliminated due to their serious environmental pollution, high risk and high resource cost.20 Microbial fermentation, has become the main method of aspartate amino acid production.21 However, in order to produce target metabolites, the removal of allosteric inhibition and improvement of enzymatic activity have become great challenges in the design and optimization of metabolic pathways.22 In this study, we found that AK from Corynebacterium pekinense (CpAK), which was a novel monomer allozyme and shares 98.78% homology with CgAK, and we built a model of CpAK based on the structure of CgAK (PDB ID: 3aaw).23 At the same time, we identified the key residues affecting the enzyme activity, weakened the feedback inhibition of Lys on the monomeric CpAK, and revealed the mechanism of action of mutations M372I and T379W, which enhance the catalytic activity of aspartokinase, by molecular dynamics (MD) simulation.24
2 Results and discussion
The structure for ligands binding to CpAK
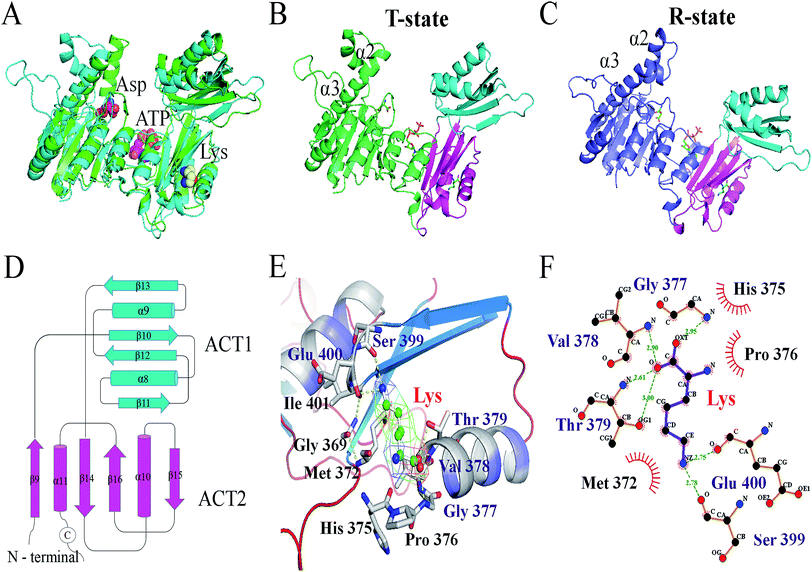
The X-ray structure of AK from Corynebacterium glutamicum (PDB ID: 3aaw) was selected as template for homology modelling of CpAK, since they share about 98.78% sequence identity (Fig. S1†). There was almost no difference between the C chain of CgAK and CpAK, except some flexible coil structures (Fig. 1A). In addition, Ramachandran plot was used to further verify the accuracy of the structure.25,26 The plot showed that more than 97% of residues were located in spatially allowed region (Fig. S2†). The whole protein was shown by cartoon. The catalytic domain was green, containing ATP and Asp binding sites (Fig. 1B), while the inhibitor Lys was in the pink regulatory domain.27 As can be seen in Fig. 1D, the key characteristics of the regulatory domain were conservative ACT domains with a βαββαβ fold.28,29 The interaction of the two ACT regions was mediated by the anti-parallel association of β-2 in each ACT region, which plays a regulatory role in binding with small ligands. Furthermore, homologous sequencing (Fig. S1†) and protein structure analysis showed that M372 and T379 were highly conserved and located around the binding site of Lys inhibitor, which were the key sites to maintain the stable binding of Lys (Fig. 1E and F). Therefore, molecular modification was carried out to weaken the binding force between binding pocket and Lys, so as to improve the enzymatic properties of AK.Construction of mutant strains and purification of protein
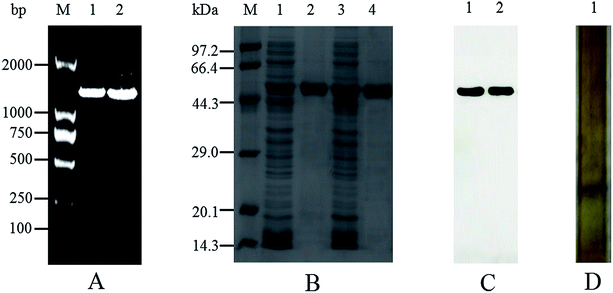
The mutant of M372I/T379W AK with significantly increased enzymatic activity was obtained by site-directed mutagenesis and high-throughput screening. As shown in Fig. 2A, the results of PCR electrophoresis showed that wild-type AK (WT AK) and M372I/T379W AK had obvious bands between 1000 and 2000 bp, which were consistent with the length of CpAK (1317 bp), and proved that AK was successfully introduced into E. coli strain BL21 (DE3). There was only one clear band in Native-PAGE of WT AK purified protein, which confirmed that the undenatured CpAK was a monomer structure (Fig. 2D). Meanwhile, the purified protein was confirmed as single band with molecular weight of 48 kDa by SDS-PAGE (Fig. 2B) and verified by Western blot (Fig. 2C) using His-Tag (27 × 108) Mouse mAb, which indicated the expression of AK protein was successful.Steady-state kinetics and enzymatic properties
The kinetic parameters of WT and mutant AK are shown in Table 1. Compared with WT AK, the corresponding Hill coefficients' n value of M372I/T379W AK was lower: 2.39 versus 1.27, indicating that the mutation reduced the positive synergy of AK. After the mutations were introduced, the catalytic activity (kcat/KAspm) of M372I/T379W AK was 33.19 s−1 mM−1, which was 16.51 fold (p < 0.05) higher than that of WT AK. The Km value is equal to the substrate concentration at half the maximum rate of enzymatic reaction. Smaller the Km value, greater the affinity between the enzyme and the substrate. In view of the standard deviation of Km values, the KAspm value of WT AK and M372I/T379W AK did not change significantly (Table 1), indicating that the affinity of the enzyme towards aspartate was not affected by the mutations. However, the KATPm value of M372I/T379W AK was lower when ATP was used as a substrate at different concentrations; 5.16 mM versus 7.93 mM for WT AK, indicating that the enzyme–substrate (AK–ATP) affinity was slightly increased after the mutations.| Enzymes (AK) | Substrates | Vmax (U mg−1 min−1) | Km (mM) | kcat/Km (s−1 mM−1) | n |
|---|---|---|---|---|---|
| WT | Asp | 2.78 ± 1.24 | 6.18 ± 0.48 | 2.01 ± 0.62 | 2.39 ± 0.79 |
| M372I/T379W | Asp | 49.16 ± 1.55 | 5.77 ± 1.71 | 33.19 ± 1.83 | 1.27 ± 1.58 |
| WT | ATP | 17.26 ± 0.30 | 7.93 ± 0.92 | 14.96 ± 1.49 | 2.13 ± 0.66 |
| M372I/T379W | ATP | 23.39 ± 1.87 | 5.16 ± 0.75 | 17.28 ± 1.64 | 2.07 ± 0.82 |
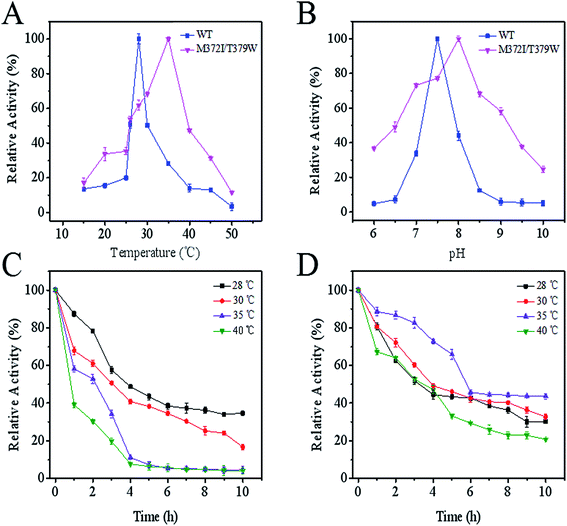
As seen in Fig. 3A, compared with the optimum temperature of WT AK (28 °C), the optimum temperature of M372I/T379W AK rose to 35 °C, being suggestive of good heat resistance. Although the optimum pH of M372I/T379W AK was slightly lower than that of WT AK, the tolerance range of M372I/T379W AK to pH was wider (Fig. 3B); this property is conducive to application to late fermentation processes. The results of the assay showed that M372I/T379W AK had good thermostability. According to Fig. 3C and D, the half-life of WT AK at 28 °C was 3.8 h. However, WT AK was almost inactive at 35 °C and 40 °C after 4 h. WT AK exhibited temperature sensitivity with a narrow range of relative activity. The half-life of M372/T379W AK was 5.7 h at 35 °C. In addition, the relative enzyme activity of M372/T379W AK remained above 40% at 35 °C after 10 h, suggesting that the mutations significantly enhanced the thermostability of AK.
When the concentration was 5 and 10 mM, WT AK was significantly inhibited by Lys and Thr, reaching 60.47% and 74.81%, respectively (Table 2). The inhibitory mechanism of the novel CpAK was similar to that of CgAK, which was synergistically inhibited by metabolites Lys and Thr.23 The relative enzyme activity of M372I/T379W AK was slightly higher in the presence of 0.2 mM Lys, 76.07% versus 74.31% for WT AK. However, in the presence of 5 and 10 mM Lys, the relative activity of M372I/T379W AK reached 97.40% and 120.15%, respectively, indicating that its activity was significantly affected and that the feedback inhibition of Lys was weakened or relieved. Moreover, activation of M372I/T379W AK improved with increase in Lys concentration, showing a dose-dependent relationship.
| Enzyme | Relative activity (%) | |||||||
|---|---|---|---|---|---|---|---|---|
| inhibitors | WT AK | M372I/T379AK | ||||||
| 0.2 mM | 1 mM | 5 mM | 10 mM | 0.2 mM | 1 mM | 5 mM | 10 mM | |
| Control | 100 | 100 | 100 | 100 | 100 | 100 | 100 | 100 |
| Lys | 74.31 ± 0.24 | 57.43 ± 2.17 | 48.61 ± 2.43 | 40.72 ± 0.69 | 76.07 ± 0.89 | 88.93 ± 1.74 | 97.40 ± 0.32 | 120.15 ± 1.82 |
| Thr | 78.57 ± 0.19 | 74.94 ± 2.55 | 68.55 ± 1.84 | 61.33 ± 1.77 | 77.79 ± 2.04 | 79.54 ± 2.66 | 78.44 ± 2.53 | 80.08 ± 2.60 |
| Lys + Thr | 72.60 ± 0.22 | 56.25 ± 1.88 | 39.53 ± 1.06 | 25.19 ± 0.60 | 83.52 ± 1.27 | 83.36 ± 0.13 | 86.22 ± 2.62 | 103.67 ± 2.56 |
Specific binding of AK to the substrate Asp and inhibitor Lys
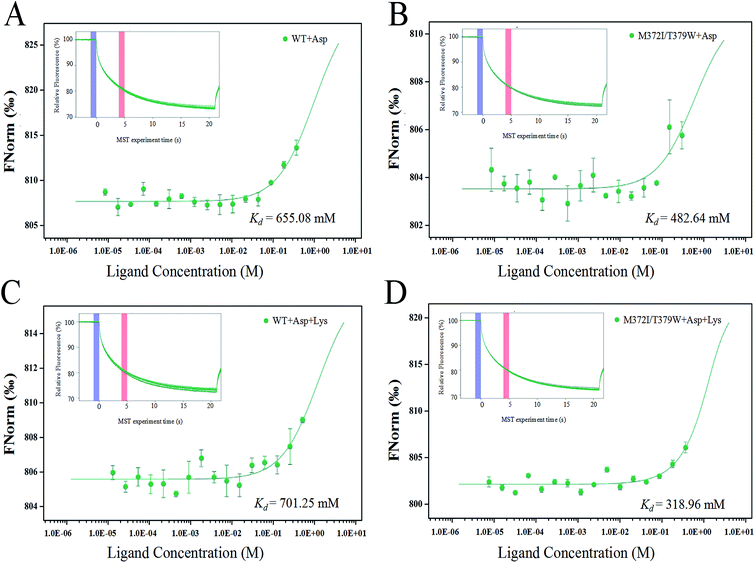
The binding of AK to the substrate Asp and inhibitor Lys was analyzed by the MST technique. The smaller the dissociation constant Kd, the stronger is the binding affinity between molecules. Fig. 4 indicates that when the infrared laser was turned on at 5 s, the fluorescence intensity decreased with the increase in temperature. Different concentrations of ligands bound to AK, resulting in different fluorescence intensity curves. A normalized MST time trajectory was obtained at 20 s. The regular shape of the curve indicated that no dimer aggregation occurred.30 Compared with WT AK, Kd of M372I/T379W AK for the substrate Asp decreased (from 655.08 to 482.64 mM; Fig. 4A and B), indicating that the binding affinity of AK for the substrate Asp significantly strengthened after the mutations. Moreover, in the presence of Lys, Kd of WT AK for Asp was 701.25 mM, whereas that of M372I/T379W AK was 318.96 mM (Fig. 4C and D). The results showed that the binding of WT AK to the substrate Asp was obviously inhibited by the inhibitor Lys; in contrast, mutations M372I and T379W not only weakened the inhibitory effect of Lys but also promoted the binding of AK to Asp.Structural stability of the two complex systems
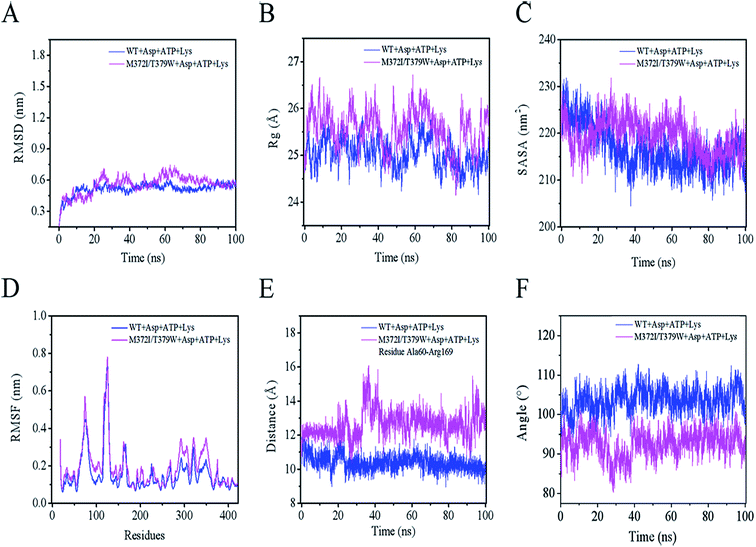
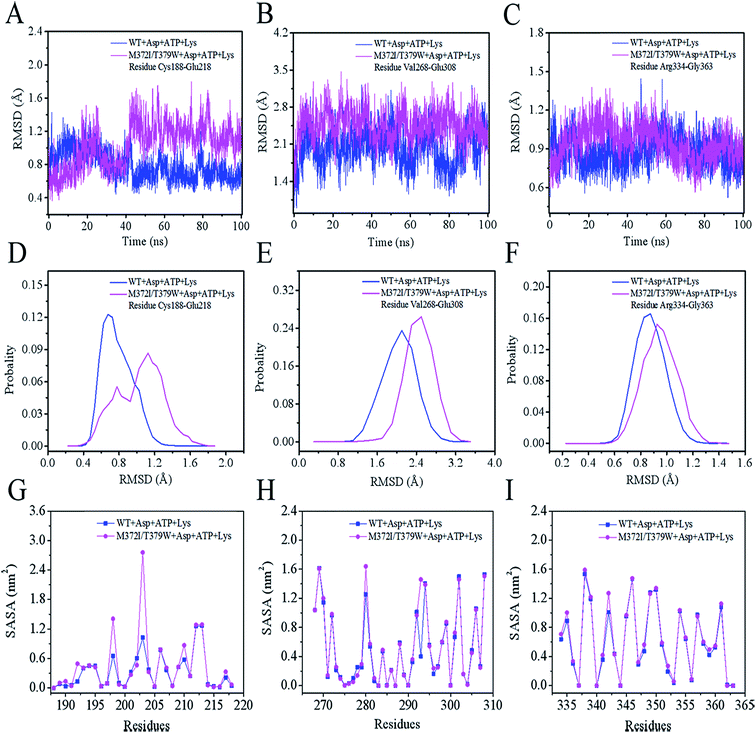
As presented in Fig. 5A, the mean root mean square deviations (RMSD) of the Cα atom backbone of the two complexes (WT AK + Asp + ATP + Lys or M372I/T379W AK + Asp + ATP + Lys) were 0.52 and 0.63 nm, respectively, reaching a first plateau after 18 ns.31 These data indicated that the structures of the two complexes reached a state of relative equilibrium during the simulation. The radius of gyration (Rg) of a protein is calculated from the volume and shape of the protein, thus reflecting flexibility of the whole conformation.32 Rg of the WT AK complex converged to 24.93 Å, whereas that of the M372I/T379W AK complex converged to 26.04 Å in Fig. 5B. The results suggest that the flexibility of the whole structure of the complex involving M372I/T379W AK was greater than that of WT AK. The reason may be that the mutation caused a rearrangement of protein structure. The solvent accessible surface area (SASA) is a key parameter for describing hydrophilicity of proteins and plays spatial conformation and conformational flexibility of proteins.33 A sharp decrease from 230 to 213 nm2 in the WT AK complex was observed in the plot during the first 35 ns, and then the value of SASA remained stable at 213.78 nm2 (Fig. 5C). In contrast, the simulation trajectories of the state of the M372I/T379W AK complex appeared to be well equilibrated, with an average SASA of 220.35 nm2 within 100 ns.Mutations M372I and T379W caused significant changes in Rg and SASA of the protein, and these alterations may have increased the number of hydrophilic residues on the AK surface and enhanced its affinity for the solvent. All the above analyses explain why the mutant is superior to the WT in terms of protein integrity, whereas the root mean square fluctuation (RMSF) can help to analyze the relative fluctuation degree of a single amino acid residue during the whole simulation process.34 As illustrated in Fig. 5D, the residue cluster Cys188–Glu218, Val268–Glu308, and Arg334–Gly363 of M372I/T379W AK were more flexible because their RMSF values were greater than those of WT AK.
Conformational changes induced by the mutations M372I and T379W
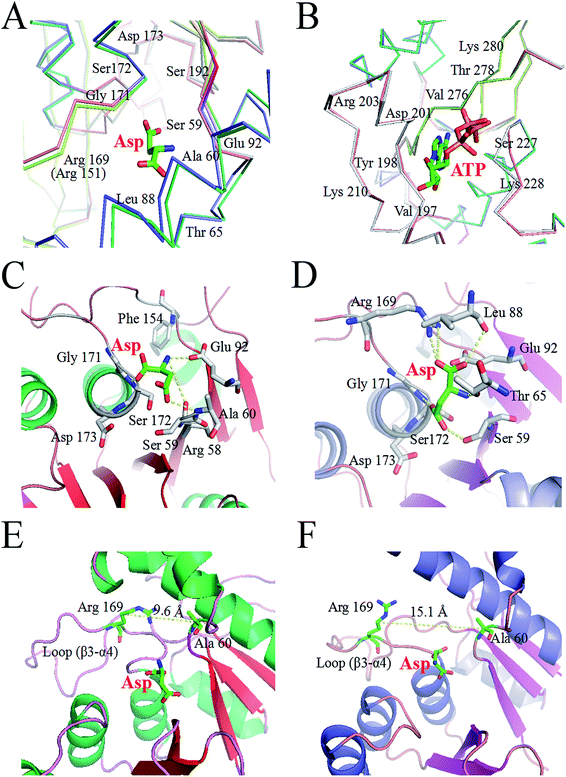
We analyzed the changes in RMSD and SASA of residue cluster Cys188–Glu218, Val268–Glu308, and Arg334–Gly363 in AK during 100 ns simulation. As depicted in Fig. 6A–F, RMSDs of residues Cys188–Glu218 in WT AK complexes were mainly distributed within 0.73 Å, whereas the RMSD values of residues Cys188–Glu218 in M372I/T379W AK complexes were mostly 1.20 Å, indicating that the mutations M372I and T379W significantly improved the RMSD values of ATP and Asp binding pocket residues Cys188–Glu218; this change will promote their binding to ATP and Asp. Similarly, the RMSD fluctuation ranges of WT and M372I/T379W AK residues Val268–Glu308 and Arg334–Gly363 were relatively stable. The SASAs (Fig. 6G–I) of amino acid residues on the surface of WT AK and M372I/T379W AK complexes were determined to evaluate the difference in the folding degree of key residues exposed to solvents. It was found that the area contribution of residues Ser192, Tyr198, Arg203, Lys210, and Lys280 in M372I/T379W AK were much greater than that in WT AK, indicating that the flexibility of these four residues in M372I/T379W AK system was higher. Moreover, by comparing the spatial structure of CpAK and CgAK, we found that Tyr198, Arg203, Lys210, and Lys280 were the key residues of ATP binding pocket (Fig. 7B). The change of residues Tyr198, Arg203, Lys210, and Lys280 enhanced the binding activity of ATP and CpAK.The hydrogen-bonding force plays an important role in this complex system.35 Table 3 summarizes the hydrogen bond occupancy by Asp and AK during the 100 ns MD simulation. The hydrogen bond ratio of residues Arg169-HH22 and Asp-O2 in WT AK was 28.19%, whereas that in M372I/T379W AK was 62.74%, which means a change from a weak hydrogen bond to a strong one. At the same time, the mutations M372I and T379W increased the hydrogen bond share of residues Ser192-HG and Asp-O4 from 17.01% to 37.59%, and the hydrogen bond occupancy of Glu92-OE1 and Asp-H2 from 4.79% to 32.20%. Especially at 95 ns, hydrogen bonding between M372I/T379W AK and Asp was enhanced significantly (Fig. 7C and D). These findings revealed that the mutations changed the flexibility of amino acid residues, thus enhancing the binding of the enzyme to Asp. We concluded that Glu92, Arg169, Ser172 and Ser192 in Asp binding pocket are the key residues affecting the catalytic activity of AK (Fig. 7A).
| Hydrogen bonds occupancies | WT AK | M372I/T379W AK | |
|---|---|---|---|
| Donor | Accepter | ||
| Arg169-HH22 | Asp-O2 | 28.19% | 62.74% |
| Arg169-HH12 | Asp-O2 | 17.05% | 25.66% |
| Arg169-HH12 | Asp-O1 | 4.93% | 18.08% |
| Arg169-HH22 | Asp-O1 | 16.16% | |
| Ser172-HG | Asp-O3 | 55.50% | 64.82% |
| Ser172-H | Asp-O2 | 48.13% | 56.52% |
| Asp-H2 | Glu92-OE1 | 4.79% | 32.20% |
| Asp-H | Glu92-OE2 | 36.72% | 48.48% |
| Ser192-HG | Asp-O4 | 17.01% | 37.59% |
| Thr65-H | Asp-O3 | 6.18% | 12.93% |
The Lys binding kept the enzyme in the inactive CgAK T-state via the association of β5(α) with β1(β), where bidentate ionic bonds of Arg151–Glu74 prevented Asp from binding.23 Nonetheless, no binding of Arg151 to Glu74 was observed in the active CgAK R-state, which meant that Arg151 was the key residue for the switching between CgAK R- and T-states. In this study, Arg169 from CpAK corresponded to Arg151 from CgAK by spatial comparison (Fig. 7A). Arg169 turned out to perform dual functions: participation in catalytic activity through nucleophilic action of the hydrogen bond and the role of an entrance gate of the substrate Asp together with Ala60. The average distance between Ala60 and Arg169 of WT AK was 10.2 Å during the 100 ns simulation, whereas that in M372I/T379W AK fluctuated considerably at 23, 35, and 95 ns, with an average distance of 14.2 Å (Fig. 5E). Especially at 35 ns, the distance between Ala60 and Arg169 was the largest and increased from 9.6 to 15.1 Å (Fig. 7E and F), so that the steric hindrance disappeared in the M372I/T379W AK. It was easier to enter for the substrate Asp, and the reaction rate accelerated due to the structural rearrangement of Asp binding pocket residues.
By comparing the structures of WT AK and M372I/T379W AK complexes, we found that the overall structure of M372I/T379W AK was different during the simulation (Fig. 1B and C). The difference in conformation seems to be related to the mutations M372I and T379W. Their importance lies in breaking or formation of some hydrogen bonds and resultant conformational changes in active pockets, which play an important part in the regulation of the enzymatic activity of AK. The angle between the residue clusters Leu288–Gly363 and Lys364–Ala418 in M372I/T379W AK rotated considerably from 107.9° to 93.1° (Fig. 5F) and the structure of catalytic domain α2 and α3 changed after mutation, which induced the transition of AK from an inactive T-state to an active R-state (Fig. 1B and C). Upon transition to the R-state, an accompanying movement of a loop (β3–α4) were evident in the catalytic domain of M372I/T379W AK (Fig. 7E and F), which enabled Asp to be unlocked from a latch, thus enhancing the binding activity of Asp to AK.12,23
3 Experimental
Materials
Recombinant plasmid pET-28a-AK was provided by our laboratory. A plasmid extraction kit was purchased from Takara Bio Inc. (Dalian, China). The primers were synthesized by Sangon Biotech Co., Ltd. (Shanghai, China). The anti-His tag (27 × 108) mouse monoclonal antibody was purchased from Cell Signaling Technology (Danvers, MA, USA), and Escherichia coli strain BL21 (DE3) from Novagen (Madison, WI, USA). Monolith™ Protein Labeling Kit RED-NHS and Capillaries for Monolith NT115 were bought from NanoTemper Technology Co., Ltd. (Beijing, China).Construction of mutant strains
By means of recombinant plasmid pET-28a-AK, the sites M372 and T379 were subjected to saturated site-directed mutagenesis by PCR with primers M372N and T379N (M372N-F:5′-GTAACACCT GGGTGAGACTGNNNGCCCGCACCC-3′, M372N-R: 5′-CTCG TGGGTGCGGGCNNNCAGTCTCACCC-3′; T379N-F: 5′-CATG AACTCTGCNNNAACACCTGGGTGAGACTG-3′, T379N-R: 5′-CACCCAGGTGTTNNNGCAGAGTTCATGGAAGC-3). The PCR products were transferred into 1 mL E. coli strain BL21 (DE3). After the cells were incubated at 37 °C, 165 rpm for 2 h, centrifuged at 8000 rpm for 2 min, discarding 800 μL supernatant, gently blowing suspended bacteria and, and then cultured in Luria–Bertani solid medium. Strains expressing mutant AK with high enzymatic activity were obtained by high-throughput screening.36Protein expression and purification
E. coli strains expressing the wild-type (WT) or mutant AK were cultured in the Luria–Bertani medium until absorbance at 600 nm (A600) reached 0.7.37 The strains were induced with 100 μL of 1 mM isopropyl-β-D-1-thiogalactopyranoside (IPTG) at 30 °C for 12 h.38 Next, the bacteria were resuspended in PBS (pH 7.4) and lysed by ultrasonication. The pellet was discarded after centrifugation at 10![[thin space (1/6-em)]](https://www.rsc.org/images/entities/char_2009.gif) 000×g for 15 min, and then the supernatant was loaded onto a nickel ion affinity column.16 The purified enzyme was eluted from the column with PBS (pH 7.4) supplemented with 500 mM imidazole.
000×g for 15 min, and then the supernatant was loaded onto a nickel ion affinity column.16 The purified enzyme was eluted from the column with PBS (pH 7.4) supplemented with 500 mM imidazole.
Analysis of Native-PAGE, SDS-PAGE and western blot
Native-PAGE was prepared with 12% to 5% polyacrylamide mixture.39 After electrophoresis, gels were stained with a fast silver stain kit. SDS-PAGE was performed using a polyacrylamide gel consisting of 12% (w/v) split gel and 5% (w/v) stacked gel. For Western blot analysis, the proteins in the 12% (w/v) resolving gel of SDS-PAGE were transferred onto a PVDF membrane, which was blocked with 5% nonfat dry milk for 1 h and then incubated overnight with His-Tag (27 × 108) Mouse mAb.AK activity and steady-state kinetics assays
The enzymatic activity was expressed as U = 1000 × A540, and the specific activity was expressed as the number of stable aspartyl-hydroxamate micromoles generated per minute per milligram of protein. The 1 mL enzymatic-activity assay system consisted of 800 mM KCl, 10 mM Asp, 100 mM Tris–HCl (pH 7.4), 800 mM NH3·H2O, 10.4 mM ATP, 10 mM β-mercaptoethanol, and 1.6 mM MgSO4, with the addition of 50 μL (0.013085 mg) the purified enzyme. After incubation at 28 °C and 130 rpm for 30 min, the reaction was terminated by an equal volume of 5% (w/v) FeCl3 solution.1,40 The kinetic parameters of AK were determined with different substrates at the following concentrations of Asp: 0.5, 1, 3, 5, 7, 9, 10, 12, 14, and 16 mM, and at the following concentrations of ATP: 0.2, 0.5, 1, 2, 3, 5, 7, 10, 12 and 14 mM. The concentration of other substances in the enzymatic-activity assay system remained unchanged. The Hill equation (V = Vmax (Sn)/(Kn + Sn)) was applied in Origin 8.5, to simulate the steady-state kinetics.36Optimum temperature and pH
The optimum temperature of the enzyme was determined by incubation of the reaction mixture (the enzymatic-activity assay system) at 15, 20, 25, 26, 28, 30, 35, 40, 45, or 50 °C. The optimum pH of the enzyme was determined using 100 mM Tris–HCl with adjustment of buffer pH from 6 to 10 in 0.5-unit steps. The maximum enzymatic activity, which was achieved at the optimum temperature and pH, was set to 100%.Thermostability of the wild-type and mutant AKs
The enzymatic activity at 0 h in the stability assay was set to 100%. The half-life is the time required for the relative enzyme activity to reduce to 50%. Longer the half-life, better the stability of the enzyme. The AK purified solution was incubated at 20, 28, 30, 35, 40, and 45 °C (pH 7.4) for 1–10 h, respectively. Enzyme activity was assayed every 1 h, as described previously.Effect of inhibitors on enzyme activity
The effect of inhibitors on AK activity was determined by adding Lys, Thr and Lys + Thr with different concentrations (0.2, 1, 5, and 10 mM). The relative enzymatic activity without inhibitors was set to 100%.Microscale thermophoresis (MST) analysis
The purified AK was labeled with RED fluorescent dye NT-647-NHS and diluted to 40 nM with 1× MST buffer containing 0.05% (v/v) of Tween 20.41 The unlabeled small ligands such as the substrate Asp and inhibitor Lys were diluted in the assay buffer, which was the enzymatic activity measurement system without substrate Asp, and the final concentration ranged from 0.5 M to 15 M and from 0.1 M to 3 M, respectively. After that, equal volumes of a small ligand and labeled protein (40 nM) were incubated at room temperature for 10 min, and the samples were loaded into the Standard Capillaries from NanoTemper Technologies. Thermophoresis was measured 30 min after incubation at 28 °C on Monolith NT.115.42 The dissociation constant (Kd) values were fitted by means of the MO.Affinity Analysis software.Molecular dynamics (MD) simulation
Based on the 3D structure of CgAK (PDB ID: 3aaw), the CpAK structure was obtained by homology modeling using the SWISS-MODEL server (http://www.swiss-model.expasy.org).43,44 AutoDock 4.2 was used to study the binding of different ligands to the active pocket of CpAK.45 This tool uses a semiempirical free energy force field as the scoring function to evaluate the docked conformation solution. The binding of AK to Asp, ATP, and Lys was carried out via MD simulation at the 100 ns timescale using the AMBER 16 software package.46 General AMBER force field (GAFF) parameters were assigned to the ligands. All complex systems were modeled within the periodic boundary framework of the TIP3P water model and then neutralized with Cl− or Na+ counterions where necessary by MD simulation.47 First, the complex system energy was minimized through the steepest descent algorithm. Then, each system was gradually heated from 0 to 300 K within 50 ps, and the temperature of the system was maintained at 300 K via the Langevin thermostat to obtain stable density. The temperature was controlled by the temperature-coupling method in Langevin dynamics, and collision frequency was 1.0 ps. After that, the complexes were initiated, and we continued to simulate them for 100 ns in an NPT ensemble at 1 atm and 300 K with an unconstrained production phase. During the simulation, long-range electrostatic interactions were evaluated by the particle mesh Ewald algorithm.48 Bond angles and lengths were constrained by the P-LINCS algorithm.49 The SHAKE method was applied to constrain the bond length of hydrogen atoms connected with heteroatoms.50 The time step of the MD simulation was set to 2.0 fs, and all coordinates were saved every 20 ps for subsequent analysis.4 Conclusions
Aspartokinase (AK) is an enzyme which is tightly regulated through feedback control and plays an important role in the metabolism of the aspartate family amino acids. In this study, the M372I/T379W mutant of AK with 16.51 fold higher catalytic activity was successfully constructed by site-directed mutagenesis and high-throughput screening. Results showed that the optimal temperature was increased by 7 °C, the range of tolerance to pH was wider, and the half-life was extended to 5.7 h. The effects of inhibitors on enzyme activity and MST analysis showed that M372I/T379W AK relieved the feedback inhibition of Lys. In addition, molecular dynamics simulation results indicated that mutations M372I and T379W caused significant changes in the Rg and SASA of the whole protein as well as a structural rearrangement of the residues near the ATP or Asp binding pocket of AK. Analysis of SASA, RMSF and H-bond revealed that Tyr198, Arg203, Lys210, Lys280, Ala60, Glu92, Arg169, Ser172 and Ser192 were the key residues affecting the catalytic activity of CpAK. After mutation of M372I and T379W, AK converted from an inactive T-state to an active R-state and the steric hindrance of Asp binding pocket disappeared, which promoted the binding of AK to Asp. These findings are of great significance for eliminating feedback inhibition and optimizing the function of AK in metabolic pathways.Conflicts of interest
The authors declare no conflicts of interest in this work.Abbreviations
| WT | Wild-type |
| AK | Aspartokinase |
| A600 | Absorbance at 600 nm |
| MST | Microscale thermophoresis |
| MD | Molecular dynamics |
| RMSD | Root mean square deviations |
| Rg | Radius of gyration |
| SASA | Solvent accessible surface area |
| RMSF | Root mean square fluctuation |
Acknowledgements
This work was financially supported by the Science and Technology Innovation “Double Ten Project” of Changchun Science and Technology Bureau (No. 17SS030) and National Natural Science Foundation of China (No. 31771957).References
- S. Black and N. G. Wright, J. Biol. Chem., 1955, 213, 27–38 CAS.
- A. Y. Robin, D. Cobessi, G. Curien, R. G. Mylène, J. L. Ferrer and J. L. Dumas, J. Mol. Biol., 2010, 399, 283–293 CrossRef CAS.
- M. Tsujimoto, A. Yoshida, T. Shimizu, T. Tomita, Y. Ohnishi, T. Kuzuyama and M. Nishiyama, Biosci., Biotechnol., Biochem., 2016, 80, 2255–2263 CrossRef CAS.
- N. Kobashi, M. Nishiyama and M. Tanokura, J. Bacteriol., 1999, 181, 1713–1718 CAS.
- B. A. Manjasetty, M. R. Chance, S. K. Burley, S. Panjikar and S. C. Almo, Biotechnology Reports, 2014, 3, 73–85 CrossRef.
- D. C. Mas, G. Curien, G. M. Robert, M. Laurencin, J. L. Ferrer and R. Dumas, Plant Cell, 2006, 18, 1681–1692 CrossRef.
- G. Curien, M. Laurencin, G. M. Robert and R. Dumas, FEBS J., 2007, 274, 164–176 CrossRef CAS.
- P. Stephane, P. M. Wessel and D. Renaud, Protein Expression Purif., 2002, 24, 105–110 CrossRef.
- G. Curien, R. Stéphane, R. Mylène and R. Dumas, J. Biol. Chem., 2005, 280, 41178–41183 CrossRef CAS.
- C. F. Bearer and K. E. Neet, Biochemistry, 1978, 17, 3512–3516 CrossRef CAS PubMed.
- Y. Kikuchi, H. Kojima and T. Tanaka, FEMS Microbiol. Lett., 1999, 173, 211–215 CrossRef CAS.
- M. Kotaka, J. Ren, M. Lockyer, A. R. Hawkins and D. K. Stammers, J. Biol. Chem., 2006, 281, 31544–31552 CrossRef CAS.
- A. Yoshida, T. Tomita, T. Kurihara, S. Fushinobu, T. Kuzuyama and M. Nishiyama, J. Mol. Biol., 2007, 368, 521–536 CrossRef CAS.
- X. Dong, Y. Zhao, J. Zhao and X. Wang, J. Ind. Microbiol. Biotechnol., 2016, 43, 873–885 CrossRef CAS.
- S. Hwang, Y. K. Chan, S. G. Ji, J. Go, H. Kim, S. Yang, H. J. Kim, A. Cho, S. Y. Sang and I. Lee, Sci. Rep., 2016, 6, 26223 CrossRef CAS.
- C. C. Li, M. J. Yang, L. Liu, T. Li, C. T. Peng, L. H. He, Y. J. Song, Y. B. Zhu, Y. L. Shen, J. Yang, N. L. Zhao, C. Zhao, Q. X. Zhou, H. Li, M. Kang, A. P. Tong, H. Tang and R. Bao, Biochem. J., 2018, 475, 1107–1119 CrossRef CAS PubMed.
- S. Mitsuhashi, Curr. Opin. Biotechnol., 2014, 26, 38–44 CrossRef CAS PubMed.
- I. Nærdal, R. Netzer, T. E. Ellingsen and T. Brautaset, Appl. Environ. Microbiol., 2011, 77, 6020–6026 CrossRef.
- J. Becker and C. Wittmann, Curr. Opin. Biotechnol., 2012, 23, 718–726 CrossRef CAS.
- T. Willke, Appl. Microbiol. Biotechnol., 2014, 98, 9893–9914 CrossRef CAS.
- V. F. Wendisch, M. Bott and B. J. Eikmanns, Curr. Opin. Microbiol., 2006, 9, 268–274 CrossRef CAS.
- J. Becker, O. Zelder, S. Häfner, H. Schröder and C. Wittmann, Metab. Eng., 2011, 13, 159–168 CrossRef CAS.
- A. Yoshida, T. Tomita, T. Kuzuyama and M. Nishiyama, J. Biol. Chem., 2010, 285, 27477–27486 CrossRef CAS.
- Z. Chen, S. Rappert, J. Sun and A. P. Zeng, J. Biotechnol., 2011, 154, 248–254 CrossRef CAS PubMed.
- S. C. Lovell, I. W. Davis, W. B. Arendall, P. I. W. De Bakker, J. M. Word, M. G. Prisant, J. S. Richardson and D. C. Richardson, Mol. Biol. Evol., 2003, 50, 437–450 CAS.
- C. Amit, S. Muralikumar, S. Janaki, M. Lakshmipathy, K. L. Therese, V. Umashankar, P. Padmanabhan and J. Narayanan, Int. J. Nanomed., 2019, 14, 605–622 CrossRef CAS PubMed.
- X. Liu, A. G. Pavlovsky and R. E. Viola, J. Biol. Chem., 2008, 283, 16216–16225 CrossRef CAS PubMed.
- G. A. Grant, J. Biol. Chem., 2006, 281, 33825–33829 CrossRef CAS PubMed.
- D. M. Chipman and B. Shaanan, Curr. Opin. Struct. Biol., 2001, 11, 694–700 CrossRef CAS.
- T. Rogez-Florent, C. Foulon, A. S. Drucbert, N. Schifano, P. Six, S. Devassine, P. Depreux, P. M. Danzé, L. Goossens and C. Danel, J. Pharm. Biomed. Anal., 2017, 137, 113–122 CrossRef CAS.
- M. Kandeel, Y. Kitade, A. Al-Taher and M. Al-Nazawi, PLoS One, 2019, 14, e0212065 CrossRef CAS.
- X. Tian, Y. Liu, J. Zhu, Z. Yu, J. Han, Y. Wang and W. Han, PLoS One, 2018, 13, e0207234 CrossRef.
- C. Chothia, J. Mol. Biol., 1976, 105, 1–12 CrossRef CAS.
- P. Johnson, C. Loganathan, A. Iruthayaraj, K. Poomani and P. Thayumanavan, Biochimie, 2018, 154, 1–9 CrossRef CAS.
- G. K. Viswanathan, S. Mohapatra, A. Paul, E. Arad, R. Jelinek, E. Gazit and D. Segal, Molecules, 2018, 23, 30544943 CrossRef.
- C. Han, L. Fang, C. Liu, Y. Gao and W. Min, Molecules, 2018, 23, 30572676 Search PubMed.
- N. Mustafi, A. Grünberger, D. Kohlheyer, M. Bott and J. Frunzke, Metab. Eng., 2012, 14, 449–457 CrossRef CAS.
- H. Hayakawa, F. Sobue, K. Motoyama, T. Yoshimura and H. Hemmi, Biochem. Biophys. Res. Commun., 2017, 487, 702–708 CrossRef CAS.
- E. Bisetto, F. Di Pancrazio, M. P. Simula, I. Mavelli and G. Lippe, Electrophoresis, 2007, 28, 3178–3185 CrossRef CAS PubMed.
- M. T. Follettie, O. P. Peoples, C. Agoropoulou and A. J. Sinskey, J. Bacteriol., 1993, 175, 4096–4103 CrossRef CAS.
- B. Kuropka, A. Witte, J. Sticht, N. Waldt, P. Majkut, C. P. Hackenberger, B. Schraven, E. Krause, S. Kliche and C. Freund, Mol. Cell. Proteomics, 2015, 14, 2961–2972 CrossRef CAS.
- H. G. Kazemier, K. Paeschke and P. M. Lansdorp, Nucleic Acids Res., 2017, 45, 5913–5919 CrossRef CAS.
- M. Biasini, S. Bienert, A. Waterhouse, K. Arnold, G. Studer, T. Schmidt, F. Kiefer, T. C. Gallo, M. Bertoni and L. Bordoli, Nucleic Acids Res., 2014, 42, W252–W258 CrossRef CAS.
- S. Bienert, A. Waterhouse, T. A. de Beer, G. Tauriello, G. Studer, L. Bordoli and T. Schwede, Nucleic Acids Res., 2017, 45, D313–D319 CrossRef CAS.
- C. M. Labbé, J. Rey, D. Lagorce, M. Vavruša, J. Becot, O. Sperandio, B. O. Villoutreix, P. Tufféry and M. A. Miteva, Nucleic Acids Res., 2015, 43, W448–W454 CrossRef PubMed.
- D. A. Case, T. E. Cheatham, T. Darden, H. Gohlke, R. Luo, K. M. Merz, A. Onufriev, C. Simmerling, B. Wang and R. J. Woods, J. Comput. Chem., 2005, 26, 1668–1688 CrossRef CAS PubMed.
- M. F. Harrach and D. Barbara, J. Chem. Phys., 2014, 140, 1573 CrossRef.
- V. Solomon, A. Teplitsky, S. Shulami, G. Zolotnitsky, Y. Shoham and G. Shoham, Acta Crystallogr., Sect. D: Biol. Crystallogr., 2007, 63, 845–859 CrossRef CAS.
- B. Hess, J. Chem. Theory Comput., 2008, 4, 116–122 CrossRef CAS.
- T. A. Soares, M. A. Osman and T. P. Straatsma, J. Chem. Theory Comput., 2007, 3, 1569–1579 CrossRef CAS.
Footnote |
| † Electronic supplementary information (ESI) available. See DOI: 10.1039/c9ra03293b |
| This journal is © The Royal Society of Chemistry 2019 |

