 Open Access Article
Creative Commons Attribution 3.0 Unported Licence
Systematic study of TiO2/ZnO mixed metal oxides for CO2 photoreduction†
Warren A. Thompson‡
 *a,
Alberto Olivo‡b,
Danny Zanardo‡c,
Giuseppe Crucianid,
Federica Menegazzoc,
Michela Signoretto
 c and
M. Mercedes Maroto-Valera
aResearch Centre for Carbon Solutions (RCCS), School of Engineering & Physical Sciences, HeriotWatt University, Edinburgh, EH14 4AS, UK. E-mail: wat1@hw.ac.uk
bLow Emission Resources Corporation, 2 Mid Craigie Rd, Dundee, DD4 7RH, UK
cCatMat Lab, Dept. of Molecular Sciences and Nanosystems, Ca' Foscari University Venice, Consortium INSTM, RU of Venice, Via Torino 155, 30172 Venezia, Italy
dDepartment of Physics and Earth Sciences, University of Ferrara, Via G. Saragat 1, Ferrara, I-44122, Italy
First published on 12th July 2019
Abstract
A two component three degree simplex lattice experimental design was employed to evaluate the impact of different mixing fractions of TiO2 and ZnO on an ordered mesoporous SBA-15 support for CO2 photoreduction. It was anticipated that the combined advantages of TiO2 and ZnO: low cost, non-toxicity and combined electronic properties would facilitate CO2 photoreduction. The fraction of ZnO had a statistically dominant impact on maximum CO2 adsorption (β2 = 22.65, p-value = 1.39 × 10⁻⁴). The fraction of TiO2 used had a statistically significant positive impact on CO (β1 = 9.71, p-value = 2.93 × 10⁻⁴) and CH4 (β1 = 1.43, p-value = 1.35 × 10⁻³) cumulative production. A negative impact, from the interaction term between the fractions of TiO2 and ZnO, was found for CH4 cumulative production (β3 = −2.64, p-value = 2.30 × 10⁻²). The systematic study provided evidence for the possible loss in CO2 photoreduction activity from sulphate groups introduced during the synthesis of ZnO. The decrease in activity is attributed to the presence of sulphate species in the ZnO prepared, which may possibly act as charge carrier and/or radical intermediate scavengers.
1 Introduction
CO2 photoreduction is one of the potential technologies for carbon utilisation.1 However, major optimization in photocatalyst design is required for its applicability.2 Possible approaches in heterogeneous photocatalysis to improve photocatalytic activity include photocatalyst dispersion on highly porous substrates and the use of coupling two semiconductors as photocatalysts. For these reasons, composite mixtures of ZnO and TiO2 were prepared on an ordered mesoporous SBA-15 silica support for CO2 photoreduction. SBA-15 was chosen as it has several favourable characteristics including: a large surface area which may enhance photocatalyst dispersion and the availability of photons;3 SBA-15 is also chemically and mechanically stable4 and SBA-15 has shown effectiveness as a CO2 photoreduction support.5–7TiO2 has been shown to be an effective photocatalyst for CO2 photoreduction with numerous examples found in the literature.1,8,9 ZnO has also shown promise as a photocatalyst for CO2 photoreduction.10–12 ZnO offers improved CO2 adsorption12 and low charge carrier recombination.13 Both TiO2 and ZnO share low cost, non-toxicity and relatively environmentally friendly properties.1,14
TiO2 is not efficient for CO2 photoreduction due to: poor charge carrier mobility leading to a fast recombination rate13 and hindered CO2 adsorption in the presence of H2O due to the limited presence of surface basic functionalities.15 On the contrary, ZnO exhibits a longer charge carrier lifetime16 and suitable surface basicity,17 which can improve CO2 adsorption. Moreover, the coupling of TiO2 and ZnO, was reported to form a heterojunction that could reduce charge carrier recombination leading to enhanced CO2 photoreduction activity.18 Composite mixtures of anatase TiO2 and wurtzite-type ZnO, due to the TiO2/ZnO heterojunction formed, showed improved CO2 photoreduction activity.19 Other examples of composite mixtures of TiO2 and ZnO leading to improved photocatalytic activity, due to less charge recombination, include the degradation of phenols and salicylic acid.20,21 Due to their synergistic effects on electronic and acid/base properties, the use of TiO2 and ZnO as photocatalyst mixture is promising for CO2 photoreduction. However, no examples have described the impact of different mixing fractions of TiO2 and ZnO on CO2 photoreduction performance.
CO2 photoreduction faces the challenge of low efficiency but also the deactivation of the photocatalyst.22 Deactivation of the photocatalyst has been reported, especially when production data is collected in continuous flow setups, for CO2 photoreduction by a growing number of authors.23–32 Possible explanations for deactivation include: photocatalyst poisoning due to irreversible adsorption of reaction intermediates; sintering and agglomeration of the photocatalyst metal active sites and loss of active reaction sites that include oxygen vacancies, surface hydroxyls and Ti3+ sites.22 To develop CO2 photoreduction, low efficiency and deactivation of the photocatalyst need to be addressed. In a closely related field of photocatalytic oxidation, radical scavenging of the reactive oxygen species as hydroxyl radicals have been found to lead to deactivation.33 Some inorganic anions are known to interact with radical processes, by yielding less reactive and more stable intermediates and thus hampering the overall photocatalytic reaction.34
High throughout technologies and automation are critical to finding suitable photocatalysts.35 Central to these technologies is the use of systematic experimental designs, Design of Experiments (DOE), for decision making. There are numerous examples in the literature describing the use of DOE for engineering and process optimisation.29,36,37 Mixture designs can efficiently evaluate the impact of component fractions in a mixture.38 In this work, the impact of TiO2 and ZnO fractions used for the formulation of a mixed metal oxide (MO) photocatalyst mixture on a SBA-15 support, was evaluated for CO2 photoreduction using a novel combination of a systematic mixture design and photocatalysis theory.
In this work in-house synthesis of the photocatalysts was used due to the potential and scope, using different synthetic methodologies, for improvements to increase surface area, crystallinity,39 photocatalyst coverage and optical properties.29
2 Experimental
2.1 Photocatalyst preparation
SBA-15 was synthesized according the procedure reported in literature.40 Briefly, template EO20-PO70-EO20 (P123, Aldrich) was dissolved in aqueous HCl solution and tetraorthosilicate (TEOS) was introduced as silica precursors. Powder was aged at 90 °C, dried and then calcined at 550 °C for 6 h under air flow. TiO2 and ZnO were synthesised by precipitation of inorganic salts. In the case of TiO2, a titanyl sulphate solution and a NaOH solution were added dropwise to deionised H2O under vigorous stirring, keeping pH neutral. Then the Ti(OH)4 suspension was aged at 60 °C for 20 h and then washed with distilled H2O to remove the sulphate ions and dried at 110 °C for 18 h and finally calcined at 400 °C for 4 h in air flow.41 ZnO was prepared following the same procedure reported for TiO2, but starting from a ZnSO4 solution as precursor and keeping the pH slightly alkaline (pH 9) during the precipitation. The prepared TiO2 and ZnO were added onto SBA-15 by incipient wetness impregnation using isopropanol as a liquid medium. Samples were then dried at 110 °C for 18 h.2.2 UV-vis absorption
The light absorption and electronic band were characterized using a UV-vis spectrometer (PerkinElmer lamda 950) equipped with a 150 mm integration sphere (PerkinElmer). The band gap was determined using the Kubelka–Munk function (1) and intersection of the Tauc segment and hν-axis of the Tauc plot.42
 | (1) |
2.3 XRD characterisation
For the analysis of mixed MOs on SBA-15, a Bruker D8 Advance powder diffractometer, operating with Ge-monochromated Cu Kα radiation (wavelength = 1.5406 Å) and a LynxEye linear detector. Data were collected over the angular range 5–85° in 2θ. For the analysis of pure ZnO and TiO2, X-ray Diffraction (XRD) patterns were collected on a Bruker D8 Advance powder diffractometer with a sealed X-ray tube (copper anode, 40 kV and 40 mA) and a Si(Li) solid state detector (Sol-X) set to discriminate the Cu Kα radiation. Apertures of divergence, receiving, and detector slits were 2.0 mm, 2.0 mm, and 0.2 mm, respectively. Data scans were performed in the 2θ range 5–75° with 0.02° step size and counting times of 3 s per step. Quantitative phase analysis determination performed using the Rietveld method as implemented in the TOPAS v.4 program (Bruker AXS) using the fundamental parameters approach for line-profile fitting.2.4 N2 physisorption
Specific surface areas (SSA) of the samples were evaluated by N2 physisorption. 200 mg of the sample was placed under vacuum at 200 °C for 2 h. The analyses were then carried out recording the adsorption–desorption isotherm at −196 °C with a Micromeritics ASAP 2000 analyzer. SSAs were finally determined by the BET equation.432.5 CO2 adsorption
Samples were degassed under a constant purge of N2 at 200 °C for 10 h. CO2 adsorption capacities were estimated by the maximum value found from the CO2 adsorption isotherm measured at 273 K over fifteen equidistant points from 0 to 0.95 P/P0 (Gemini VII 2390).2.6 CO2 photoreduction tests
A slurry of the prepared mixed MO photocatalyst was prepared by adding ≈100 mg of the mixed MO photocatalyst to 1 ml DI H2O in a 5 ml vial. The vial was sealed and agitated in a ultrasonic bath for two minutes. The slurry was then deposited dropwise onto a glass fiber disc (47 mm diameter). The coated glass fiber disc was dried at 120 °C for 2 h. The coated glass fiber disc was placed in the middle of a stainless steel photoreactor (r = 25 mm, h = 1 mm, ν = 1.96 mm3) and sealed. Residual air in the system was evacuated via three repetitive steps of placing the system under vacuum to −1 bar and the vacuum released with CO2 (99.995%) to +1 bar. The flow rate of CO2 was set to 0.35 ml min−1 and passed through the temperature controlled (±0.1 °C) aluminium body saturator for at least 12 h to allow the system to equilibrate. Relative humidity (±1.8% RH) was measured using an inline Sensirion SHT75 humidity sensor potted (MG Chemicals 832HD) into a Swagelok 1/4′′ T-piece. The temperature of the photocatalyst surface (40 °C ± 2.0 °C) was controlled using a hotplate and the surface temperature measured using a Radley's pyrometer. To prevent condensation at higher saturation temperatures, the lines from the outlet of the saturator up until the inlet of the H2O trap were heated and temperature controlled (±0.1 °C) with a heating rope and thermocouple (Fig. 1).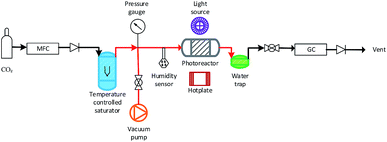 | ||
| Fig. 1 Overview of the experimental setup used for the MO photocatalyst mixture CO2 photoreduction tests (not to scale). Pipe lines in red were heated with a temperature controlled heating rope. | ||
An OmniCure S2000 fitted with a 365 nm filter was used as the light source and the irradiance (295.71 ± 1.60 mW cm−2) checked before each experiment using an OmniCure R2000 radiometer (±5%). An inline GC (Agilent, Model 7890B series) with a Hayesep Q column (1.5 m), (1/16 inch od, 1 mm id), MolSieve 13× (1.2 m), (1/16 inch od, 1 mm id), thermal conductivity detector (TCD), nickel catalysed methanizer and flame ionization detector (FID) was used to analyze the output of the photoreactor every four minutes. CO and CH4 production rates were recorded in units of μmol gcat−1 h−1 using only the mass of active mixed MO photocatalyst/s used with the exclusion of the SBA-15 support mass. Cumulative production (μmol gcat−1) was calculated by integrating the area under the production rate (μmol gcat−1 h−1) vs. time (h) curve.
2.7 Ionic chromatography method for testing sulphates
Quantitative analysis of sulphates was performed through a procedure previously reported for sulphate-doped zirconia.44 200 mg of the sample was treated with 250 mL of 0.1 M NaOH solution to extract the sulphates. The suspension was filtered and analyzed. A LC20 ionic chromatographer equipped with a 25 μL injection loop, a AS14 separation column, a AG14 guard column, an acid resin suppressor and a ED40 conductivity detector was used. A buffer solution of 10 mM Na2CO3 and 3.5 mM NaHCO3 in Milli-Q H2O, at room temperature was used as eluent. A calibration curve for quantitative analysis was obtained using standard Na2SO4 solution between 1 and 8 ppm.2.8 SEM/EDX analysis
Scanning electron microscopy and X-ray energy dispersive spectroscopy analysis of the mixed MOs and SBA support were performed using a FEI Scios SEM equipped with an EDAX Octane Plus EDS detector.2.9 Design of experiments
A two component three degree simplex lattice design was employed with experimental settings and results shown in Table 1. MATLAB was used to estimate: the fitted coefficient values; determine the p-values and plot the models and data.| Exp. name | X1 fraction TiO2 | X2 fraction ZnO | Amount TiO2 (mg) | Amount ZnO (mg) |
|---|---|---|---|---|
| MO1 | 1.00 | 0.00 | 200.2 | 0.0 |
| MO2 | 0.67 | 0.33 | 133.9 | 67.4 |
| MO3 | 0.33 | 0.67 | 66.5 | 133.2 |
| MO4 | 0.00 | 1.00 | 0.0 | 200.4 |
| MO5 | 0.50 | 0.50 | 100.4 | 102.7 |
| MO6 | 0.75 | 0.25 | 149.5 | 53.5 |
| MO7 | 0.25 | 0.75 | 50.7 | 150.7 |
The experimental design results were used to fit the polynomial function shown by (2).
| Y = β1X1 + β2X2 + β3X1X2 | (2) |
Using the matrix of X1 and X2 fractions of TiO2 and ZnO values shown in Table 1 and either the maximum CO2 adsorption, cumulative production of CO or CH4 production as a response shown by Y in (2), the coefficients β1, β2 and β3 from (2), were estimated by linear regression using a QR decomposition algorithm (fitlm function) in MATLAB (Table 3). The p-values for each coefficient were determined using the MATLAB fitlm function call. Using 95% confidence, p-values less than 0.05 indicated that the coefficient value was not equal to zero and it's associated parameter (X1, X2 or X3) had a statistically significant impact on either maximum CO2 adsorption, CO or CH4 cumulative production.
3 Results and discussion
3.1 Characterization and properties of mixed metal oxides
The samples prepared with a high fraction of TiO2 (MO1, MO2, MO5 and MO6) showed the characteristic broad adsorption peak of anatase TiO2 (Fig. 2a). As the fraction of ZnO increased (MO3, MO4 and MO7) the Tauc plot peak shapes became sharper and characteristic of the adsorption peaks of ZnO (Fig. 2a). Increasing the fraction of TiO2 increased the band gap linearly from the ZnO region (3.16 eV) towards the anatase region (3.24 eV) (Fig. 2b).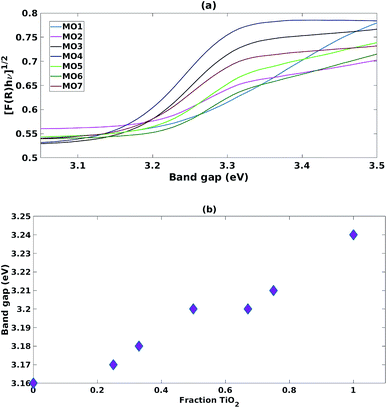 | ||
| Fig. 2 (a) Tauc plots for mixed MO photocatalysts (b) impact of increasing fraction of TiO2 on band gap. | ||
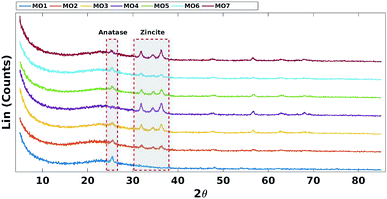
Decreasing the fraction of TiO2 reduced the intensity of the characteristic anatase XRD peak (JCPDS Card no. 21-1272) at 2θ = 25.4 (Fig. 3).45 Increasing the fraction of ZnO increased the intensity of the characteristic zincite peaks (JCPDS card no. 36-1451) at 2θ = 31.9, 34.4 and 36.2 (Fig. 3).46
As reported in Fig. 4a, adsorption isotherms of all the mixed MO samples exhibited the typical shape of SBA-15, suggesting that its ordered mesoporous structure was retained.40 Nevertheless, when comparing the SSAs with the TiO2 fraction (Fig. 4b), a sinusoidal trend was observed, suggesting that SSA has no or little effect on photoreduction efficiency and selectivity in these mixed MO systems.
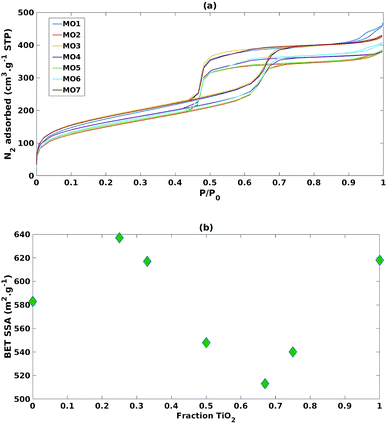 | ||
| Fig. 4 (a) N2 adsorption isotherms of the mixed MO photocatalysts (b) impact of increasing fraction of TiO2 on BET specific surface area. | ||
3.2 Mixture design and the impact of TiO2 and ZnO fractions
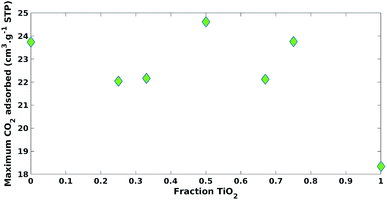
Both the fraction of ZnO and TiO2 positively impacted (β1 = 19.31, β2 = 22.65) maximum CO2 adsorption with statistical significance (p-value = 2.61 × 10⁻⁴, p-value = 1.39 × 10⁻⁴), respectively (Table 2). The impact of the ZnO fraction had a larger coefficient value (β2 = 22.65) versus TiO2 (β1 = 19.31) and this could be explained by the increase in surface basicity.17 It was expected that an increase in CO2 adsorption would increase CO2 photoreduction photocatalytic activity. However, photocatalytic processes are complicated and often multiple properties of the photocatalyst need to be considered.1
| Regression results for maximum CO2 adsorption | ||
|---|---|---|
| Parameter coefficient | Value estimated | p-Value |
| β1 | 19.31 | 2.61 × 10⁻⁴* |
| β2 | 22.65 | 1.39 × 10⁻⁴* |
| β3 | 9.28 | 2.32 × 10⁻¹ |
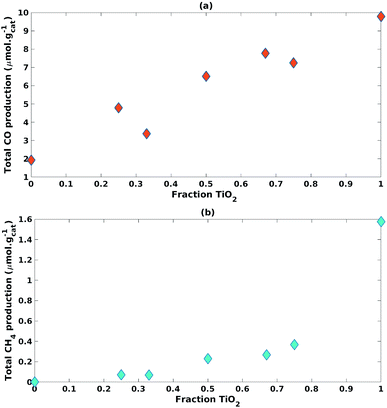 | ||
| Fig. 6 Impact of increasing fraction of TiO2 on (a) CO cumulative production and (b) CH4 cumulative production. | ||
The TiO2 fraction in the photocatalyst mixture positively impacted (β1 = 9.71) CO cumulative production with statistical significance (p-value = 2.93 × 10⁻⁴) (Table 3). This was also the case for CH4 cumulative production (β1 = 1.43, p-value = 1.35 × 10⁻³) (Table 3).
| Regression results for CO cumulative production | Regression results for CH4 cumulative production | ||||
|---|---|---|---|---|---|
| Parameter coefficient | Value estimated | p-Value | Parameter coefficient | Value estimated | p-Value |
| β1 | 9.71 | 2.93 × 10⁻⁴* | β1 | 1.43 | 1.35 × 10⁻³* |
| β2 | 1.96 | 7.51 × 10⁻² | β2 | 0.12 | 5.50 × 10⁻¹ |
| β3 | 0.53 | 8.83 × 10⁻¹ | β3 | −2.64 | 2.30 × 10⁻²* |
An interaction effect was found between the fractions of TiO2 and ZnO used in the photocatalyst mixture with a statistically significant (p-value = 2.30 × 10⁻²) and negative impact (β3 = −2.64) on CH4 cumulative production (Table 3). This would indicate that the inclusion of ZnO significantly hampered the production of CH4.
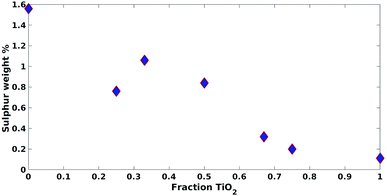
These results were not encouraging from an activity point of view but they offered an opportunity for further scientific enquiry. Both TiO2 and ZnO were synthesised using a precipitation method that employed sulphate salts TiOSO4 and ZnSO4, respectively. Ion chromatography (IC) analyses were performed on pristine TiO2 and ZnO samples, showing 0.4% and 12.0% wt sulphates, respectively. The large amount of sulphates observed in the ZnO samples, was also confirmed by XRD analysis (Fig. 7), showing that this material is actually composed of 43% Zn3O(SO4)2, corresponding to 20.7% wt amount of sulphates, and 57% ZnO.47 The difference in the amount of sulphates recorded by IC and XRD is likely due to the inability of the IC analysis extraction procedure to recover all the sulphates. Sulphur and zinc mapped very closely to one another by SEM/EDX analysis (Fig. 8). Visually, sulphur content increased with increasing fraction of ZnO (Fig. 8). The EDX analysis also yielded a linear increase in sulphur with increasing the fraction of ZnO used (Fig. 9). Together, these were additional pieces of evidence highlighting the incorporation of sulphates by the ZnO used.
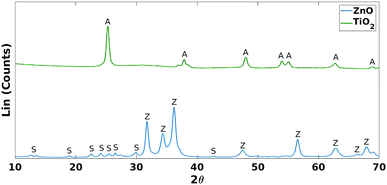 | ||
| Fig. 7 XRD comparison of TiO2 and ZnO. A = anatase (TiO2 phase), Z = zincite (ZnO phase) and S = Zn3O(SO4)2. | ||
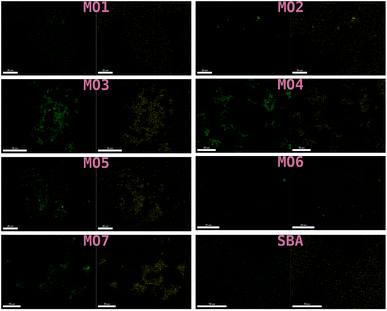 | ||
| Fig. 8 SEM/EDX of MO1–MO7 and the SBA-15 support used. Zinc mapped on the left and sulphur on the right. | ||
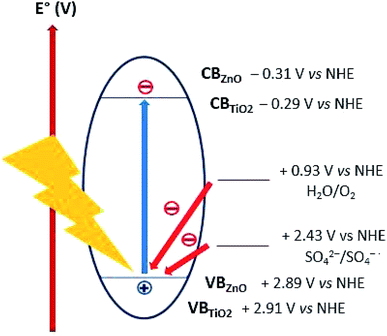
Lo et al. reported acidic sulphate modified titania as an efficient photocatalyst for CO2 photoreduction48 Nevertheless, sulphate anions was observed to have a detrimental effect on photooxidation by acting as both radical scavenger49 and competing with reagents for adsorption to active photocatalyst sites.50 We can discount the latter hypothesis since as discussed in Section 3.2.1, ZnO was observed to improved CO2 adsorption. The radical (or hole) scavenging hypothesis was thus considered. Several mechanisms, all involving radical intermediates, have been proposed for CO2 photoreduction.22,51 Sulphates or species arising from radical scavenging yielding SO4˙− species might interfere with the CO2 photoreduction reaction pathway. Moreover, the oxidizing holes generated on both TiO2 (+2.91 V vs. NHE) and ZnO (+2.89 V vs. NHE) valence band,18 can be potentially scavenged by sulphates (E° = +2.43 V vs. NHE),52 thus acting as charge carrier trap and competing with water oxidation (Fig. 10). The sulphates acting as radical and/or hole scavengers are very likely to undergo chemical transformations towards reduced sulphur species such as H2S, SO2 and S. To confirm this hypothesis, future work would include attempting to identify these species formed during the CO2 photoreduction reaction.
4 Conclusion
A systematic experimental mixture design as used to investigate the impact of the fractions of TiO2 and ZnO as mixed MOs on an ordered SBA-15 mesoporous support for CO2 photoreduction activity. The combination of a systematic experimental mixture design using numerical tools and the analysis of the prepared TiO2/ZnO photocatalyst properties offered an opportunity to provide evidence for the trapping of radical CO2 photoreduction intermediates and/or charge carriers by sulphate groups. This approach has shown use for rapid screening and the development of mixed MOs for CO2 photoreduction.Increasing the fraction of ZnO increased the adsorption of CO2 with statistical confirmation using the mixture design. Increasing the fraction of TiO2 improved the production of CO with a linear trend observed. Increasing the fraction of TiO2 also improved the production of CH4 with an exponential trend observed. This was confirmed by numerical analysis where the fraction of TiO2 was found to be statistically significant for both CO and CH4 cumulative production. The exponential trend for CH4 cumulative production could be explained by the statistical significance of a negative interaction between the fraction of TiO2 and ZnO used. Increasing the fraction of ZnO yielded significantly less CH4 production and had a slightly less dramatic, albeit still negative, impact on CO production.
The impact of radical scavengers on deactivation has not been explored for CO2 photoreduction. The mixed MO mixtures was initially intended to improve the efficiency of CO2 photoreduction. However, this study showed how the inclusion of sulphates from the synthesis method very likely led to deactivation and lower production of CH4 and CO. In addition, this study serves as a framework for the efficient and systematic study of other novel photocatalyst synthetic techniques and subsequent formulation of novel mixtures for CO2 photoreduction.
Conflicts of interest
There are no conflicts to declare.Acknowledgements
The authors thank the financial support provided by the Engineering and Physical Sciences Research Council (EP/K021796/1), the Research Centre for Carbon Solutions (RCCS) and the James Watt Scholarship Programme at Heriot-Watt University. We are also grateful for the support provided by the Buchan Chair in Sustainable Energy Engineering.Notes and references
- O. Ola and M. Maroto-Valer, J. Photochem. Photobiol., C, 2015, 24, 16–42 CrossRef CAS.
- A. Olivo, D. Zanardo, E. Ghedini, F. Menegazzo and M. Signoretto, ChemEngineering, 2018, 2, 42 CrossRef.
- Y. Belmoujahid, M. Bonne, Y. Scudeller, D. Schleich, Y. Grohens and B. Lebeau, Microporous Mesoporous Mater., 2015, 201, 124–133 CrossRef CAS.
- D. Zhao, Q. Huo, J. Feng, B. F. Chmelka and G. D. Stucky, J. Am. Chem. Soc., 1998, 120, 6024–6036 CrossRef CAS.
- C. Zhao, L. Liu, Q. Zhang, J. Wang and Y. Li, Catal. Sci. Technol., 2012, 2, 2558–2568 RSC.
- R. Chen, X. Cheng, X. Zhu, Q. Liao, L. An, D. Ye, X. He and Z. Wang, Chem. Eng. J., 2017, 316, 911–918 CrossRef CAS.
- C.-C. Yang, J. Vernimmen, V. Meynen, P. Cool and G. Mul, J. Catal., 2011, 284, 1–8 CrossRef CAS.
- K. Li, B. Peng and T. Peng, ACS Catal., 2016, 6, 7485–7527 CrossRef CAS.
- X. Chang, T. Wang and J. Gong, Energy Environ. Sci., 2016, 9, 2177–2196 RSC.
- X. Liu, L. Ye, S. Liu, Y. Li and X. Ji, Sci. Rep., 2016, 6, 38474 CrossRef CAS.
- W.-N. Wang, F. Wu, Y. Myung, D. M. Niedzwiedzki, H. S. Im, J. Park, P. Banerjee and P. Biswas, ACS Appl. Mater. Interfaces, 2015, 7, 5685–5692 CrossRef CAS.
- C. Xin, M. Hu, K. Wang and X. Wang, Langmuir, 2017, 33, 6667–6676 CrossRef CAS.
- Y. Li, W. Xie, X. Hu, G. Shen, X. Zhou, Y. Xiang, X. Zhao and P. Fang, Langmuir, 2010, 26, 591–597 CrossRef CAS.
- X. Zhang, J. Qin, Y. Xue, P. Yu, B. Zhang, L. Wang and R. Liu, Sci. Rep., 2014, 4, 4596 CrossRef.
- S. Krischok, O. Höfft and V. Kempter, Surf. Sci., 2002, 507–510, 69–73 CrossRef CAS.
- M. Quintana, T. Edvinsson, A. Hagfeldt and G. Boschloo, J. Phys. Chem. C, 2007, 111, 1035–1041 CrossRef CAS.
- H. Li, D. Gao, P. Gao, F. Wang, N. Zhao, F. Xiao, W. Wei and Y. Sun, Catal. Sci. Technol., 2013, 3, 2801–2809 RSC.
- G. Xi, S. Ouyang and J. Ye, Chem.–Eur. J., 2019, 17, 9057–9061 CrossRef.
- K. Wu, X. Dong, J. Zhu, P. Wu, C. Liu, Y. Wang, J. Wu, J. Hou, Z. Liu and X. Guo, J. Mater. Sci., 2018, 53, 11595–11606 CrossRef CAS.
- V. Sukharev and R. Kershaw, J. Photochem. Photobiol., A, 1996, 98, 165–169 CrossRef CAS.
- N. Serpone, P. Maruthamuthu, P. Pichat, E. Pelizzetti and H. Hidaka, J. Photochem. Photobiol., A, 1995, 85, 247–255 CrossRef CAS.
- F. Fresno, I. J. Villar-García, L. Collado, E. Alfonso-González, P. Reñones, M. Barawi and V. A. de la Peña O'Shea, J. Phys. Chem. Lett., 2018, 9, 7192–7204 CrossRef CAS.
- L. Liu, C. Zhao, D. Pitts, H. Zhao and Y. Li, Catal. Sci. Technol., 2014, 4, 1539–1546 RSC.
- W. N. Wang, W. J. An, B. Ramalingam, S. Mukherjee, D. M. Niedzwiedzki, S. Gangopadhyay and P. Biswas, J. Am. Chem. Soc., 2012, 134, 11276–11281 CrossRef CAS.
- S. Poudyal and S. Laursen, J. Phys. Chem. C, 2018, 122, 8045–8057 CrossRef CAS.
- P. Reñones, A. Moya, F. Fresno, L. Collado, J. J. Vilatela and V. A. de la Peña O'Shea, J. CO2 Util., 2016, 15, 24–31 CrossRef.
- L. Liu, C. Zhao, J. T. Miller and Y. Li, J. Phys. Chem. C, 2017, 121, 490–499 CrossRef CAS.
- Y. Li, W.-N. Wang, Z. Zhan, M.-H. Woo, C.-Y. Wu and P. Biswas, Appl. Catal., B, 2010, 100, 386–392 CrossRef CAS.
- W. A. Thompson, C. Perier and M. M. Maroto-Valer, Appl. Catal., B, 2018, 238, 136–146 CrossRef CAS.
- F. Fresno, P. Reñones, E. Alfonso, C. Guillén, J. F. Trigo, J. Herrero, L. Collado and V. A. de la Peña O'Shea, Appl. Catal., B, 2018, 224, 912–918 CrossRef CAS.
- L. Liu, F. Gao, H. Zhao and Y. Li, Appl. Catal., B, 2013, 134–135, 349–358 CrossRef CAS.
- H. Zhao, L. Liu, J. M. Andino and Y. Li, J. Mater. Chem. A, 2013, 1, 8209–8216 RSC.
- L. Gomathi Devi, S. Girish Kumar, K. Mohan Reddy and C. Munikrishnappa, J. Hazard. Mater., 2009, 164, 459–467 CrossRef CAS.
- M. Chiha, O. Hamdaoui, S. Baup and N. Gondrexon, Ultrason. Sonochem., 2011, 18, 943–950 CrossRef CAS.
- F. Häse, L. M. Roch and A. Aspuru-Guzik, Trends Chem., 2019, 1, 282–291 CrossRef.
- J. Antony, Design of Experiments for Engineers and Scientists, Elsevier Science, 2014 Search PubMed.
- L. Ilzarbe, M. J. Álvarez, E. Viles and M. Tanco, Qual. Reliab. Eng. Int., 2019, 24, 417–428 CrossRef.
- C. C. Solvason, N. G. Chemmangattuvalappil, F. T. Eljack and M. R. Eden, Ind. Eng. Chem. Res., 2009, 48, 2245–2256 CrossRef CAS.
- A. Olivo, E. Ghedini, M. Signoretto, M. Compagnoni and I. Rossetti, Energies, 2017, 10, 1394 CrossRef.
- E. Ghedini, M. Signoretto, F. Pinna and G. Cruciani, Catal. Lett., 2008, 125, 359–370 CrossRef CAS.
- A. Olivo, V. Trevisan, E. Ghedini, F. Pinna, C. Bianchi, A. Naldoni, G. Cruciani and M. Signoretto, J. CO2 Util., 2015, 12, 86–94 CrossRef CAS.
- A. Escobedo-Morales, I. I. Ruiz-López, M. Ruiz-Peralta, L. Tepech-Carrillo, M. Sánchez-Cantú and J. E. Moreno-Orea, Heliyon, 2019, 5, e01505 CrossRef CAS.
- S. Brunauer, P. H. Emmett and E. Teller, J. Am. Chem. Soc., 1938, 60, 309–319 CrossRef CAS.
- C. Sarzanini, G. Sacchero, F. Pinna, M. Signoretto, G. Cerrato and C. Morterra, J. Mater. Chem., 1995, 5, 353–360 RSC.
- W. Liu and Y. Zhang, J. Mater. Chem. A, 2014, 2, 10244–10249 RSC.
- M. M. Demir, R. Muñoz-Espí, I. Lieberwirth and G. Wegner, J. Mater. Chem., 2006, 16, 2940–2947 RSC.
- A. Moezzi, M. B. Cortie and A. M. McDonagh, Dalton Trans., 2013, 42, 14432–14437 RSC.
- C.-C. C. Lo, C.-H. H. Hung, C.-S. S. Yuan and Y.-L. L. Hung, Chin. J. Catal., 2007, 28, 528–534 CrossRef CAS.
- W. Zhang, T. An, M. Cui, G. Sheng and J. Fu, J. Chem. Technol. Biotechnol., 2004, 80, 223–229 CrossRef.
- P.-S. Yap and T.-T. Lim, Appl. Catal., B, 2011, 101, 709–717 CrossRef CAS.
- S. N. Habisreutinger, L. Schmidt-Mende and J. K. Stolarczyk, Angew. Chem., Int. Ed., 2013, 52, 7372–7408 CrossRef CAS.
- R. E. Huie, C. L. Clifton and P. Neta, Int. J. Radiat. Appl. Instrum., Part C, 1991, 38, 477–481 CAS.
Footnotes |
| † Electronic supplementary information (ESI) available. See DOI: 10.1039/c9ra03435h |
| ‡ These authors contributed equally to this work. |
| This journal is © The Royal Society of Chemistry 2019 |

