 Open Access Article
A facile methodology using quantum dot multiplex labels for tracking co-transfection†
Jessica A. Kretzmann a,
RuiLu Fengb,
Alaa M. Munshi‡
a,
Diwei Hoa,
Anna M. Ranieric,
Massimiliano Massi
a,
RuiLu Fengb,
Alaa M. Munshi‡
a,
Diwei Hoa,
Anna M. Ranieric,
Massimiliano Massi c,
Martin Saundersd,
Marck Norreta,
K. Swaminathan Iyer
 *a and
Cameron W. Evans
 *a
*a
aSchool of Molecular Sciences, The University of Western Australia, 35 Stirling Hwy, Crawley, WA 6009, Australia. E-mail: swaminatha.iyer@uwa.edu.au; cameron.evans@uwa.edu.au
bUniversity of Science and Technology of China, 1129 Huizhou Ave, Baohe Qu, Hefei Shi, Anhui Sheng, China 230000
cDepartment of Chemistry, Nanochemistry Research Institute, Curtin University of Technology, Kent St, Bentley, WA 6102, Australia
dCentre for Microscopy, Characterisation and Analysis, The University of Western Australia, 35 Stirling Hwy, Crawley, WA 6009, Australia
First published on 27th June 2019
Abstract
Advances in the field of genome engineering demand the development of efficient non-viral transfection agents capable of delivering multiple distinct nucleic acids efficiently to cells (co-transfection). However, current delivery methods result in lower co-transfection efficiency than single plasmid transfections, and the efficiency decreases further with increasing numbers of plasmids. The development of a high-throughput methodology is required for the validation of co-transfection platforms to facilitate independent tracking of not only the multiple DNA plasmids during transfection but also the localisation of transfection agents. This is pivotal to determine the bottlenecks in achieving high transfection efficiencies at various stages of the cell internalisation and plasmid expression process. Herein we demonstrate that this can be achieved using a facile methodology in which quantum dots (QDs) are used to label two different plasmid DNA assemblies that are delivered to cells simultaneously using a dendronised polymer system. Multispectral confocal imaging can be used to separate signals from each polyplex as well as the expressed fluorescent reporter proteins to determine whether co-transfection difficulties result from poor internalisation or the inability of DNA to escape from polyplexes. The results demonstrate the utility of this facile approach to label polyplexes without interfering with gene expression, and enable high-throughput screening of transfection reagents for achieving optimal co-transfection.
Introduction
Transfection is an important route for the introduction of genetic material into cells to facilitate gene-based therapies.1 In contrast to viral transduction, which is associated with severe toxicity and immunogenicity problems,2 non-viral transfection employs synthetic carriers to condense plasmid DNA (pDNA) into compact nanoparticles which are then taken up by cells via endocytosis.3 However, non-viral transfection remains a relatively poorly understood route, prone to failure and low transfection efficiency.4 Non-viral delivery materials can be divided into two main groups: those that use lipids to form liposomes (lipoplexes), and those that use synthetic polymers (polyplexes).3 Previous work has shown that polyplexes are internalised via endocytosis with trafficking through the endolysosomal pathway,3,5 which results in a low efficiency with which pDNA escapes from endosomal compartments.6 A separate study established that transgene expression does not necessarily require cell division to translocate the pDNA into the nuclei.7 Therefore, cell surface binding, endosomal escape, translocation to the nucleus, and intracellular polyplex decomposition may all be rate-limiting in the process of successful transfection.8,9The advent of genomic editing tools such as CRISPR/Cas9, which is usually delivered as a mixture of pDNA components, has drawn attention to the inefficiency of non-viral transfection, particularly because such platforms require the delivery and expression of multiple plasmids simultaneously.10 Questions addressing bottlenecks in plasmid co-transfection, whether of similar or different size, are important for this reason, and have been overlooked. For transfection agents with only moderate efficiency, the likelihood of transfecting a given cell with multiple different plasmids simultaneously is low, and in previous studies this has necessitated the use of cell sorting to select for specific cellular populations.11,12 Consequently, identifying limiting steps in the transfection pathway and improving current understanding of the transfection process are paramount if successful non-viral delivery of genetic therapies is to be realised, and the technology progressed towards a clinical setting.
While tracking the final outcome of transfection is now routine with the use of reporter genes such as fluorescent proteins,13 probes that follow uptake and endosomal trafficking suffer from drawbacks, and some transfection agents (e.g., polyethylenimine) are known to quench fluorescent DNA labels when polyplexes are formed.14 A non-covalent high-throughput method of tracking could assist in overcoming these problems. Herein we describe a method which allows labelling of polyplexes without interfering with gene expression, which can be utilised for screening of transfection reagents to elucidate and overcome current barriers in achieving optimum co-transfection.
Results and discussion
A new dendronised polymer system that is capable of delivering large pDNA constructs with high efficiency was prepared and utilised for the study.15 The dendronised polymer was prepared by a copper-catalysed ‘click’ reaction of 4.5-generation poly(amidoamine) (G4.5 PAMAM) dendrons onto a random poly[(2-hydroxyethyl methacrylate)-ran-(glycidyl methacrylate)] copolymer backbone (Scheme 1). The dendronised polymer design and composition was selected over sterically-hindered traditional G5 PAMAM dendrimers to allow for optimal flexibility and charge density for plasmid binding and efficient delivery.15 Incorporation of the HEMA monomer as a spacer unit increases polymer biocompatibility, avoiding the high toxicity levels observed with G5 PAMAM dendrimers.15–17 | ||
| Scheme 1 Preparation of dendronised polymer. (i) NaN3, NH4Cl, DMF, 60 °C, 72 h; (ii) alkyne-functionalised 4.5G PAMAM dendron, PMDETA, CuBr, DMF, r.t., 72 h; (iii) ethylenediamine, MeOH, 0 °C. | ||
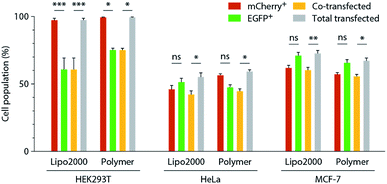
Forming polyplexes from premixed pDNAs improves rates of co-transfection compared to the formation and addition of two distinct polyplexes. Presumably this is because pre-mixing pDNAs increases the chance that a given polyplex, which is usually composed of several pDNA macromolecules,18 will contain both pDNAs. Regardless of whether pDNAs are mixed before or after polyplex formation, we find that there are significant cellular populations that express only a single pDNA (Fig. 1) and this difference in co-efficiency is always lower than that which can be achieved using a single reporter gene. In such a situation, whether the low co-transfection efficiency is the result of differing uptake of individual polyplexes or the inability of polyplexes to be degraded and facilitate endosomal escape remains unknown.
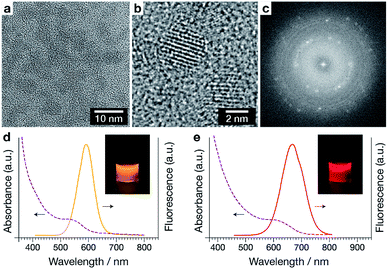
Quantum dots (QDs) can be used as particle-based imaging probes, and can display high fluorescence quantum yield, wide spectral absorption, narrow spectral emission bands, large Stokes shifts, and a high level of photostability.19,20 Quantum dots have been previously used to quantify the rate of polyplex unpacking by a FRET-based method.9,21 CdTe(S) quantum dots (Fig. 2a) were prepared according to the method of Zou et al.
High resolution TEM (Fig. 2b) and the corresponding fast Fourier transform (FFT, Fig. 2c) reveals a lattice spacing of 0.374 nm, which matches the distance between (111) planes in CdTe (JCPDF card 15-0770). The QDs display good photoluminescence properties, including bright and tuneable emission (Fig. 2d, e and S1†). The QD samples collected had emission maximums ranging from 590 to 690 nm, and high quantum yields (QYs) ≈23–44%. QD590 and QD690 were used in subsequent studies and were characterised to have diameters of 3.01 nm and 3.99 nm respectively.
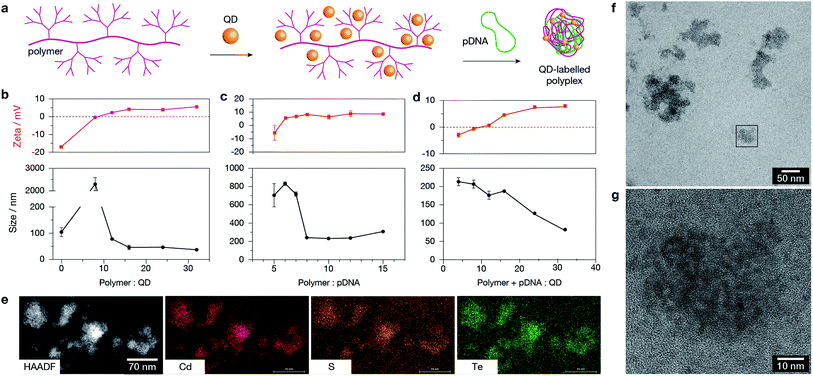
Dendronised polymer was mixed with QDs and then used to condense plasmid DNA (Fig. 3a). TEM of polymer–QD–pDNA complexes confirmed the formation of condensed organic structures with uniform QD labelling (Fig. 3b). The optimal binding ratios to obtain well-formed polyplexes of stable size and zeta potential were determined by dynamic light scattering (DLS). The ratios of polymer![[thin space (1/6-em)]](https://www.rsc.org/images/entities/char_2009.gif) :
:![[thin space (1/6-em)]](https://www.rsc.org/images/entities/char_2009.gif) QD, polymer
QD, polymer![[thin space (1/6-em)]](https://www.rsc.org/images/entities/char_2009.gif) :
:![[thin space (1/6-em)]](https://www.rsc.org/images/entities/char_2009.gif) pDNA, and polymer + pDNA
pDNA, and polymer + pDNA![[thin space (1/6-em)]](https://www.rsc.org/images/entities/char_2009.gif) :
:![[thin space (1/6-em)]](https://www.rsc.org/images/entities/char_2009.gif) QD (Fig. 3c, d, and e respectively) were optimised based on polyplex size and zeta potential. The polymer
QD (Fig. 3c, d, and e respectively) were optimised based on polyplex size and zeta potential. The polymer![[thin space (1/6-em)]](https://www.rsc.org/images/entities/char_2009.gif) :
:![[thin space (1/6-em)]](https://www.rsc.org/images/entities/char_2009.gif) pDNA
pDNA![[thin space (1/6-em)]](https://www.rsc.org/images/entities/char_2009.gif) :
:![[thin space (1/6-em)]](https://www.rsc.org/images/entities/char_2009.gif) QD optimal ratio was determined to be 16.5
QD optimal ratio was determined to be 16.5![[thin space (1/6-em)]](https://www.rsc.org/images/entities/char_2009.gif) :
:![[thin space (1/6-em)]](https://www.rsc.org/images/entities/char_2009.gif) 1:24, based on mass, which resulted in complexes with a hydrodynamic radius of ≈125 nm and zeta potential of ≈+7 mV. It is known that polyplexes reach a minimum stable size and should be positively charged to facilitate cellular uptake.23 Further characterisation of polyplexes showed electron-dense QDs within the structures (confirmed by high-angle annular dark-field imaging, HAADF): the material contained the expected QD elements Cd, Te, and S (Fig. 3e), and is capable of forming highly condensed electrostatic complexes with both QDs and pDNA as illustrated in Fig. 3f and g. Taken together, Fig. 3 confirms the stability and co-mixture of the optimal chosen ratio of positively-charged polymer with negatively-charged QDs and pDNA. The quantum yield of QDs following complexation decreased modestly, from 44% and 38% for the QD590 and QD690 respectively. The decrease is likely to be due to either the polymer contributing to total absorbance, or displacement of ligands from the QD surface by the dendronised polymer and introduction of surface defects.24 However, the quantum yield remained sufficiently high (11% and 20% for QD590 and QD690 respectively, Fig. S2 in ESI†) for imaging by fluorescence microscopy techniques.
1:24, based on mass, which resulted in complexes with a hydrodynamic radius of ≈125 nm and zeta potential of ≈+7 mV. It is known that polyplexes reach a minimum stable size and should be positively charged to facilitate cellular uptake.23 Further characterisation of polyplexes showed electron-dense QDs within the structures (confirmed by high-angle annular dark-field imaging, HAADF): the material contained the expected QD elements Cd, Te, and S (Fig. 3e), and is capable of forming highly condensed electrostatic complexes with both QDs and pDNA as illustrated in Fig. 3f and g. Taken together, Fig. 3 confirms the stability and co-mixture of the optimal chosen ratio of positively-charged polymer with negatively-charged QDs and pDNA. The quantum yield of QDs following complexation decreased modestly, from 44% and 38% for the QD590 and QD690 respectively. The decrease is likely to be due to either the polymer contributing to total absorbance, or displacement of ligands from the QD surface by the dendronised polymer and introduction of surface defects.24 However, the quantum yield remained sufficiently high (11% and 20% for QD590 and QD690 respectively, Fig. S2 in ESI†) for imaging by fluorescence microscopy techniques.
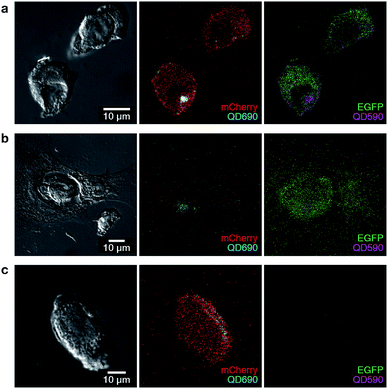
The ability to label polyplexes in this way using QDs could facilitate analysis of polyplexes during experiments requiring co-transfection. The emission of QDs can be tuned across broad ranges of the visible spectrum, and by using spectral unmixing and a short-wavelength excitation, multiple polyplexes can be imaged simultaneously, revealing the location of potentially many different polyplex assemblies within cells. To demonstrate this, we formed polyplexes from either EGFP or mCherry encoding pDNA, and labelled these with two different QDs (λem 590 and 690 nm). Polyplexes were thus formed of single pDNAs containing only one reporter each. Representative images show the ability of QDs to label and spectrally resolve individual polyplexes during co-transfection experiments (Fig. 4) while also maintaining cell viability (Fig. S4†). In Fig. 4, we show three possible outcomes based on polyplex uptake and/or reporter gene expression. Successful co-transfection of both EGFP and mCherry, with both QDs present is demonstrated in Fig. 4a. Successful internalisation of both plasmids, but unsuccessful co-transfection is demonstrated in Fig. 4b where the cell has internalised QD690 but is lacking mCherry expression. Fig. 4c demonstrates mCherry transfection with unsuccessful internalisation of EGFP-containing polyplexes, as QD590 are not present within the cell. Through these experiments, we show that quantum dots can be successfully used to label polyplexes and facilitate multispectral imaging (even with closely spaced emission peaks). Additionally, while we have used easily-visualised fluorescent reporter proteins for confirmation of the technique, this system would be particularly useful tool in the delivery of functional materials which do not encode for a fluorescent reporter. Overall, from our confocal experiments, it appeared that while polyplex uptake was a common occurrence, the presence of both EGFP and mCherry plasmids within cells (and even within the same cellular compartment) did not necessarily correlate with expression of pDNA from polyplexes and escape from endosomes appeared to be the rate-limiting step in our system, as has been reported for other polyplex systems.6,25,26 These experiments clearly demonstrate final polyplex destination has to be taken into consideration in the design and screening of non-viral reagents for co-transfection, and that QD–polymer composites as presented here are a viable method for achieving polyplex tracking.
Conclusions
Identifying limiting steps in the transfection pathway and improving current understanding of the transfection process is crucial for non-viral delivery to be a competitive option to move gene therapies into the clinic. Co-transfection of plasmids is currently a major bottleneck for the application of genome editing platforms such as CRISPR/Cas9. In summary QDs can be utilised as useful labels for tracking polyplex internalisation. Because of their relatively bright, narrow emission profiles, multispectral imaging can be used to separate signals originating from multiple polyplexes and fluorescent protein expression. Additionally, the multispectral confocal experiments suggest that the major issue in co-transfection stems from problems internal to the cell, rather than delivery to the cell. However, this method is potentially limited by the resolution of spectra and detection of low-level signal by the confocal microscope. Overall, this approach may be beneficial in future studies where multiple assemblies (such as CRISPR/Cas9, template DNA, and guide RNA) need to be simultaneously tracked in cells.Experimental
All chemicals were purchased from Sigma Aldrich and used as received unless otherwise stated. Milli-Q water was used throughout.QD synthesis
3-Mercaptopropionic acid (MPA)-capped CdTe QDs were prepared according to the method of Zou et al.22 using Cd![[thin space (1/6-em)]](https://www.rsc.org/images/entities/char_2009.gif) :
:![[thin space (1/6-em)]](https://www.rsc.org/images/entities/char_2009.gif) Te
Te![[thin space (1/6-em)]](https://www.rsc.org/images/entities/char_2009.gif) :
:![[thin space (1/6-em)]](https://www.rsc.org/images/entities/char_2009.gif) MPA = 10
MPA = 10![[thin space (1/6-em)]](https://www.rsc.org/images/entities/char_2009.gif) :
:![[thin space (1/6-em)]](https://www.rsc.org/images/entities/char_2009.gif) 1
1![[thin space (1/6-em)]](https://www.rsc.org/images/entities/char_2009.gif) :
:![[thin space (1/6-em)]](https://www.rsc.org/images/entities/char_2009.gif) 17 and pH = 11.9. Reaction mixtures were degassed prior to heating. Aliquots of the reaction mixture were taken during the course of heating (40–240 min).
17 and pH = 11.9. Reaction mixtures were degassed prior to heating. Aliquots of the reaction mixture were taken during the course of heating (40–240 min).
Polymer synthesis
Poly(2-hydroxyethyl methacrylate-ran-glycidyl methacrylate) copolymers bearing fifth-generation poly(amidoamine) dendrons were synthesised by ATRP. In a typical reaction, CuBr (100 mg, 0.70 mmol) and 2,2′-bipyridine (392 mg, 2.5 mmol) were combined in a flask. Inhibitors were removed via a basic alumina column and monomers were dissolved in MeOH at a 1![[thin space (1/6-em)]](https://www.rsc.org/images/entities/char_2009.gif) :
:![[thin space (1/6-em)]](https://www.rsc.org/images/entities/char_2009.gif) 3 ratio (monomer
3 ratio (monomer![[thin space (1/6-em)]](https://www.rsc.org/images/entities/char_2009.gif) :
:![[thin space (1/6-em)]](https://www.rsc.org/images/entities/char_2009.gif) MeOH). HEMA (12 ml, 24.7 mmol) and GMA solutions (4 ml, 7.5 mmol) were added, followed by 2-(4-morpholino)ethyl 2-bromoisobutyrate initiator (ME-Br, 210 μl, 1 mmol). Reaction was carried out at 80 °C under standard Schlenk conditions for 2 h. Copolymer composition was determined by 1H NMR (500 MHz, CD3OD), where the appearance of peaks δH 2.70 (1H, br) and 2.87 (1H, br) correspond to the epoxide moiety, confirming presence of GMA. Molecular weight and PDI of polymers were measured using GPC (methods adapted from Weaver et al.27 and Kretzmann et al.15).
MeOH). HEMA (12 ml, 24.7 mmol) and GMA solutions (4 ml, 7.5 mmol) were added, followed by 2-(4-morpholino)ethyl 2-bromoisobutyrate initiator (ME-Br, 210 μl, 1 mmol). Reaction was carried out at 80 °C under standard Schlenk conditions for 2 h. Copolymer composition was determined by 1H NMR (500 MHz, CD3OD), where the appearance of peaks δH 2.70 (1H, br) and 2.87 (1H, br) correspond to the epoxide moiety, confirming presence of GMA. Molecular weight and PDI of polymers were measured using GPC (methods adapted from Weaver et al.27 and Kretzmann et al.15).
DLS/zeta measurements
QDs (as prepared), polymer (stock solution 1 mg ml−1 in PBS), and pDNA (stock solution 100 ng μl−1 in Tris–EDTA buffer) were diluted 1![[thin space (1/6-em)]](https://www.rsc.org/images/entities/char_2009.gif) :
:![[thin space (1/6-em)]](https://www.rsc.org/images/entities/char_2009.gif) 10 in ddH2O to working concentration. In an optimal example, QDs (50 μl, 1
10 in ddH2O to working concentration. In an optimal example, QDs (50 μl, 1![[thin space (1/6-em)]](https://www.rsc.org/images/entities/char_2009.gif) :
:![[thin space (1/6-em)]](https://www.rsc.org/images/entities/char_2009.gif) 10 dilution of as-prepared solution in PBS) were combined with polymer (300 μl, 0.1 mg ml−1 in PBS), and then pDNA (1.2 μg, 100 ng μl−1 in water) was added, incubated for 30 min at room temperature, and then diluted to 800 μl in PBS and analysed (Malvern ZetaSizer Nano).
10 dilution of as-prepared solution in PBS) were combined with polymer (300 μl, 0.1 mg ml−1 in PBS), and then pDNA (1.2 μg, 100 ng μl−1 in water) was added, incubated for 30 min at room temperature, and then diluted to 800 μl in PBS and analysed (Malvern ZetaSizer Nano).
Spectrophotometric characterisation
Absorption spectra were recorded at r.t. (PerkinElmer Lambda 35). Corrected steady-state emission/excitation spectra and lifetime measurements were recorded on an Edinburgh FLSP980 spectrometer (Fig. S3†). Quantum yields were determined using the optically dilute method28 using an air-equilibrated reference solution of quinine sulfate in 0.1 M H2SO4 (Φr = 0.546).29 Emission lifetimes were determined by the single photon counting technique using a pulsed picosecond LED (EPLED 295 or 360, fwhm < 800 ps). Fluorescence lifetime curves of best fit were assessed by minimizing the reduced χ2 function and by visual inspection of weighted residuals.Transfection
MCF-7 cells (ATCC) were routinely cultured in MEMα media (Gibco) containing 10% FBS (Gibco), 1.5 g L−1 NaHCO3 (Gibco), 1× GlutaMAX (Gibco) at 37 °C in a humidified, 5% CO2 environment. For experiments, cells were seeded on poly-L-lysine coated glass coverslips. Cells were transfected under serum-free conditions as described previously.15 Transfection cocktails were prepared as for DLS/zeta measurements, except each component was diluted to working concentration in OptiMEM (Gibco) reduced serum media. For imaging, transfection cocktail was prepared by taking 100 μl QDs (1![[thin space (1/6-em)]](https://www.rsc.org/images/entities/char_2009.gif) :
:![[thin space (1/6-em)]](https://www.rsc.org/images/entities/char_2009.gif) 10 dilution of as-prepared solution) and mixing sequentially 600 μl polymer (1 mg ml−1) and then 2.4 μg DNA (100 ng μl−1). Following transfection, cells were incubated for 24 h and then fixed using 4% paraformaldehyde solution and mounted on glass slides for microscopy.
10 dilution of as-prepared solution) and mixing sequentially 600 μl polymer (1 mg ml−1) and then 2.4 μg DNA (100 ng μl−1). Following transfection, cells were incubated for 24 h and then fixed using 4% paraformaldehyde solution and mounted on glass slides for microscopy.
Microscopy
TEM was performed on a FEI Titan operating at 200 kV. Confocal microscopy was performed on a Nikon Ti-E inverted microscope with Nikon A1Si spectral detector confocal system. Images were spectrally separated using NIS-C Elements software. Slides were examined using a 60× oil-immersion (1.40 NA) objective.Conflicts of interest
There are no conflicts to declare.Acknowledgements
The authors acknowledge the Australian Research Council, National Health & Medical Research Council of Australia, and the facilities and scientific and technical assistance of the Australian Microscopy & Microanalysis Research Facility at the Centre for Microscopy, Characterisation & Analysis, The University of Western Australia, a facility funded by the University, State and Commonwealth Governments. A. M. Munshi thanks Umm Al-Qura University, Saudi Arabia for a postgraduate scholarship. J. A. Kretzmann acknowledges Cancer Council Western Australia for a PhD Top-Up scholarship.References
- T. K. Kim and J. H. Eberwine, Anal. Bioanal. Chem., 2010, 397, 3173–3178 CrossRef CAS PubMed.
- D. J. Glover, H. J. Lipps and D. A. Jans, Nat. Rev. Genet., 2005, 6, 299–310 CrossRef CAS PubMed.
- A. Elouahabi and J. Ruysschaert, Mol. Ther., 2005, 11, 336–347 CrossRef CAS PubMed.
- Y. Gao, J.-Y. Huang, J. O'Keeffe Ahern, L. Cutlar, D. Zhou, F.-H. Lin and W. Wang, Biomacromolecules, 2016, 17, 3640–3647 CrossRef CAS PubMed.
- D. W. Pack, A. S. Hoffman, S. Pun and P. S. Stayton, Nat. Rev. Drug Discovery, 2005, 4, 581–593 CrossRef CAS PubMed.
- Z. ur Rehman, D. Hoekstra and I. S. Zuhorn, ACS Nano, 2013, 7, 3767–3777 CrossRef CAS PubMed.
- R. L. Matz, B. Erickson, S. Vaidyanathan, J. F. Kukowska-Latallo, J. R. Baker, B. G. Orr and M. M. Banaszak Holl, Mol. Pharm., 2013, 10, 1306–1317 CrossRef CAS PubMed.
- H. Yin, R. L. Kanasty, A. A. Eltoukhy, A. J. Vegas, J. R. Dorkin and D. G. Anderson, Nat. Rev. Genet., 2014, 15, 541–555 CrossRef CAS PubMed.
- A. V. Ulasov, Y. V. Khramtsov, G. A. Trusov, A. A. Rosenkranz, E. D. Sverdlov and A. S. Sobolev, Mol. Ther., 2011, 19, 103–112 CrossRef CAS PubMed.
- F. A. Ran, P. D. Hsu, J. Wright, V. Agarwala, D. A. Scott and F. Zhang, Nat. Protoc., 2013, 8, 2281–2308 CrossRef CAS PubMed.
- X. Xu, Y. Tao, X. Gao, L. Zhang, X. Li, W. Zou, K. Ruan, F. Wang, G. Xu and R. Hu, Cell Discovery, 2016, 2, 16009 CrossRef CAS PubMed.
- D. A. Nelles, M. Y. Fang, M. R. O'Connell, J. L. Xu, S. J. Markmiller, J. A. Doudna and G. W. Yeo, Cell, 2016, 165, 488–496 CrossRef CAS PubMed.
- B. N. G. Giepmans, S. R. Adams, M. H. Ellisman and R. Y. Tsien, Science, 2006, 312, 217–224 CrossRef CAS PubMed.
- K. Rombouts, K. Braeckmans and K. Remaut, Bioconjugate Chem., 2016, 27, 280–297 CrossRef CAS PubMed.
- J. A. Kretzmann, D. Ho, C. W. Evans, J. H. C. Plani-Lam, B. Garcia-Bloj, A. E. Mohamed, M. L. O'Mara, E. Ford, D. E. K. Tan, R. Lister, P. Blancafort, M. Norret and K. S. Iyer, Chem. Sci., 2017, 2923–2930 RSC.
- U. Lächelt and E. Wagner, Chem. Rev., 2015, 115, 11043–11078 CrossRef PubMed.
- J. Haensler and F. C. Szoka, Bioconjugate Chem., 1993, 4, 372–379 CrossRef CAS PubMed.
- P. Midoux and C. Pichon, in Pharmaceutical Perspectives of Nucleic Acid-Based Therapy, ed. R. I. Mahato and S. W. Kim, Taylor & Francis, London, 2002, pp. 304–335 Search PubMed.
- W. C. Chan and S. Nie, Science, 1998, 281, 2016–2018 CrossRef CAS PubMed.
- M. Bruchez Jr, M. Moronne, P. Gin, S. Weiss and A. P. Alivisatos, Science, 1998, 281, 2013–2016 CrossRef CAS PubMed.
- H. H. Chen, Y.-P. Ho, X. Jiang, H.-Q. Mao, T.-H. Wang and K. W. Leong, Mol. Ther., 2008, 16, 324–332 CrossRef CAS PubMed.
- L. Zou, Z. Gu, N. Zhang, Y. Zhang, Z. Fang, W. Zhu and X. Zhong, J. Mater. Chem., 2008, 18, 2807 RSC.
- H. Debus, P. Baumhof, J. Probst and T. Kissel, J. Controlled Release, 2010, 148, 334–343 CrossRef CAS PubMed.
- I. Cho, H. Jung, B. G. Jeong, J. H. Chang, Y. Kim, K. Char, D. C. Lee, C. Lee, J. Cho and W. K. Bae, ACS Nano, 2017, 11, 684–692 CrossRef CAS PubMed.
- A. Akinc, M. Thomas, A. M. Klibanov and R. Langer, J. Gene Med., 2005, 7, 657–663 CrossRef CAS PubMed.
- H. Yan, O. P. Oommen, D. Yu, J. Hilborn, H. Qian and O. P. Varghese, Adv. Funct. Mater., 2015, 25, 3907–3915 CrossRef CAS.
- J. V. M. Weaver, I. Bannister, K. L. Robinson, X. Bories-Azeau, S. P. Armes, M. Smallridge and P. McKenna, Macromolecules, 2004, 37, 2395–2403 CrossRef CAS.
- G. A. Crosby and J. N. Demas, J. Phys. Chem., 1971, 75, 991–1024 CrossRef CAS.
- D. F. Eaton, Pure Appl. Chem., 1988, 60, 1107–1114 CAS.
Footnotes |
| † Electronic supplementary information (ESI) available: Detailed chemical synthesis, QD characterisation. See DOI: 10.1039/c9ra03518d |
| ‡ Department of Chemistry, Faculty of Applied Science, Umm Al-Qura University, Taif Road, 21955, Mecca, Makkah Province, Saudi Arabia. |
| This journal is © The Royal Society of Chemistry 2019 |


