DOI:
10.1039/C9RA03531A
(Paper)
RSC Adv., 2019,
9, 22764-22771
TiO2/Fe2O3 heterostructures with enhanced photocatalytic reduction of Cr(VI) under visible light irradiation†
Received
11th May 2019
, Accepted 13th July 2019
First published on 23rd July 2019
Abstract
We report a study on the synthesis of TiO2/Fe2O3 (TF) nanocomposites and their photocatalytic performance under visible-light irradiation. The characterization of structure and morphology shows that hematite Fe2O3 was deposited on anatase TiO2 nanoparticles with particle sizes in the range of 20–100 nm. In contrast to pure TiO2 and pure Fe2O3, the nanocomposites exhibited remarkable photocatalytic activity. For example, the photoreduction efficiency of TF0.5 reaches 100% for a 100 ppm Cr(VI) solution within 160 minutes. The photochemical properties were studied by various methods. Finally, we conclude that the excellent performance of the photocatalysts is mainly attributed to two aspects: the enhanced absorption of visible light and the synergistic effect of an internal electric field at the heterojunction and citric acid for promoting the separation of electron–hole pairs.
Introduction
Photocatalysis, in which an artificial photosynthetic system is set up for the conversion of solar energy to chemical energy, has been of great significance in environmental conservation and energy utilization.1,2 Over the last few decades, research in the area has been focusing on improving photochemical quantum yields. With this objective, various photocatalysts, especially semiconductor photocatalysts (TiO2,3,4 Fe2O3,5,6 CuS,7 MoS2,8,9 g-C3N4,10 Ag2O,11 WO3,12 etc.) have received great attention. Among these photocatalysts, TiO2 and its composites exhibit great potential due to their unique features (i.e. non-toxicity, low cost, high chemical inertness and photostability13–15). However, there are two intrinsic defects limiting the practical application of TiO2: (i) its wide band gap energy (3.0–3.2 eV) restricts its response to visible light; (ii) the rapid recombination of photogenerated electron–hole pairs, which leads to the decrease of its photocatalytic activity.15 Therefore, much effort has been devoted to solving these problems.
One solution to overcome the defects is to construct heterojunction photocatalysts. Due to the features of the heterojunction, the spatial separation of electron–hole pairs is naturally in place,16 which prevents the rapid recombination of photogenerated electron–hole pairs. In spite of the abovementioned advantage, heterojunction photocatalysts can extend the light responsive range through coupling with narrow band gap semiconductors.17,18 In order to construct a suitable TiO2-based heterojunction photocatalyst, the matching of energy levels between the two components is crucial, that is, the conduction band edge of the narrow band gap semiconductor is higher than that of TiO2.19 Fe2O3, as a highly active photocatalyst with a band gap of 2.2 eV, seems to be a good choice except it has a lower conduction band edge.20–22 However, the Fermi level (EF) of Fe2O3 is lower than that of TiO2.23 Therefore, band bending may occur so that the conduction band edge of Fe2O3 is higher than that of TiO2 when their Fermi levels are equalized.24 In addition, the internal electric field will also be constructed by Fermi level alignment, which further promotes the separation of electron–hole pairs. In short, it is promising for TiO2 coupled with Fe2O3 to be a desired heterojunction photocatalyst.
In this study, we have developed a facile synthetic strategy (Scheme 1) to fabricate sheet-like TiO2/Fe2O3 nanocomposites for photoreduction Cr(VI). Specifically, TiO2 nanoparticles were synthesised by a solvothermal approach in the mixed solution of HF and N,N-dimethyl formamide (DMF). Iron ions particularly adsorb on the negatively charged TiO2 nanoparticles by electrostatic interaction. As a result, Fe2O3 was deposited on the surface of TiO2 by hydrothermal method. After calcination, TiO2/Fe2O3 nanocomposites formed. The as-prepared TiO2/Fe2O3 composites as a photocatalyst exhibited excellent performance for photoreduction of Cr(VI).
 |
| | Scheme 1 Schematic diagram of fabricating TiO2/Fe2O3 nanocomposites. | |
Experimental sections
Chemicals
Tetrabutyl titanate (TBT, 99.0%), N,N-dimethyl formamide (DMF, 99.5%), hydrofluoric acid (HF, 40%, w/w), ferric sulfate (Fe2(SO4)3, 99.0%), urea (CON2H4, 99.0%), potassium dichromate (K2Cr2O7, 99.0%) and citric acid were purchased from Zhiyuan Chemical Reagent Co., Ltd (Tianjin, China), and used as received. Deionized water was used in all experiments.
Synthesis of TiO2 nanoparticles
We modified a hydrothermal method reported previously to synthesize TiO2 nanoparticles.25,26 TBT (5.0 mL) was firstly dissolved in 5.0 mL of DMF and then mixed with 1.0 mL of HF to form white suspension, which was subsequently transferred into a 25 mL Teflon-lined autoclave and reacted for 24 hours at 180 °C. A white product was collected and washed with deionized water until the pH of the suspension is about 7.0, and then washed with ethanol for several times. The product was dried at 80 °C for 12 hours, and afterwards annealed at 400 °C in air for 2 hours to obtain TiO2.
Preparation of TiO2/Fe2O3 nanocomposites
Fe2(SO4)3 (0.2 g, 0.5 mmol) was dissolved in 70 mL of deionized water, then 0.5 g of as-prepared TiO2 was added to the solution and mixed under vigorous stirring for 12 hours. Following this, 0.18 g of urea (the molar ratio of urea to Fe2(SO4)3 is 6![[thin space (1/6-em)]](https://www.rsc.org/images/entities/char_2009.gif) :
:![[thin space (1/6-em)]](https://www.rsc.org/images/entities/char_2009.gif) 1) was added into the suspension, which was then transferred into a 100 mL Teflon-lined autoclave and maintained at 160 °C for 5 hours. The obtained precipitates were washed several times with water and ethanol and dried at 80 °C for 8 hours. The dried powder was calcined in a tube furnace at 500 °C for 2 hours with a heating rate of 5 °C min−1 in Ar atmosphere. After cooling down to room temperature, the light red TiO2/Fe2O3 powder was obtained and named as TF0.5. In comparison, pure Fe2O3 and a series of products with different content of Fe2O3 were prepared under the same conditions. The products are noted as TFx where x represents the amount of Fe2(SO4)3 in mmol. For example, TF2.0 means that the amount of Fe2(SO4)3 is 2.0 mmol in the reaction.
1) was added into the suspension, which was then transferred into a 100 mL Teflon-lined autoclave and maintained at 160 °C for 5 hours. The obtained precipitates were washed several times with water and ethanol and dried at 80 °C for 8 hours. The dried powder was calcined in a tube furnace at 500 °C for 2 hours with a heating rate of 5 °C min−1 in Ar atmosphere. After cooling down to room temperature, the light red TiO2/Fe2O3 powder was obtained and named as TF0.5. In comparison, pure Fe2O3 and a series of products with different content of Fe2O3 were prepared under the same conditions. The products are noted as TFx where x represents the amount of Fe2(SO4)3 in mmol. For example, TF2.0 means that the amount of Fe2(SO4)3 is 2.0 mmol in the reaction.
Characterization of TiO2/Fe2O3 nanocomposites
The morphology of TiO2/Fe2O3 nanocomposites was observed by scanning electron microscopy (SEM, LEO 1430VP, Germany), transmission electron microscopy (TEM, JEM2100F, Japan). Scanning transmission electron microscopy (STEM) images, selected area electron diffraction (SAED) patterns and high-angle annular dark-field scanning transmission electron microscopy (HAADF-STEM) images were obtained on a high-resolution transmission electron microscopy (HR-TEM, FEI Tecnai G2 F20, America) with HAADF detector operator at 300 kV. BET specific surface area was measured at 77.5 K on a nitrogen adsorption apparatus (Micromeritics ASAP 2460, America) after samples were vacuum-dried at 180 °C overnight. The crystal structure of the composites was confirmed by X-ray diffractometer (XRD, D8 Focus-ADVANCE, Germany Bruker) with Cu source radiation (λ = 0.15418 nm). X-ray photoelectron spectroscopy (XPS, ESCALAB 250Xi, American Thermo Fisher Scientific) equipped with Al source radiation (1486.6 eV) was used to analyse bonding information of the composites. The UV-vis diffuse reflectance (UV-vis DRS) spectra of the composites over a range of 200–800 nm were tested by a U-3010 spectrophotometer using BaSO4 as a standard reference. The photoluminescence (PL) spectra of the composites were obtained by using the fluorescence spectrophotometer (F-4500 FL) with an excitation wavelength of 325 nm. Under visible light irradiation (λ > 420 nm), the electron spin response (ESR) signals of superoxide radicals spin-trapped by spin-trapped reagent 5,5-dimethyl-L-pyrroline N-oxide (DMPO) were investigated on a Bruker EMXmicro-6/1/P/L (Karlsruhe, Germany) spectrometer.
Photocatalytic reduction of Cr(VI)
The photocatalytic perform of TiO2/Fe2O3 nanocomposites was investigated by the reduction of Cr(VI) in acid conditions with visible-light irradiation. The photocatalytic measurements were carried out in the photocatalytic reaction apparatus (XPA-7, Xujiang). Typically, 50 mL of 100 ppm K2Cr2O7 solution and 1 mL of 100 mg mL−1 citric acid solution were mixed in a quartz tube, and then 50 mg of photocatalyst was dispersed in the solution. The mixture was treated in an ultrasonic bath for 5 minutes. The suspension was stirred at 900 rpm for 40 minutes in dark to reach equilibrium of adsorption. Subsequently, the suspension was irradiated by a 500 W Au halide lamp equipped with cutoff filters (λ > 420 nm). A sample of 2 mL suspension was collected at a 20 minute interval. Then the collected suspension was filtered using 0.45 μm filter membrane to remove photocatalysts. The concentration of Cr(VI) was determined by UV-vis spectrometer (UV-2550, Shimadzu) after the filtrate was treated with diphenylcarbonylhydrazine.
Photoelectrochemical measurements
The transient photocurrent responses and electrochemical impedance spectroscopy (EIS) measurements of the samples were operated on a CHI660E electrochemical workstation equipped with a standard three-electrode system. A Pt wire, an Ag/AgCl electrode and 0.5 M Na2SO4 solution (pH = 6.8) were used as the counter electrode, the reference electrode and the electrolyte solution, respectively. The preparation of the working electrode is as follows. The photocatalyst (20 mg) was ultrasonically dispersed into 0.5 mL of deionized water to obtain the slurry. The slurry (200 μL) was evenly spread on a fluorine-doped tin oxide (FTO) glass and dried at room temperature, subsequently dried at 120 °C for 12 hours in vacuum. The area of samples daubed on the FTO glass is 1.0 cm2. A 300 W xenon lamp (PL-X300D) equipped with a cutoff filter (λ > 420 nm) was used as a source of visible light.
Results and discussion
Morphologies and structures of TiO2/Fe2O3 nanocomposites
The TEM images show that pure TiO2 exhibits irregular a sheet-like structure with the size of 20–100 nm (Fig. 1a) and pure Fe2O3 exhibits a flower-like structure with the size of about 500 nm (Fig. 1c). However, the TEM images of TF nanocomposites including TF0.5 (Fig. 1b), TF0.1 and TF2.0 (Fig. S1†) show only the sheet-like structure rather than the flower-like structure. This result could be understood as TiO2 adsorbing iron ions restricts its aggregation and growth, and additionally urea solution slowly releases OH− at high temperature, which slows down the hydrolysis rate of Fe3+. In addition, TiO2 nanoparticles are getting more and more agglomerated with the increase of Fe2O3 on TiO2 sheets from TF0.1 to TF2.0, which can be understood by the electrostatic interaction between negatively charged TiO2 and positively charged Fe2O3. The quantitative characterization of the surface charge was measured by zeta potential (Table S1 in ESI†). The zeta potential of pure TiO2, TF0.1, TF0.2, TF0.5, TF1.0, TF2.0 and pure Fe2O3 are −5.96 mV, 5.07 mV, 9.76 mV, 12.18 mV, 18.68 mV, 17.92 mV and 7.98 mV, respectively. Clearly, the surface charge increases with the amount of positively charged Fe2O3. The positive charge on the TF composites indicates that the surface of the composites is covered by Fe2O3 nanoparticles. The SEM image (Fig. S2†) further reveals that the aggregation of TF0.5 nanocomposite is composited of many stacked nanoparticles of smaller size.
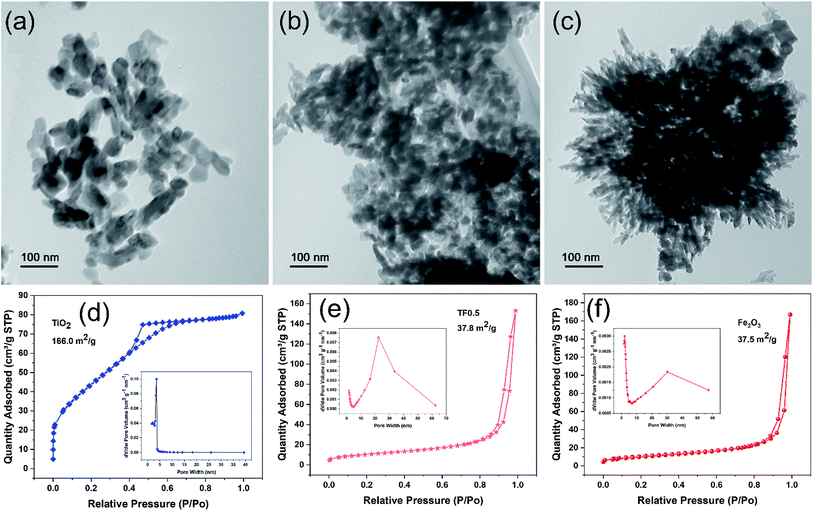 |
| | Fig. 1 (a–c) The TEM images of TiO2, TF0.5 and Fe2O3, and their corresponding (d–f) N2 adsorption–desorption isotherm and pore size distribution curves. | |
Fig. 1 (d–f) present N2 adsorption–desorption isotherm and pore size distribution of TiO2, TF0.5 and Fe2O3. Obvious, the typical hysteresis loops indicate the capillary condensation associated with pores between the nanoparticles and suggest that TiO2, TF0.5 and Fe2O3 are mesoporous materials. Their average pore sizes by BJH desorption are 2.97, 24.90 and 27.98 nm, respectively. The corresponding BET surface area are calculated to be 166.0, 37.8 and 37.5 m2 g−1, respectively. These results show that pure TiO2 has the largest specific surface area and the smallest pore, while TF0.5 and Fe2O3 have similar specific surface area and pore size. It can be proved that TiO2 and Fe2O3 have strong interface attraction and gather together, which is consistent with the TEM results.
The HRTEM images and fast Fourier transform (FFT) patterns (Fig. 2) were used to resolve the lattice structures of TiO2, TF0.5 and Fe2O3 and the difference in morphology for Fe2O3 deposited on the surface of TiO2. Multiple crystal particle with different orientations in the HRTEM image of TiO2 (Fig. 2a) proves that the prepared TiO2 is polycrystalline, which agrees with the result of the FFT pattern (Fig. 2d). The FFT pattern of Fe2O3 in Fig. 2f demonstrates its single crystal structure sitting against a plane perpendicular to the [001] zone axis. As shown in Fig. 2c, the lattice fringe spacing of 0.25 nm can be indexed to six side facets of {110} of hexagonal Fe2O3.27 Fig. 2e and S3† show that the structure of TF0.5 is polycrystalline, which is consistent with the observation in Fig. 2b, as an area with several crystalline domains is observed, including the {101} facet of anatase TiO2 (d = 0.35 nm)28 and the {104} facet of hematite Fe2O3 (d = 0.27 nm). This result illustrates that Fe2O3 was successfully deposited on the surface of TiO2 and was in direct contact with each other.
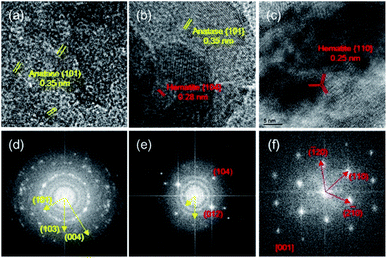 |
| | Fig. 2 HRTEM images of (a) TiO2, (b) TF0.5 and (c) Fe2O3, and their corresponding fast Fourier transform (FFT) patterns (d–f). | |
The crystal structures of TiO2 synthesized at 180 °C, TF0.5 and Fe2O3 have been confirmed by XRD (Fig. 3a). The diffraction peaks of TiO2 and Fe2O3 could be indexed to anatase phase TiO2 (JCPDS no. 21-1272) and hematite phase Fe2O3 (JCPDS no. 33-0664), and the phase is pure. Compared to the diffraction peaks of TiO2, two new peaks at 2θ = 33.2° and 35.8° appear on the XRD pattern of TF0.5 nanocomposites, corresponding to the (104) and (110) planes of hematite Fe2O3, respectively. The increase of Fe2O3 content from TF0.1 to TF2.0 leads to the intensity enhancement of two characteristic peaks of hematite Fe2O3 on the XRD patterns (Fig. 3b). Moreover, the reference intensity ratio (RIR) method29,30 is used to analyze the weight fraction of the two crystal phases in the composite. The weight fractions of hematite Fe2O3 from TF0.1 to TF2.0 are 4.5%, 5.6%, 11.0%, 19.7% and 38.9%, respectively (also see Table S1†)
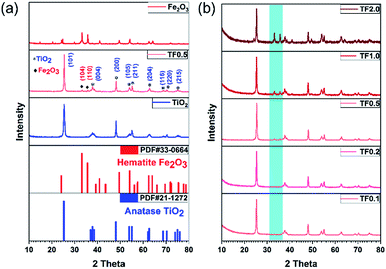 |
| | Fig. 3 (a) XRD patterns of TiO2, TF0.5 and Fe2O3. (b) Comparison of XRD patterns of TF0.1, TF0.2, TF0.5, TF1.0 and TF2.0. | |
TEM and element mapping images (Fig. 4a–e) were used to investigate the microstructure and the element distribution of the as-prepared photocatalysts. The maps of HAADF (Fig. 4b), Ti (Fig. 4c), Fe (Fig. 4d) and O (Fig. 4e) match very well with the silhouette of black nanoparticles shown in Fig. 4a, which provides a clear evidence that Fe2O3 is homogenously deposited on TiO2. Evidently, the mapping profile of Fe is distinct from those of Ti and O in distribution, as a result of low content of Fe2O3 in TF0.5. The major elemental compositions of TF0.5 are further revealed by energy dispersive spectroscopy (EDS). All elements (Ti, Fe, C and O) were detected in TF0.5. As shown in Fig. 4f, the main signals of O, C, Ti and Fe elements are observed in the EDS spectrum of TF0.5, and the corresponding weight fractions are 37.0%, 32.3%, 30.3% and 0.4%, respectively.
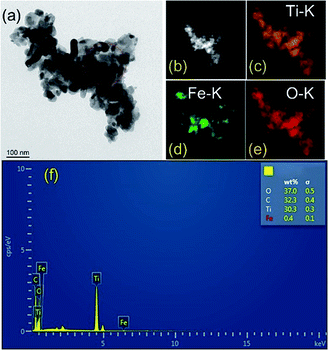 |
| | Fig. 4 (a) The TEM image, (b) HAADF-STEM image, (c) Ti, (d) Fe and (e) O elements mapping images and (f) EDS spectrum of TF0.5. | |
The element composition and chemical states on the surface of pure TiO2 and TF0.5 nanocomposites can be determined by XPS. The XPS survey spectra (Fig. 5a) of pure TiO2 and TF0.5 shows the presence of Ti, O, C and F elements on their surfaces; while, Fe element exists only in TF0.5 in addition to the four elements. In the high-resolution Fe 2p spectrum (Fig. 5b) of TF0.5, two binding energy peaks are found at 711.0 and 724.5 eV, corresponding to Fe 2p3/2 and Fe 2p1/2, respectively. The difference of two peaks (ΔBE) is 13.5 eV, which is the characteristics of Fe(III).31,32 In the high-resolution Ti 2p spectra (Fig. 5c) of TF0.5 and TiO2, the ΔBE of Ti 2p3/2 and Ti 2p1/2 is 5.6 eV, which features Ti(IV).33–35 Moreover, the two peaks of binding energy of Ti 2p1/2 and Ti 2p3/2 of TF0.5 are 464.3 eV and 458.7 eV, respectively, which are lower than those of pure TiO2. This decrease of ΔBE for Ti(IV) may provide an indirect evidence of forming the Ti–O–Fe bond since the internal electric field promotes the electron transfer from Fe2O3 to TiO2.33,36 Two peaks of O 1s spectrum (Fig. 5d) of TF0.5 appear at 530.0 eV and 531.6 eV, corresponding to lattice oxygen and O–H bond,37 respectively. However, the binding energy of O–H bond in TF0.5 is lower than that in TiO2, which further confirms the formation of the Ti–O–Fe bond.
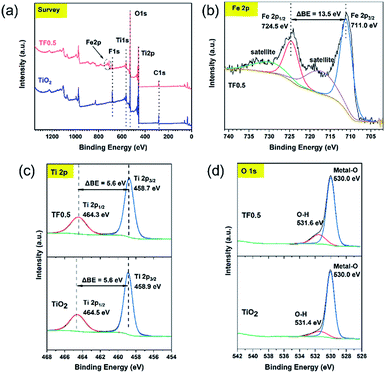 |
| | Fig. 5 (a) The survey spectra of TiO2 and TF0.5, and the high-resolution XPS spectra of (b) Fe 2p, (c) Ti 2p and (d) O 1s. | |
Light absorption of photocatalysts
The band energy structures of semiconducting materials are key factors to their optoelectronic properties.38 Therefore, it is crucial to study light absorption ability to probe the band structure of the materials before photocatalytic experiments. The simplest method for this purpose is to measure its optical absorption spectrum. UV-vis diffuse reflectance spectra (UV-vis DRS) were obtained in Fig. 6a. Pure Fe2O3 and its composites with different amount of Fe2O3 exhibit nearly same absorption edge. Pure TiO2 shows almost no absorption in visible region; while, the TiO2/Fe2O3 nanocomposites showed increase in absorption with the amount of Fe2O3 in the composites, implying that the response of the composites to visible light can be ascribed to the light absorption of Fe2O3.
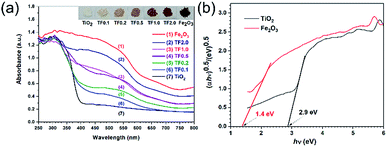 |
| | Fig. 6 (a) UV-vis diffuse reflectance spectra and (b) plots of (αhν)0.5 versus photon energy for calculation of bandgap energies of TiO2 and Fe2O3. | |
The optical band gap energy is determined by the Tauc equation:39–43
where
A is proportionality constant;
h is Planck's constant;
ν is the photon's frequency;
Eg is energy of optical band gap;
α is absorption coefficient; the value of the exponent represents the character of the electronic transition, whether direct or indirect:
n is 0.5 for direct band gap materials or 2 for indirect band gap materials. The bandgap is estimated from the intercept of the extrapolated linear fit to the Tauc plot.
38 Both TiO
2 and Fe
2O
3 is well known to have an indirect band gap,
44–46 so we plotted (
αhν)
0.5 versus photon energy to calculate the bandgap energies of TiO
2 and Fe
2O
3 (
Fig. 6b). The intercepts of the Tauc plot give the optical band gaps energies, which are 2.9, and 1.4 eV for TiO
2 and Fe
2O
3, respectively. Based on the results, the TiO
2/Fe
2O
3 nanocomposites with a narrow band gap are expected to exhibit visible-light driven photocatalytic activity.
Photoreduction Cr(VI) of as-prepared photocatalysts
Photocatalytic reduction of Cr(VI) was carried out to compare the photocatalytic activity for the as-prepared photocatalysts under visible light irradiation (Fig. 7a). During the dark adsorption process of 40 minutes, there was no decrease in the concentration of Cr(VI), which indicated that there was no adsorption of Cr(VI) on the nanocomposites and no chemical reaction for Cr(VI). Therefore, the subsequent decrease of Cr(VI) concentration is not affected by adsorption and redox reaction, while, only depends on the photocatalytic reduction. Based on the trend of C/C0 curves, we find that TF0.5 has the highest photocatalytic efficiency, and the reduction efficiency of Cr(VI) achieves 100% within 160 minutes. Cyclic photoreduction of Cr(VI) for TF0.5 has been conducted to investigate its photochemical stability. After five cycles of photoreduction, the TF0.5 photocatalyst did not exhibit any significant loss of photocatalytic activity (Fig. 7b). The crystal structure of TF0.5 remained the same after cyclic experiments (see the XRD patterns in Fig. S4†). But there was a significant drop in the sixth cycle, which was attributed to the loss of Fe2O3. This drop in photocatalytic activity is understood by photocorrosion, where a part of Fe2O3 has been reduced to Fe(II) in the process of photoreduction Cr(VI).47,48
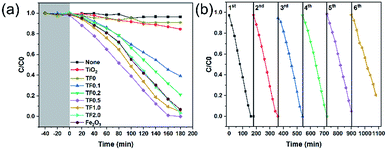 |
| | Fig. 7 (a) Photocatalytic performances of TiO2, TF0, TF0.1, TF0.2, TF0.5, TF1.0, TF2.0 and Fe2O3 for reduction of Cr(VI) under visible light irradiation. (b) Cyclic photoreduction Cr(VI) experiments of TF0.5. | |
Electronic and optical properties of photocatalysts
To investigate the photoelectrochemical properties, the electrochemical impedance spectra (EIS) of photocatalysts and the transient photocurrent responses of TiO2, TF0.5 and Fe2O3 are given in Fig. 8. As shown in Fig. 8a, the alternating cycles of visible light irradiation and dark process of photocatalysts are at a fixed interval of 30 seconds. The photocurrent density of the photocatalysts under visible-light irradiation obviously increases in comparison to the dark current density. The photocurrent density of a photocatalyst is correlated to its photocatalytic ability as higher photocurrent density indicates high separation efficiency of photogenerated carries.49 TF0.5 shows enhanced photocurrent density as about 1.4 μA cm2, indicating its enhanced charge separation efficiency. In the recycles of turning on and off the light, the current density of TF0.5 continuously decrease to 1.3 μA cm2, which is ascribed to the loss Fe2O3 as demonstrated in the photocatalytic recycle experiment. Fig. 8b shows electrochemical impedance spectra of TiO2, TF0.5 and Fe2O3. All spectra display a circular arc at a frequency of 10−2 to 105 Hz, indicating the charge transfer process. The radius of the arc can be explained as the resistance of charge transfer.50 TF0.5 has smaller radius than other photocatalysts, meaning an easier charge transfer between TiO2 and Fe2O3.
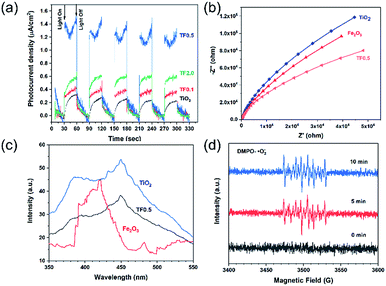 |
| | Fig. 8 (a) Photogenerated currents density curves, (b) EIS plots, (c) PL spectra of TiO2, TF0.5 and Fe2O3, and (d) ESR signals of DMPO-·O2−for TF0.5 irradiated for 0, 5 and 10 min by 300 W Xe lamp. | |
Efficient separation of electron–hole pairs determines the photocatalytic activity of photocatalysts. The recombination of electron–hole pairs lead to fluorescence emission, so photoluminescence (PL) spectroscopy is an important means for probing the extent of charge separation as the lower PL intensity of the catalyst indicates the lower recombination rate and higher photocatalytic activity.51,52 Fig. 8c shows the emission intensity of PL for the as-prepared photocatalysts with an excitation wavelength of 325 nm. The pure TiO2 show a high PL intensity at 415 nm and 470 nm but the PL intensity decreases when TiO2 forms composites with Fe2O3, demonstrating the efficient charge separation of the composites. The PL intensity of TF0.5 is the lowest, which is in accord with its high photocatalytic activity. In short, the results of the PL spectra, the transient photocurrent responses and the EIS spectra of the photocatalysts are in consistence with the photocatalytic performance.
Photocatalytic mechanism
The band structures of TiO2 and Fe2O3 were obtained by the Mott–Schottky plots (Fig. S5†). TiO2 shows a positive slope, indicating the n-type semiconductor characteristic of TiO2; on the contrary, Fe2O3 shows a negative slope, indicating the p-type semiconductor characteristic of Fe2O3. The flat band position of semiconductors is the intercept on the x axis of the extrapolated linear fit of the Mott–Schottky plot and is close to their conduction band (CB) position.53,54 Hence, the estimated CB positions of TiO2 and Fe2O3 are −0.84 and −0.32 V, respectively (vs. Ag/AgCl, pH ![[thin space (1/6-em)]](https://www.rsc.org/images/entities/char_2009.gif) = 6.8). These two potentials are converted to −0.22 and +0.30
= 6.8). These two potentials are converted to −0.22 and +0.30![[thin space (1/6-em)]](https://www.rsc.org/images/entities/char_2009.gif) V (vs. NHE, pH = 0). Combined with the bandgap of TiO2 (2.9 eV) and Fe2O3 (1.4 eV), the valence band (VB) positions of TiO2 and Fe2O3 are +2.68 and +1.70 V, respectively. Based on the above results and discussion, a reasonable photocatalytic mechanism of TiO2/Fe2O3 nanocomposites is proposed (Scheme 2). The relative location of the EF of TiO2 and Fe2O3 is concluded that the EF of Fe2O3 is lower than that of TiO2.23 When Fe2O3 contacts TiO2 to form heterojunction, to acquire an equalized Fermi level, the electrons flow from TiO2 to Fe2O3 resulting in a positive area forming in the heterojunction adjacent to TiO2; whereas the holes flow from Fe2O3 to TiO2 resulting in a negative area forming in the heterojunction adjacent to Fe2O3. Meanwhile, an internal electric field directed from TiO2 to Fe2O3 is constructed, which leads to the opposite direction of charge carries diffusion. Finally, the photogenerated electrons migrate from Fe2O3 to TiO2 and holes migrate from TiO2 to Fe2O3 under visible light irradiation. As a result of charge carries migration, electrons accumulate mainly on the CB of TiO2 and then reduce dissolved oxygen molecules to yield superoxide radical (·O2−), which leads to the photoreduction Cr(VI) on TiO2. In addition, ESR analyses (Fig. 8d) were used to further investigate the existence of ·O2− species in the photocatalytic reaction systems of TF0.5. No obvious signal could be observed for TF0.5 in dark. However, six characteristic peaks of the DMPO-·O2− appeared in ESR curves of TF0.5 after 5 min irradiation. It can be concluded that photo-induced electron–hole pairs in TF0.5 has been effectively separated. Generally, Cr(VI) could be reduced by either photogenerated electrons (e−) or ·O2−. The feasible reaction steps (1)–(9) in the photocatalytic process are as follows:55–57
V (vs. NHE, pH = 0). Combined with the bandgap of TiO2 (2.9 eV) and Fe2O3 (1.4 eV), the valence band (VB) positions of TiO2 and Fe2O3 are +2.68 and +1.70 V, respectively. Based on the above results and discussion, a reasonable photocatalytic mechanism of TiO2/Fe2O3 nanocomposites is proposed (Scheme 2). The relative location of the EF of TiO2 and Fe2O3 is concluded that the EF of Fe2O3 is lower than that of TiO2.23 When Fe2O3 contacts TiO2 to form heterojunction, to acquire an equalized Fermi level, the electrons flow from TiO2 to Fe2O3 resulting in a positive area forming in the heterojunction adjacent to TiO2; whereas the holes flow from Fe2O3 to TiO2 resulting in a negative area forming in the heterojunction adjacent to Fe2O3. Meanwhile, an internal electric field directed from TiO2 to Fe2O3 is constructed, which leads to the opposite direction of charge carries diffusion. Finally, the photogenerated electrons migrate from Fe2O3 to TiO2 and holes migrate from TiO2 to Fe2O3 under visible light irradiation. As a result of charge carries migration, electrons accumulate mainly on the CB of TiO2 and then reduce dissolved oxygen molecules to yield superoxide radical (·O2−), which leads to the photoreduction Cr(VI) on TiO2. In addition, ESR analyses (Fig. 8d) were used to further investigate the existence of ·O2− species in the photocatalytic reaction systems of TF0.5. No obvious signal could be observed for TF0.5 in dark. However, six characteristic peaks of the DMPO-·O2− appeared in ESR curves of TF0.5 after 5 min irradiation. It can be concluded that photo-induced electron–hole pairs in TF0.5 has been effectively separated. Generally, Cr(VI) could be reduced by either photogenerated electrons (e−) or ·O2−. The feasible reaction steps (1)–(9) in the photocatalytic process are as follows:55–57| | |
·O2− + H2O → HOO· + OH−
| (5) |
| | |
HOO· + H2O → H2O2 + ·OH
| (6) |
| | |
e− or ·O2− + Cr(VI) → Cr(III)
| (8) |
| | |
·OH or h+ + citric acid → CO2 + H2O
| (9) |
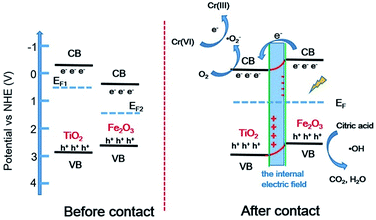 |
| | Scheme 2 Proposed photocatalytic mechanism diagram of TiO2/Fe2O3 heterojunction photocatalysts. | |
Fig. S6† shows the effect of citric acid on photoreduction Cr(VI) of TF0.5. Obviously, TF0.5 hardly reduces Cr(VI) without citric acid. Citric acid plays an important role in photocatalysis as it can capture holes (h+) as a sacrificial reagent to restrain the recombination of electron–hole pairs.58,59 It is shown that the synergistic effect of the internal electric field at the heterojunction and citric acid promotes the separation of electron–hole pairs, enhancing the photocatalytic activity of the TiO2/Fe2O3 nanocomposites.
Conclusions
In summary, we successfully prepared TiO2/Fe2O3 nanocomposites by hydrothermal methods and deposited Fe2O3 on the surface of TiO2. The introduction of Fe2O3 enhanced the visible light absorption of the composites. The construction of heterojunction structures and internal electric fields at the interface of the composites promotes the separation of electron–hole pairs, and citric acid consumes holes for restraining the recombination of electron–hole pairs. With the synergistic effect of these processes, the as-prepared photocatalysts performed high photocatalytic efficiency in the process of photoreduction Cr(VI), for example, the efficiency of reducing Cr(VI) to Cr(III) in TF0.5 reached 100% within 160 minutes.
Conflicts of interest
There are no conflicts to declare.
Acknowledgements
This research was financially supported by the National Natural Science Foundation of China (No. 21868036), the National Natural Science Foundation of Xinjiang Uyghur Autonomous Region (No. 2016D01C037) and the Project of Xinjiang Education Office (No. XJEDU20171004). We thank the Thousand Talents program. We thank the test platform in the Ministry Key Laboratory of Oil and Gas Fine Chemicals for assistance with the UV-vis spectroscopic measurement. The authors acknowledge facilities and staff at the Physical and Chemical Testing Centre of Xinjiang University.
Notes and references
- K. Nakata, T. Ochiai, T. Murakami and A. Fujishima, Electrochim. Acta, 2012, 84, 103–111 CrossRef CAS.
- W. J. Wang, G. Y. Li, D. H. Xia, T. C. An, H. J. Zhao and P. K. Wong, Environ. Sci.: Nano, 2017, 4, 782–799 RSC.
- H. Zhang, X. J. Lv, Y. M. Li, Y. Wang and J. H. Li, ACS Nano, 2010, 4, 380–386 CrossRef CAS PubMed.
- B. Liu, A. Khare and E. S. Aydil, ACS Appl. Mater. Interfaces, 2011, 3, 4444–4450 CrossRef CAS PubMed.
- A. Amarjargal, Z. Jiang, L. D. Tijing, C. H. Park, I. T. Im and C. S. Kim, J. Alloys Compd., 2013, 580, 143–147 CrossRef CAS.
- A. Banisharif, A. A. Khodadadi, Y. Mortazavi, A. Anaraki Firooz, J. Beheshtian, S. Agah and S. Menbari, Appl. Catal., B, 2015, 165, 209–221 CrossRef CAS.
- S. Khanchandani, S. Kumar and A. K. Ganguli, ACS Sustainable Chem. Eng., 2016, 4, 1487–1499 CrossRef CAS.
- C. C. Wang, Y. Zhan and Z. Y. Wang, ChemistrySelect, 2018, 3, 1713–1718 CrossRef CAS.
- Q. J. Xiang, J. G. Yu and M. Jaroniec, J. Am. Chem. Soc., 2012, 134, 6575–6578 CrossRef CAS PubMed.
- J. Li, M. Zhang, X. Li, Q. Y. Li and J. J. Yang, Appl. Catal., B, 2017, 212, 106–114 CrossRef CAS.
- Y. Q. Cui, Q. L. Ma, X. Y. Deng, Q. Meng, X. W. Cheng, M. Z. Xie, X. L. Li, Q. F. Cheng and H. L. Liu, Appl. Catal., B, 2017, 206, 136–145 CrossRef CAS.
- J. B. Cai, X. Q. Wu, S. X. Li and F. Y. Zheng, ACS Sustainable Chem. Eng., 2016, 4, 1581–1590 CrossRef CAS.
- J. Du, X. Y. Lai, N. L. Yang, J. Zhai, D. Kisailus, F. B. Su, D. Wang and L. Jiang, ACS Nano, 2011, 5, 590–596 CrossRef CAS PubMed.
- X. B. Chen and A. Selloni, Chem. Rev., 2014, 114, 9281–9282 CrossRef CAS PubMed.
- J. Schneider, M. Matsuoka, M. Takeuchi, J. L. Zhang, Y. Horiuchi, M. Anpo and D. W. Bahnemann, Chem. Rev., 2014, 114, 9919–9986 CrossRef CAS PubMed.
- J. X. Low, J. G. Yu, M. Jaroniec, S. Wageh and A. A. Al-Ghamdi, Adv. Mater., 2017, 29, 1601694 CrossRef PubMed.
- S. J. A. Moniz, S. A. Shevlin, D. J. Martin, Z.-X. Guo and J. Tang, Energy Environ. Sci., 2015, 8, 731–759 RSC.
- H. Wang, L. Zhang, Z. Chen, J. Hu, S. Li, Z. Wang, J. Liu and X. Wang, Chem. Soc. Rev., 2014, 43, 5234–5244 RSC.
- P. Li, X. Zhao, C. J. Jia, H. G. Sun, L. M. Sun, X. F. Cheng, L. Liu and W. L. Fan, J. Mater. Chem. A, 2013, 1, 3421–3429 RSC.
- M. Z. Xie, Q. Q. Meng, P. Luan, Y. J. Feng and L. Q. Jing, RSC Adv., 2014, 4, 52053–52059 RSC.
- T. Wang, G. D. Yang, J. Liu, B. L. Yang, S. J. Ding, Z. F. Yan and T. C. Xiao, Appl. Surf. Sci., 2014, 311, 314–323 CrossRef CAS.
- M. X. Sun, Y. L. Fang, Y. Y. Kong, X. J. Yuan, J. F. Shi and A. Umar, J. Alloys Compd., 2017, 705, 89–97 CrossRef CAS.
- L. L. Peng, T. F. Xie, Y. C. Lu, H. M. Fan and D. J. Wang, Phys. Chem. Chem. Phys., 2010, 12, 8033–8041 RSC.
- Z. Zhang and J. T. Yates, Chem. Rev., 2012, 112, 5520–5551 CrossRef CAS PubMed.
- H. G. Yang, G. Liu, S. Z. Qiao, C. H. Sun, Y. G. Jin, S. C. Smith, J. Zou, H. M. Cheng and G. Q. Lu, J. Am. Chem. Soc., 2009, 131, 4078–4083 CrossRef CAS PubMed.
- X. G. Han, Q. Kuang, M. S. Jin, Z. X. Xie and L. S. Zheng, J. Am. Chem. Soc., 2009, 131, 3152–3153 CrossRef CAS PubMed.
- P. W. Li, Z. Q. He, C. X. Luo, Y. Xiao, Y. Wang, J. Hu, G. Li, H. B. Jiang and W. D. Zhang, Appl. Surf. Sci., 2019, 466, 185–192 CrossRef CAS.
- T. Shi, Y. Y. Duan, K. L. Lv, Z. Hu, Q. Li, M. Li and X. F. Li, Front. Chem., 2018, 6, 175 CrossRef PubMed.
- C. R. Hubbard and R. L. Synder, Powder Diffr., 1988, 3, 74–77 CrossRef CAS.
- S. Hillier, Clay Miner., 2000, 35, 291–302 CrossRef CAS.
- D. Liu, Z. H. Li, W. Q. Wang, G. Q. Wang and D. Liu, J. Alloys Compd., 2016, 654, 491–497 CrossRef CAS.
- X. Cao, S. Q. Luo, C. Liu and J. W. Chen, Adv. Powder Technol., 2017, 28, 993–999 CrossRef CAS.
- O. Akhavan, Appl. Surf. Sci., 2010, 257, 1724–1728 CrossRef CAS.
- L. Liang, K. N. Li, K. L. Lv, W. K. Ho and Y. Y. Duan, Chin. J. Catal., 2017, 38, 2085–2093 CrossRef CAS.
- X. Zhao, Y. T. Du, C. J. Zhang, L. J. Tian, X. F. Li, K. J. Deng, L. Q. Chen, Y. Y. Duan and K. L. Lv, Chin. J. Catal., 2018, 39, 736–746 CrossRef CAS.
- S. M. Zhu, F. Yao, C. Yin, Y. Li, W. H. Peng, J. Ma and D. Zhang, Microporous Mesoporous Mater., 2014, 190, 10–16 CrossRef CAS.
- P. Zhang, L. Yu and X. W. Lou, Angew. Chem., Int. Ed., 2018, 57, 15076–15080 CrossRef CAS PubMed.
- A. A. Tahir, M. A. Ehsan, M. Mazhar, K. G. U. Wijayantha, M. Zeller and A. D. Hunter, Chem. Mater., 2010, 22, 5084–5092 CrossRef CAS.
- G. K. Mor, O. K. Varghese, M. Paulose and C. A. Grimes, Adv. Funct. Mater., 2005, 15, 1291–1296 CrossRef CAS.
- S. Mansingh, D. K. Padhi and K. M. Parida, Catal. Sci. Technol., 2017, 7, 2772–2781 RSC.
- J. Tauc, R. Grigorovici and A. Vancu, Phys. Status Solidi B, 1966, 21, 123–126 CAS.
- B. D. Viezbicke, S. Patel, B. E. Davis and D. P. Birnie Iii, Phys. Status Solidi B, 2015, 252, 1700–1710 CrossRef CAS.
- Y. Xu, W. Wen and J. M. Wu, J. Hazard. Mater., 2018, 343, 285–297 CrossRef CAS PubMed.
- X. B. Hou, S. L. Stanley, M. Zhao, J. Zhang, H. M. Zhou, Y. B. Cai, F. L. Huang and Q. F. Wei, J. Alloys Compd., 2019, 777, 982–990 CrossRef CAS.
- S. E. Chamberlin, I. H. Nayyar, T. C. Kaspar, P. V. Sushko and S. A. Chambers, Appl. Phys. Lett., 2015, 106, 1–5 CrossRef.
- P. Mallick, Mater. Sci., 2014, 32, 193–197 CAS.
- S. Kment, F. Riboni, S. Pausova, L. Wang, L. Y. Wang, H. Han, Z. Hubicka, J. Krysa, P. Schmuki and R. Zboril, Chem. Soc. Rev., 2017, 46, 3716–3769 RSC.
- J. Krysa, A. Nemeckova, M. Zlamal, T. Kotrla, M. Baudys, S. Kment, Z. Hubicka and M. Neumann-Spallart, J. Photochem. Photobiol., A, 2018, 366, 12–17 CrossRef CAS.
- S. J. Yuan, J. K. Mu, R. Y. Mao, Y. G. Li, Q. H. Zhang and H. Z. Wang, ACS Appl. Mater. Interfaces, 2014, 6, 5719–5725 CrossRef CAS PubMed.
- W. Jiang, X. Zong, L. An, S. Hua, X. Miao, S. Luan, Y. Wen, F. F. Tao and Z. Sun, ACS Catal., 2018, 8, 2209–2217 CrossRef CAS.
- X. L. Xing, H. H. Zhu, M. Zhang, L. L. Hou, Q. Y. Li and J. J. Yang, Catal. Sci. Technol., 2018, 8, 3629–3637 RSC.
- B. J. Sun, W. Zhou, H. Z. Li, L. P. Ren, P. Z. Qiao, F. Xiao, L. Wang, B. J. Jiang and H. G. Fu, Appl. Catal., B, 2018, 221, 235–242 CrossRef CAS.
- A. Wolcott, W. A. Smith, T. R. Kuykendall, Y. P. Zhao and J. Z. Zhang, Adv. Funct. Mater., 2009, 19, 1849–1856 CrossRef CAS.
- L. Kavan, M. Graetzel, S. E. Gilbert, C. Klemenz and H. J. Scheel, J. Am. Chem. Soc., 1996, 118, 6716–6723 CrossRef CAS.
- X. K. Zeng, Z. Y. Wang, N. Meng, D. T. McCarthy, A. Deletic, J. H. Pan and X. W. Zhang, Appl. Catal., B, 2017, 202, 33–41 CrossRef CAS.
- W. Liu, J. R. Ni and X. C. Yin, Water Res., 2014, 53, 12–25 CrossRef CAS PubMed.
- M. A. Ahmed, E. E. El-Katori and Z. H. Gharni, J. Alloys Compd., 2013, 553, 19–29 CrossRef CAS.
- B. R. James and R. J. Bartlett, J. Environ. Qual., 1983, 12, 173–176 CrossRef CAS.
- L. X. Yang, Y. Xiao, S. H. Liu, Y. Li, Q. Y. Cai, S. L. Luo and G. M. Zeng, Appl. Catal., B, 2010, 94, 142–149 CrossRef CAS.
Footnote |
| † Electronic supplementary information (ESI) available. See DOI: 10.1039/c9ra03531a |
|
| This journal is © The Royal Society of Chemistry 2019 |
Click here to see how this site uses Cookies. View our privacy policy here.  Open Access Article
 b,
Ronglan Wu
 *a and
Wei Wang
 *c
*c
![[thin space (1/6-em)]](https://www.rsc.org/images/entities/char_2009.gif) :
:![[thin space (1/6-em)]](https://www.rsc.org/images/entities/char_2009.gif) 1) was added into the suspension, which was then transferred into a 100 mL Teflon-lined autoclave and maintained at 160 °C for 5 hours. The obtained precipitates were washed several times with water and ethanol and dried at 80 °C for 8 hours. The dried powder was calcined in a tube furnace at 500 °C for 2 hours with a heating rate of 5 °C min−1 in Ar atmosphere. After cooling down to room temperature, the light red TiO2/Fe2O3 powder was obtained and named as TF0.5. In comparison, pure Fe2O3 and a series of products with different content of Fe2O3 were prepared under the same conditions. The products are noted as TFx where x represents the amount of Fe2(SO4)3 in mmol. For example, TF2.0 means that the amount of Fe2(SO4)3 is 2.0 mmol in the reaction.
1) was added into the suspension, which was then transferred into a 100 mL Teflon-lined autoclave and maintained at 160 °C for 5 hours. The obtained precipitates were washed several times with water and ethanol and dried at 80 °C for 8 hours. The dried powder was calcined in a tube furnace at 500 °C for 2 hours with a heating rate of 5 °C min−1 in Ar atmosphere. After cooling down to room temperature, the light red TiO2/Fe2O3 powder was obtained and named as TF0.5. In comparison, pure Fe2O3 and a series of products with different content of Fe2O3 were prepared under the same conditions. The products are noted as TFx where x represents the amount of Fe2(SO4)3 in mmol. For example, TF2.0 means that the amount of Fe2(SO4)3 is 2.0 mmol in the reaction.


![[thin space (1/6-em)]](https://www.rsc.org/images/entities/char_2009.gif) = 6.8). These two potentials are converted to −0.22 and +0.30
= 6.8). These two potentials are converted to −0.22 and +0.30![[thin space (1/6-em)]](https://www.rsc.org/images/entities/char_2009.gif) V (vs. NHE, pH = 0). Combined with the bandgap of TiO2 (2.9 eV) and Fe2O3 (1.4 eV), the valence band (VB) positions of TiO2 and Fe2O3 are +2.68 and +1.70 V, respectively. Based on the above results and discussion, a reasonable photocatalytic mechanism of TiO2/Fe2O3 nanocomposites is proposed (Scheme 2). The relative location of the EF of TiO2 and Fe2O3 is concluded that the EF of Fe2O3 is lower than that of TiO2.23 When Fe2O3 contacts TiO2 to form heterojunction, to acquire an equalized Fermi level, the electrons flow from TiO2 to Fe2O3 resulting in a positive area forming in the heterojunction adjacent to TiO2; whereas the holes flow from Fe2O3 to TiO2 resulting in a negative area forming in the heterojunction adjacent to Fe2O3. Meanwhile, an internal electric field directed from TiO2 to Fe2O3 is constructed, which leads to the opposite direction of charge carries diffusion. Finally, the photogenerated electrons migrate from Fe2O3 to TiO2 and holes migrate from TiO2 to Fe2O3 under visible light irradiation. As a result of charge carries migration, electrons accumulate mainly on the CB of TiO2 and then reduce dissolved oxygen molecules to yield superoxide radical (·O2−), which leads to the photoreduction Cr(VI) on TiO2. In addition, ESR analyses (Fig. 8d) were used to further investigate the existence of ·O2− species in the photocatalytic reaction systems of TF0.5. No obvious signal could be observed for TF0.5 in dark. However, six characteristic peaks of the DMPO-·O2− appeared in ESR curves of TF0.5 after 5 min irradiation. It can be concluded that photo-induced electron–hole pairs in TF0.5 has been effectively separated. Generally, Cr(VI) could be reduced by either photogenerated electrons (e−) or ·O2−. The feasible reaction steps (1)–(9) in the photocatalytic process are as follows:55–57
V (vs. NHE, pH = 0). Combined with the bandgap of TiO2 (2.9 eV) and Fe2O3 (1.4 eV), the valence band (VB) positions of TiO2 and Fe2O3 are +2.68 and +1.70 V, respectively. Based on the above results and discussion, a reasonable photocatalytic mechanism of TiO2/Fe2O3 nanocomposites is proposed (Scheme 2). The relative location of the EF of TiO2 and Fe2O3 is concluded that the EF of Fe2O3 is lower than that of TiO2.23 When Fe2O3 contacts TiO2 to form heterojunction, to acquire an equalized Fermi level, the electrons flow from TiO2 to Fe2O3 resulting in a positive area forming in the heterojunction adjacent to TiO2; whereas the holes flow from Fe2O3 to TiO2 resulting in a negative area forming in the heterojunction adjacent to Fe2O3. Meanwhile, an internal electric field directed from TiO2 to Fe2O3 is constructed, which leads to the opposite direction of charge carries diffusion. Finally, the photogenerated electrons migrate from Fe2O3 to TiO2 and holes migrate from TiO2 to Fe2O3 under visible light irradiation. As a result of charge carries migration, electrons accumulate mainly on the CB of TiO2 and then reduce dissolved oxygen molecules to yield superoxide radical (·O2−), which leads to the photoreduction Cr(VI) on TiO2. In addition, ESR analyses (Fig. 8d) were used to further investigate the existence of ·O2− species in the photocatalytic reaction systems of TF0.5. No obvious signal could be observed for TF0.5 in dark. However, six characteristic peaks of the DMPO-·O2− appeared in ESR curves of TF0.5 after 5 min irradiation. It can be concluded that photo-induced electron–hole pairs in TF0.5 has been effectively separated. Generally, Cr(VI) could be reduced by either photogenerated electrons (e−) or ·O2−. The feasible reaction steps (1)–(9) in the photocatalytic process are as follows:55–57


