 Open Access Article
DNA-binding, antioxidant, H2O2 sensing and photocatalytic properties of biogenic silver nanoparticles using Ageratum conyzoides L. leaf extract
Sandip Kumar Chandraker,
Mishri Lal and
Ravindra Shukla *
*
Laboratory of Bio-resource Technology, Department of Botany, Indira Gandhi National Tribal University, Amarkantak-484887, Madhya Pradesh, India. E-mail: ravindra.shukla@igntu.ac.in; Tel: +91-8656-948490
First published on 29th July 2019
Abstract
Green nanotechnology is gaining widespread interest owing to the elimination of harmful reagents and offers a cost-effective synthesis of expected products. In the present study, silver nanoparticles (AgNPs) were synthesized from Ageratum conyzoides leaf extract (ACLE). UV-visible spectrophotometry showing a characteristic SPR peak at 443 nm verified the phytosynthesis of AC-AgNPs. The FTIR spectrum was examined to identify the efficient functional molecules responsible for the reduction of Ag+ to metallic silver (Ag0). SEM, TEM and XRD illustrated the formation of crystalline and spherical NPs with a size range of 14–48 nm. EDX data showed the presence of elemental silver with an energy peak at 3 eV. CT-DNA interaction with AC-AgNPs was investigated and the UV absorption spectra revealed a bathochromic effect indicating groove binding. AC-AgNPs showed a strong antioxidant property in a concentration-dependent manner when analyzed by DPPH and ABTS radical scavenging assay. AC-AgNPs were investigated as a SPR-based H2O2 sensor, which can provide promising opportunities in medical and environmental fields to detect reactive oxygen species such as H2O2. The catalytic effectiveness of phytosynthesized NPs was also examined within 2 h of exposure for methylene blue degradation under sunlight. There is thus a reasonable potential application of green synthesized AC-AgNPs for the degradation of hazardous synthetic dyes.
1. Introduction
Nanotechnology is an interdisciplinary and most attractive area of research in recent years. It has influenced every dimension of science, economy and all life steps that include the design, synthesis and manipulation of nano-sized materials in multiple ways. Nanoparticles have various applications regarding biological and medicinal aspects such as catalytic activity, water purification, chemical and biological sensors, wireless electronic logic and memory schemes.1 They have a very significant role in the material sciences owing to their defined size, shape, optical, mechanical and biological properties.2 Due to the small size range of nanoparticles (1–100 nm), they provides a high surface area and reactivity which makes them popular in biomedicine for therapeutic purposes.3Biological route of nanoparticle synthesis is free from the use of hazardous chemicals or irradiations and preferred over physical and chemical methods. The plant-mediated green synthetic approach of nanoparticle is greatly advantageous over microbial synthesis as the process is highly economical compared to the cost of microorganism isolation and their culture maintenance.4,5 The phytosynthesis of nanoparticles is rapid, low cost, eco-friendly, and one-step method.6 Since the plant extracts contain various secondary metabolites such as alkaloids, flavonoids, saponins, steroids, tannins, etc., it acts as a reducing and stabilizing agent for the bioreduction reaction to synthesize novel metallic nanoparticles. AgNPs synthesis is a promising field of research and much needed because nano-scale silver has shown entirely distinct characteristics to bulk particles made of the same material.7
In recent years, studies on interaction of metal NPs with DNA are of primary concern due to its possible effect on the structural integrity and synthesis of DNA.8 Several methods like gel electrophoresis, electrochemical techniques and UV-vis spectroscopy have been employed to elucidate interaction of tiny molecules with DNA. However, spectroscopic techniques are convenient, accurate and highly sensitive compared to other complicated methods.9
H2O2 is a strong oxidizing agent which is widely used in the food, pharmaceutical, cosmetics, wood and pulp industries. However, the exposure and presence of even a small amount of H2O2 in process streams result in various health and environmental hazards due to its toxicity.10 It is therefore, essential to develop accurate, stable and fast methods to detect H2O2 residue in commercially available products. Chemiluminescence, optical detection and electrochemical methods have been developed for the sensitive determination of H2O2.11 AgNPs based non-enzymatic sensor for H2O2 has been developed by electrodeposition method and by using Bacillus subtilis.12,13 Only few reports are available on phytosynthesized AgNPs for H2O2 sensing capacity using Calliandra haematocephala, Lavandula officinalis, Lithodora hispidula, Mangifera indica etc.11,14–16
Synthetic dyes are a potential hazard to living organisms produced by textile, paper, food, cosmetics, and pharmaceutical industries. These causes serious health and ecological problems, and some of them have exhibited mutagenic and carcinogenic effects.17 Methylene blue (MB) is a synthetic thiazine dye used as a traditional colorant in the textile and paint industries. However, proven as an industrial pollutant, its odor, and direct contact may cause allergic reactions, burning of skin and eyes, breathlessness, vomiting, etc.18 Different methods commonly adopted for detoxification of dyes using UV radiations, toxic stabilizers, solvents, surfactants, flocculation, redox treatments and microbial biodegradation.15 These techniques are inefficacious and require a better approach. Catalytic degradation under visible-light irradiation has gained widespread attention because it is rapid, highly efficient and economical, and does not cause secondary pollution.19
Ageratum conyzoides L. (family: Asteraceae) in an invasive weed of Indo-Gangetic plains and Narmada basin, and abundantly found in and around Indian agro-ecosystems. The plant has morphological variations and highly adaptable to different ecological conditions. A number of chemical compounds including alkaloids, flavonoids, chromenes, benzofurans and terpenoids have been isolated from this species.20 Extracts and metabolites from this plant has been found to possess hypoglycemic, anti-inflammatory, antifungal, antimalarial, anti-protozoal and insecticidal activities.21
The objectives of the present study were to synthesize and characterize the AgNPs using the aqueous leaf extract of A. conyzoides. In addition, DNA binding, free radical scavenging, photo-catalytic degradation of MB and H2O2 sensing properties of AgNPs were also investigated.
2. Materials and methods
2.1 Plant materials
The leaves of A. conyzoides were collected during September 2018 from Keonchi region of Achanakmar Amarkantak Biosphere Reserve under Bilaspur District, Chhattisgarh State, India. The authentication of plant species was done by subject experts, and a voucher specimen (DOB/07/AC/043) deposited in Department of Botany, Indira Gandhi National Tribal University, Amarkantak, India.2.2 Preparation of leaf extract and biosynthesis of AgNPs
The collected fresh leaves of A. conyzoides were washed thoroughly with tap water and twice with Milli-Q water to eliminate the organic impurities, and dust present on it. The extract was prepared with 10 g of fresh leaves that were uniformly cut into small pieces. Chopped leaves were boiled for 15 min in 100 mL double sterile distilled water and filtered with Whatman No. 1 filter paper after cooling. ACLE was stored at 4 °C for further experiments. AgNO3 (AR grade) was obtained from Himedia Laboratories Pvt. Ltd., Mumbai, India. Ten milliliters of ACLE was carefully measured and added to 90 mL of aqueous solution of AgNO3 (1 mM) in a 250 mL Erlenmeyer flask. The flasks were incubated in the dark at room temperature for the reduction of Ag+ to Ag0 nanoparticles for 24 h, resulting in the formation of yellowish-brown to dark brown solution indicating the synthesis of AC-AgNPs.2.3 Characterization of AC-AgNPs
![[thin space (1/6-em)]](https://www.rsc.org/images/entities/char_2009.gif) 000g for 10 min and their pellets were redispersed in Milli-Q water to ensure complete separation of AgNPs. The supernatant was replaced each time and the pellet was stored at −20 °C for optical measurements.
000g for 10 min and their pellets were redispersed in Milli-Q water to ensure complete separation of AgNPs. The supernatant was replaced each time and the pellet was stored at −20 °C for optical measurements.![[thin space (1/6-em)]](https://www.rsc.org/images/entities/char_2009.gif) θ), where D is the average size of the crystallite in vertical direction of crystal face, λ is the wavelength of X-ray, β is the full width at half maximum (FWHM) intensity of the peak, and θ is the diffraction angle.
θ), where D is the average size of the crystallite in vertical direction of crystal face, λ is the wavelength of X-ray, β is the full width at half maximum (FWHM) intensity of the peak, and θ is the diffraction angle.2.4 In vitro DNA binding study
The interaction between calf thymus DNA (CT-DNA) and AC-AgNPs was studied by UV-vis spectral analysis following Pathak et al.22 Solution of CT-DNA was prepared in Tris–HCl buffer (0.1 M) (pH = 7.2) with 12 h stirring below 4 °C. Absorption experiments were carried out by keeping constant concentration of AC-AgNPs (0.25 mg) whereby varying the CT-DNA concentration (40–320 μL). Spectral changes of AC-AgNPs were monitored by recording UV-visible absorption in the range of 300–600 nm, after adding different concentrations of CT-DNA.2.5 Antioxidant activity of AC-AgNPs
Antioxidant activity of AC-AgNPs was determined by DPPH and ABTS free radical scavenging assay.2.6 H2O2 sensing capacity of AC-AgNPs
The H2O2 sensing capacity of green synthesized AC-AgNPs was observed following Mahadevan et al. with slight modification.23 One milliliter of 20 mM H2O2 (CDH Chemicals, New Delhi, India) was added to 3 mL colloidal solution of AC-AgNPs and mixed thoroughly. The initial spectrum of diluted AC-AgNPs solution (with 3 mL Milli Q water) was recorded using the spectrophotometer. The spectral observations of the reacting solution were recorded at regular intervals.2.7 Photocatalytic activity of AC-AgNPs
The catalytic activity of AC-AgNPs was studied by degrading toxic dye MB under sunlight. MB (AR, MW = 319.86) was procured from CDH chemicals, New Delhi, India and experiment was designed following Rodríguez-Cabo et al.24 The dye solution was prepared by dissolving 1 mg MBin 100 mL deionized water. Ten milligrams of AgNPs were added to 50 mL dye solution and the mixture was stirred magnetically (Spinot, Tarsons) for 45 min in dark before illumination. A control was also prepared without AC-AgNPs and kept under the similar condition. UV-visible spectra and absorption maxima were observed at regular intervals of 15 min to monitor the dye degradation.3. Results and discussion
3.1 Phytoreduction of silver ions
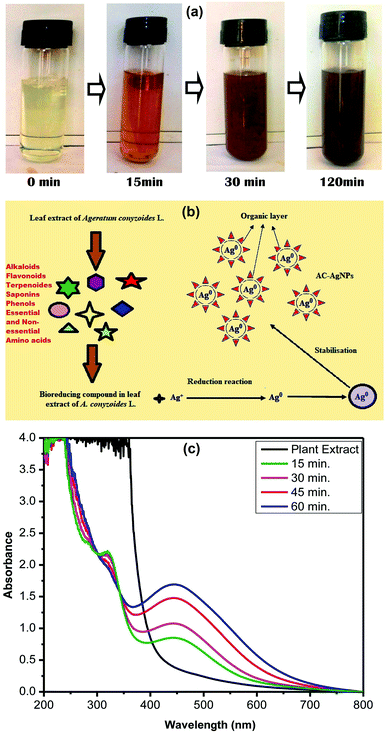
During a visual observation, the solution of AgNO3 incubated with ACLE showed color changes from colorless to yellowish-brown within 15 min (Fig. 1a). The appearance of reddish-brown color in ACLE treated flask is a clear indication of the formation of AC-AgNPs within 30 min. After long incubation (2 h) it showed brown color which means the complete formation of AgNPs from aqueous ACLE. This color arises due to excitation of surface plasmon resonance (SPR) in metal NPs. In principle, color changes of the reaction mixture are due to the collective vibration of free electrons induced by an electromagnetic field. Changes in the electronic energy level due to excitation of electrons reflect the reduction of Ag+ into Ag0 which attributes to reddish brown color of synthesized AC-AgNPs in aqueous solution. The reduction of Ag+ occurred due to the water-soluble phytochemicals present in the leaf samples. A. conyzoides leaves are reported to be rich in tannins and other phytochemicals such as alkaloids, flavonoids, terpenoids, saponins, cardiac glycosides, resins, steroids, phenols, essential and non-essential amino acids, etc.25,26 Such phytochemicals may act as reducing, capping as well as stabilizing agents. A schematic representation of the possible mechanism of NPs synthesis is shown in Fig. 1b. Nonetheless, further investigations are required to monitor the role of specific molecules involved in the biosynthesis of AgNPs. The reduction mechanism of polyphenols like tannin and tannic acid with AgNO3 may also involve in the phytomediated synthesis of AgNPs.27 The suggested mechanism of AgNPs biosynthesis involves the formation of intermediate complexes between AgNO3 and phenolic OH groups in hydrolyzable tannins. The complex undergoes oxidation to quinine forms with subsequent reduction of Ag+ to AgNPs.28 According to Bulut and Ozacar, debonded H-bonds of OH groups present in tannins serves as a chemical reducer, surface stabilizer and template for Ag+ to Ag reaction to occur.293.2 UV-vis spectral analysis
The spectrophotometric analysis records the optical density or intensity of absorption as a function of wavelength. The UV-vis spectroscopy serves as the most agreeable approach for the characterization of AgNPs and used to determine the concentration of the NPs in aqueous solution. Fig. 1c shows the UV-vis spectra of the aqueous plant extracts with 1 mM AgNO3 solution. After 15 min of reaction time at room temperature (33 °C), a characteristic plasmon band with λmax appeared at 443 nm. Adsorption of materials unto the surface of the metal nanoparticles leads to excitation of the surface plasmon. It causes scattering of strong light by an electric field where resonance occurs, proceeding in the appearance of strong SPR bands.30 Fig. 1c demonstrates that the intensity of the peaks continued to increase at various time intervals up to 60 min with the same absorption maxima. AgNPs produced from ACLE were observed to be very stable in the solution with no evidence of flocculation and agglomeration even 2 months after their synthesis which validates the potential application of ACLE as AgNPs synthesizer. Another weak absorption peak of at 320 nm indicates the presence of several organic compounds and aromatic amino acids which are known to interact with Ag+.3.3 FTIR spectral analysis
FTIR spectrum of phytosynthesized AC-AgNPs is shown in Fig. 2a, that reveals the involvement of possible biomolecules and functional groups in AgNPs biosynthesis. The IR-spectrum shows absorption bands at 3440.29, 2358.95, 1613.99, 1383.98, 1074.83 and 699.38 cm−1. The peak at 3440.29 cm−1 corresponds to amide N–H stretching. The peak observed at 2358.95 cm−1 may be due to C–H stretching of the methylene group. Band at 1383.98 cm−1 corresponds to the presence of stretching vibrations of alcohol, ethers, esters, carboxylic acids, and amino acids.31 Band at 1613.99 cm−1 corresponding to the C![[double bond, length as m-dash]](https://www.rsc.org/images/entities/char_e001.gif) O (amide I) and the peak in 1074.83 cm−1 can be attributed to the stretching vibration of the C–OH bond from proteins in the plant extract.31,32 The functional groups like C
O (amide I) and the peak in 1074.83 cm−1 can be attributed to the stretching vibration of the C–OH bond from proteins in the plant extract.31,32 The functional groups like C![[double bond, length as m-dash]](https://www.rsc.org/images/entities/char_e001.gif) O, N–H, and C–H groups present in the ACLE might be responsible for bioreduction of Ag+ to AgNPs. Observed peaks considered as major functional groups in different chemical classes such as polysaccharides, flavonoids, triterpenoids, and polyphenols.33
O, N–H, and C–H groups present in the ACLE might be responsible for bioreduction of Ag+ to AgNPs. Observed peaks considered as major functional groups in different chemical classes such as polysaccharides, flavonoids, triterpenoids, and polyphenols.33
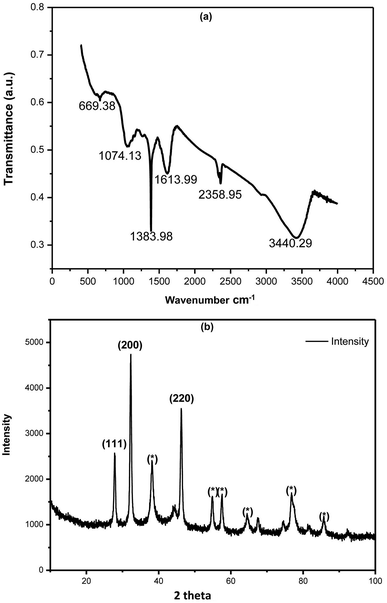 | ||
| Fig. 2 (a) FTIR spectrum of green synthesized AgNPs using ACLE. (b) XRD pattern of green synthesized AgNPs exhibiting the facets of crystalline Ag. | ||
3.4 XRD analysis
The XRD profile of synthesized AC-AgNPs is depicted in Fig. 2b, which confirms the existence of Ag colloids in the sample. The Braggs reflections were observed in the XRD pattern at 2θ = 28, 32 and 46 that clearly indicates the presence of (111), (200) and (220) sets of lattice plane, respectively. Peaks pattern can be readily indexed to a face-centered cubic (fcc) structure of silver (JCPDS, file no. 893722).34 XRD pattern of present investigation revealed the small particle size, and crystalline nature of synthesized AC-AgNPs. Some additional unassigned peaks were also noticed in the vicinity of the characteristic peaks suggesting the crystallization of bioorganic phase on the surface of NPs.35 The average size of NPs was calculated using the Debye–Scherrer equation was 35 nm. The cubic nature of phytosynthesized AgNPs are also reported from several studies.3.5 SEM and EDX analysis
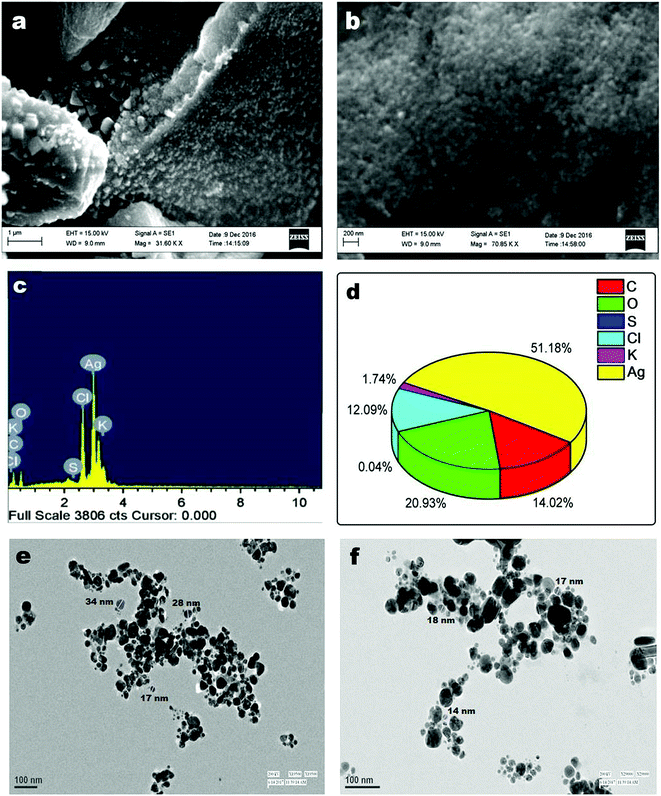
SEM analysis was employed to visualize the morphology and size of AgNPs. Different magnifications of SEM images are shown in Fig. 3a and b, which confirms the formation of homogenous and relatively spherical AC-AgNPs. The elemental composition of NPs was analyzed through energy dispersive X-ray analysis (EDX). Fig. 3c represents the EDX spectrum showing the major elemental peak at 3 keV which is specified for metallic silver. Other small peaks of C, O, S, Cl and K were also arisen due to the capping of AgNPs by biomolecules of ACLE. Quantitative estimation reveals elemental Ag with the higher weight percentage of 51.18%, whereas, O, C, Cl, K, and S having weight percentages of 20.93%, 14.02%, 12.09%, 1.74% and 0.04%, respectively (Fig. 3d).3.6 TEM analysis
The images obtained from transmission electron microscopy (TEM) of AC-AgNPs are shown in Fig. 3e and f. TEM images elucidate the formation of isotropic and nearly spherical nanoparticles which is in agreement with the shape from the SPR band in the UV-vis spectra. From the TEM image, the particle size range was measured between 14–48 nm which was in accordance with the particle size calculated from the XRD spectrum.3.7 In vitro DNA binding capability
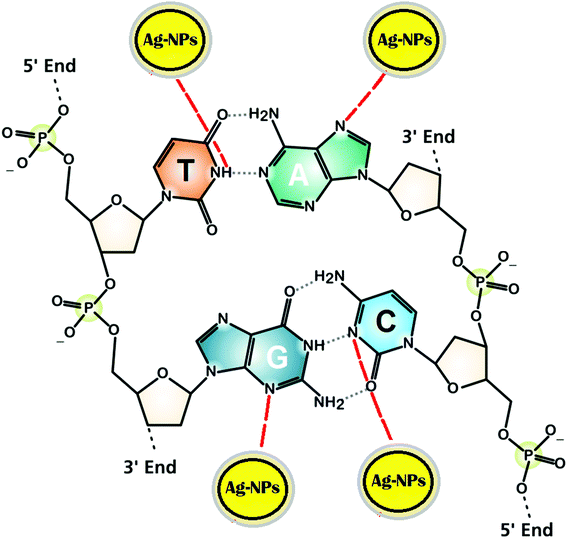
UV-vis spectral titration is one of the important tools for determining the DNA binding capacity of compounds. Prior to addition with AC-AgNPs, the stability of CT-DNA was examined at room temperature with intervals of 15 min and the absorption peak was monitored for 1 h. The experiment was carried out keeping the concentration of AC-AgNPs constant to which CT-DNA was gradually added. Successive binding of AC-AgNPs with CT-DNA resulted to decrease in absorption with significant, though minor, bathochromic effect or red-shift (470 nm to 474 nm) in spectrum indicating that AgNPs preferably interact with DNA (Fig. 4). Absorption spectra of CT-DNA showed a hyperchromic effect with an isosbestic point, which indicates a very strong interaction between NPs and CT-DNA.9 Only a few studies on the interactive mechanism of some small molecules and DNA have been reported where electrostatic binding, groove binding, and intercalation are the three suggested modes of interactions.8,22 Fig. 5 depicts the possible hydrogen bonding sites of CT-DNA with bioorganic capping molecules bound to AC-AgNPs, where N7 atoms of guanine and adenine bases and N3 atoms of cytosine and thymine bases are involved in interaction.36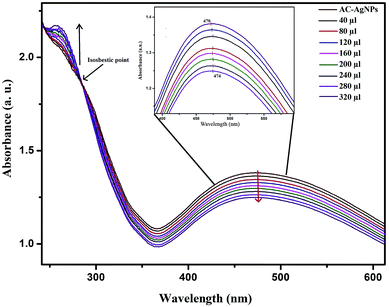 | ||
| Fig. 4 UV-vis absorption spectra of AC-AgNPs with CT-DNA at various concentrations of CT-DNA (40–320 μL). | ||
3.8 Antioxidant activity of AC-AgNPs
DPPH and ABTS radical scavenging assay are relatively quick and sensitive methods of evaluating the antioxidant activity of particular compounds. DPPH is a stable free radical having violet to blue color that converts into a diamagnetic molecule (light yellow) when reacts with electron or hydrogen molecules. The intensity of color change depends on concentration and nature of sample.Dose dependent free radical scavenging activity is shown in Fig. 6a and b. The DPPH radical inhibition was found between 53.61 ± 0.01 to 89.82 ± 0.017 percent in 31.25 to 500 μg mL−1 concentration of AC-AgNPs, while the ascorbic acid produced inhibition of 75.64 ± 0.08 to 98.94 ± 0.03 (Fig. 6a). Similarly, percent ABTS radical inhibition was found 40.16 ± 0.13 to 81.1 ± 0.13 in 31.25 to 500 μg mL−1 concentrations of AC-AgNPs. However, at the same concentration, ascorbic acid displayed inhibition activity of 38.39 ± 0.05 to 88.09 ± 0.1 (Fig. 6b). The free radical scavenging activities of AC-AgNPs are similar to some previous reports.31,37 The functional groups of the bioreductant molecules originated from ACLE, adhered to the surface of the particles have been attributed for the free radical scavenging activity of the AC-AgNPs.38
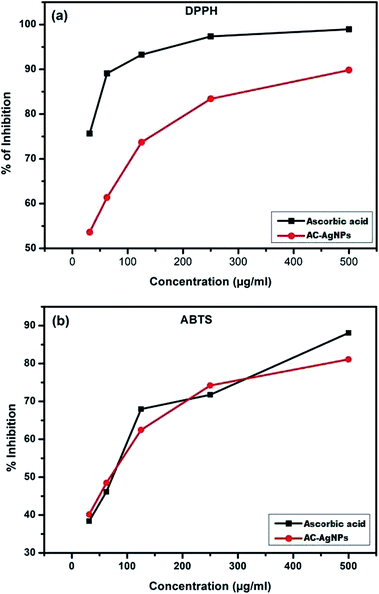 | ||
| Fig. 6 (a) DPPH free radical scavenging activity of AC-AgNPs. (b) ABTS free radical scavenging assay of AC-AgNPs. | ||
3.9 H2O2 sensing capacity of AC-AgNPs
Fig. 7 shows the changes in the optical characteristics of AC-AgNPs with time due to the addition of 20 mM H2O2. As shown in the inset of Fig. 7, the brown color (vial a) gradually disappeared and finally became colorless (vial c) after 25 min. The decreasing absorbance was observed with the time of reaction, and eventually, the characteristic SPR peak of silver disappeared. No change in the intensity of the SPR absorbance was observed in control without H2O2. The change in color and concentration of the AgNPs solution and decrease of the SPR peak was attributed to the ability of silver to catalyze the decomposition of H2O2.4,14,39 Mohan et al. suggested that the addition of AgNPs to H2O2 leads to the formation of free radicals which initiate the degradation of the AgNPs.40 Subsequently, Ag0 oxidizes to Ag+ and thus caused a decrease in absorbance. In accordance with Bera and Raj, the redox potential of H2O2/H2O couple (1.763 V in acidic medium) or H2O2/OH− couple (0.867 V in basic medium) is higher than that of the Ag(I)/Ag couple (0.8 V) and H2O2 can efficiently oxidize AgNPs in both acidic and basic medium.41 These findings suggest the successful use of AgNPs to detect the concentration of H2O2 present in various unknown samples.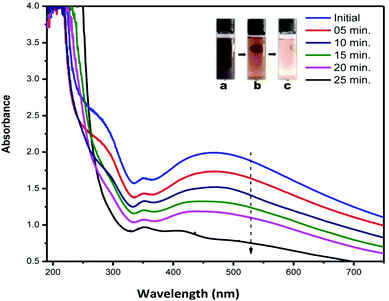 | ||
| Fig. 7 UV-visible absorbance spectra of AC-AgNPs solution recorded at different time interval after the addition of H2O2 (inset: reacting solution (a) initial (b) after 15 min (c) after 25 min). | ||
3.10 Photocatalytic activity of AC-AgNPs
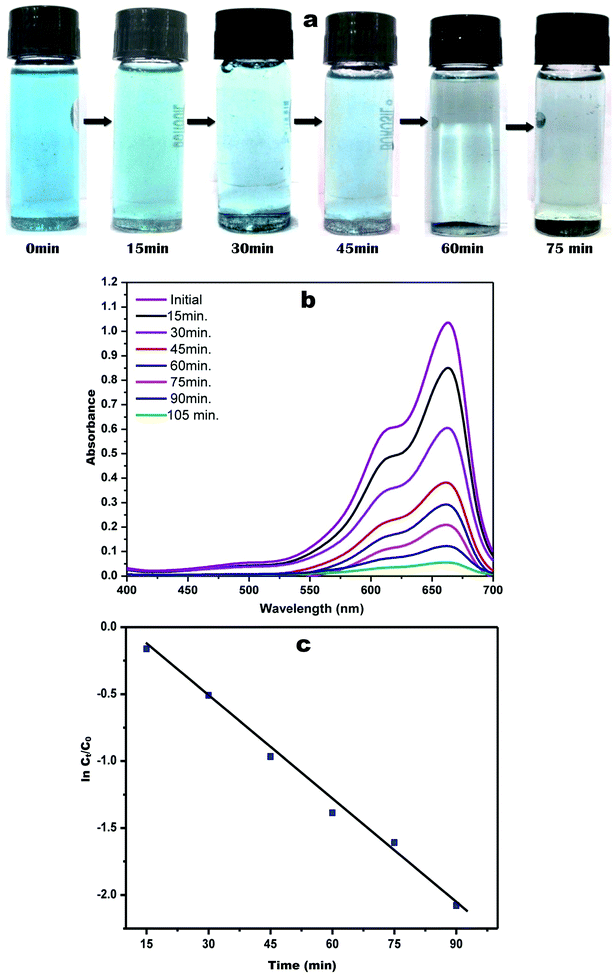
Methylene blue, also known as methyl thioninium chloride is a basic aniline dye with molecular formula C16H18C1N3S. It has a blue color in an oxidized state and upon reduction turns colorless forming leuco-methylene blue. Despite several uses in staining and medication, MB has been reported for severe CNS toxicity and carcinogenicity.41 The catalytic activity of the green synthesized AC-AgNPs was studied by the degradation of MB under solar light. Fig. 8a indicates the visual detection of MB degradation by a gradual change in the color of dye solution from blue to colorless. The characteristic absorption maximum for MB was peaked at 663 nm. The degradation of MB in the presence of green synthesized AC-AgNPs was confirmed by the gradual decrease of the peak intensity during 2 h of exposure in sunlight shown in Fig. 8b. The control exhibited no change in coloration until the end of exposure time. AC-AgNPs exhibited rapid photocatalytic activity on their surface, which is stabilized by phytomolecules. The photocatalytic decolorization efficiency of AC-AgNPs for MB was calculated in terms of dye degradation (%) following the equation of Alshehri et al. with slight modification.19| Dye degradation (%) = [1 − Ct/C0]100 |
4. Conclusion
This study demonstrated a facile, eco-friendly and green approach to synthesize AgNPs using ACLE, taking advantage of the natural reducing and capping ability of its constituent compounds. Phytosynthesis was found to be competent in terms of reaction time as well as the stability of the synthesized AgNPs that did not include external stabilizers/reducing agents. Absorption spectrum with SPR peak at 443 nm confirmed the formation of stable AgNPs in the reaction mixture. FTIR spectrum showed that the phyto-molecules present in the aqueous extract of AC are responsible for reducing AgNO3 and capping the active molecules in the AgNPs. The green synthesized AC-AgNPs were found to have a crystalline nature with face-centered cubic (FCC) geometry as studied by XRD. The spherical shape of the NPs with the size range of 14–48 nm was confirmed by SEM and TEM. EDX confirmed the structural and elemental composition of AC-AgNPs. The ability of AgNPs to interact with CT-DNA, showing free radical scavenging activity, H2O2 sensing activities are worth remarkable in bionanotechnology and nanomedicine sciences. The outstanding photocatalytic activity of the AgNPs was primarily ascribed to their high photo-degradation capacity for MB. Thus, AC-AgNPs can be exploited for degradation and conversion of industrial pollutants like free radicals and hazardous dyes into harmless mineral compounds.Conflicts of interest
Authors declare no conflict of interest.Abbreviations
| ACLE | Ageratum conyzoides L. leaf extract |
| AgNPs | Silver nanoparticles |
| AC-AgNPs | Ageratum conyzoides L. mediated silver nanoparticles |
| SPR | Surface plasmon resonance |
| UV-vis | UV-visible spectrophotometer |
| FTIR | Fourier transform infrared spectrum |
| SEM | Scanning electron microscopy |
| TEM | Transmission electron microscopy |
| XRD | X-ray diffraction |
| EDX | Energy dispersive X-ray |
| H2O2 | Hydrogen peroxide |
| MB | Methylene blue |
| DPPH | 2,2-Diphenyl-1-picrylhydrazyl |
| ABTS | 2,2′-Azino-bis-3-ethylbenzothiazoline-6-sulphonic acid |
| CT-DNA | Calf thymus DNA |
| AgNO3 | Silver nitrate |
Acknowledgements
The authors are thankful to the Science and Engineering Research Board (SERB), Department of Science and Technology, New Delhi for financial assistance (YSS/2015/002080). Authors gratefully acknowledge the necessary instrumental facilities of UGC-DAE Consortium for Scientific Research, Indore and Sophisticated Analytical Instrumentation Facility, AIIMS, New Delhi.References
- V. S. Ramkumar, A. Pugazhendhi, K. Gopalakrishnan, P. Sivagurunathan, G. D. Saratale, T. N. B. Dung and E. Kannapiran, Biotechnol. Rep., 2017, 14, 1–7 CrossRef PubMed.
- M. S. Akhtar, J. Panwar and Y. S. Yun, ACS Sustainable Chem. Eng., 2013, 6, 591–602 CrossRef.
- S. Ahmed and S. Ikram, J. Nanomed. Nanotechnol., 2015, 6(4), 309 Search PubMed.
- P. Kuppusamy, M. M. Yusoff, G. P. Maniam and N. Govindan, Saudi Pharm. J., 2016, 4, 473–484 CrossRef PubMed.
- F. Eya'aneMeva, M. L. Segnou, C. O. Ebongue, A. A. Ntoumba, P. B. E. Kedi, V. Deli, M. A. Etoh and E. M. Mpondo, Rev. Bras. Farmacogn., 2016, 26, 640–646 CrossRef.
- J. J. Vijaya, N. Jayaprakash, K. Kombaiah, K. Kaviyarasu, L. J. Kennedy, R. J. Ramalingam, H. A. Al-Lohedan, V. M. Mansoor-Ali and M. Maaza, J. Photochem. Photobiol., B, 2017, 177, 62–68 CrossRef PubMed.
- J. Y. Song and B. S. Kim, Biosyst. Eng., 2009, 32, 79–84 CAS.
- A. P. Ribeiro, S. Anbu, E. C. Alegria, A. R. Fernandes, P. V. Baptista, R. Mendes, A. S. Matias, M. Mendes, M. G. da Silva and A. J. Pombeiro, Biomed. Pharmacother., 2018, 101, 137–144 CrossRef CAS PubMed.
- K. Sonia, S. Kukreti and M. Kaushik, J. Photochem. Photobiol., B, 2019, 194, 158–165 CrossRef PubMed.
- K. Tagad, H. U. Kim, R. C. Aiyer, P. More, T. Kim, S. H. Moh, A. Kulkarni and S. G. Sabharwal, RSC Adv., 2013, 45, 22940–22943 RSC.
- L. Subramanian, T. Sabu and K. Obey, International Journal of Biosensors & Bioelectronics, 2017, 2, 22 Search PubMed.
- Q. Wang and Y. Yun, Microchim. Acta, 2013, 180, 261–268 CrossRef CAS.
- R. Liu, Y. Wei, J. Zheng, H. Zhang and Q. Sheng, Chin. J. Chem., 2013, 3, 1519–1525 CrossRef.
- S. Raja, V. Ramesh and V. Thivaharan, Arab. J. Chem., 2017, 10, 253–261 CrossRef CAS.
- B. Kumar, K. Smita and L. Cumbal, Nanotechnol. Rev., 2016, 5, 521–528 CAS.
- A. Turunc, R. Binzet, I. Gumus, G. Binzet and H. Arslan, Mater. Chem. Phys., 2017, 202, 310–319 CrossRef.
- A. Zabłocka-Godlewska, W. Przystaś and E. Grabińska-Sota, Water, Air, Soil Pollut., 2018, 229(6), 176, DOI:10.1007/s11270-018-3829-7.
- J. H. Shah, M. Fiaz, M. Athar, J. Ali, M. Rubab, R. Mehmood, S. U. U. Jamil and R. Djellabi, Environ. Technol., 2019, 9, 1–10 CrossRef PubMed.
- A. Alshehri, M. A. Malik, Z. Khan, S. A. Al-Thabaiti and N. Hasan, RSC Adv., 2017, 40, 25149–25159 RSC.
- L. Okunade, Fitoterapia, 2002, 73, 1–16 CrossRef PubMed.
- A. Egunyomi, I. T. Gbadamosi and M. O. Animashahun, J. Med. Plants Res., 2011, 5, 5347–5350 CAS.
- S. Pathak, M. K. Ghosh and T. K. Ghorai, ChemistrySelect, 2018, 3, 13501–13506 CrossRef CAS.
- S. Mahadevan, S. Vijayakumar and P. Arulmozhi, Microb. Pathog., 2017, 113, 445–450 CrossRef CAS PubMed.
- B. Rodríguez-Cabo, I. Rodríguez-Palmeiro, R. Corchero, R. Rodil, E. Rodil, A. Arce and A. Soto, Water Sci. Technol., 2017, 75, 128–140 CrossRef PubMed.
- P. A. Wuyep, H. D. Musa, G. C. Ezemokwe, D. D. Nyam and M. D. SilaGyang, J. Acad. Ind. Res., 2017, 6(3), 32–38 CAS.
- R. Kaur and N. K. Dogra, International Journal of Pharmaceutical & Biological Archive, 2014, 5(5), 33–45 Search PubMed.
- T. Y. Kim, S. H. Cha, S. Cho and Y. Park, Arch. Pharmacal Res., 2016, 39, 465–473 CrossRef CAS PubMed.
- R. S. Priya, D. Geetha and P. S. Ramesh, Ecotoxicol. Environ. Saf., 2016, 134, 308–318 CrossRef CAS PubMed.
- E. Bulut and M. Ozacar, Ind. Eng. Chem. Res., 2009, 48, 5686–5690 CrossRef CAS.
- T. Kokila, P. S. Ramesh and D. Geetha, Ecotoxicol. Environ. Saf., 2016, 134, 467–473 CrossRef CAS PubMed.
- A. Saravanakumar, M. M. Peng, M. Ganesh, J. Jayaprakash, M. Mohankumar and H. T. Jang, Artif. Cells, Nanomed., Biotechnol., 2016, 45, 1165–1171 CrossRef PubMed.
- S. Bhakya, S. Muthukrishnan, M. Sukumaran and M. Muthukumar, Appl. Nanosci., 2016, 6, 755–766 CrossRef CAS.
- A. Nabikhan, K. Kandasamy, A. Raj and N. M. Alikunhi, Colloids Surf., B, 2010, 79, 488–493 CrossRef CAS PubMed.
- A. Sudhakar, K. Selvam, M. Govarthanan, B. Senthilkumar, A. Sengottaiyan, M. Stalin and T. Selvankumar, Int. J. Genet. Eng. Biotechnol., 2015, 13, 93–99 CrossRef PubMed.
- S. Ponarulselvam, C. Panneerselvam, K. Murugan, N. Aarthi, K. Kalimuthu and S. Thangamani, Asian Pac. J. Trop. Biomed., 2012, 2, 574–580 CrossRef CAS.
- H. An and B. Jin, Biotechnol. Adv., 2012, 30, 1721–1732 CrossRef CAS PubMed.
- A. Lateef, M. A. Azeez, T. B. Asafa, T. A. Yekeen, A. Akinboro, I. C. Oladipo, L. Azeez, S. E. Ajibade, S. A. Ojo, E. B. Gueguim-Kana and L. S. Beukes, J. Taibah Univ. Sci., 2016, 10, 551–562 CrossRef.
- T. C. Shekhar and G. Anju, Am. J. Ethnomed., 2014, 4, 244–249 Search PubMed.
- B. Ajitha, Y. A. K. Reddy, P. S. Reddy, H. J. Jeon and C. W. Ahn, RSC Adv., 2016, 6, 36171–36179 RSC.
- S. Mohan, O. S. Oluwafemi, S. C. George, V. P. Jayachandran, F. B. Lewu, S. P. Songca, N. Kalarikkal and S. Thomas, Carbohydr. Polym., 2014, 106, 469–474 CrossRef CAS PubMed.
- R. K. Bera and C. R. Raj, J. Photochem. Photobiol., A, 2013, 270, 1–6 CrossRef CAS.
- I. Mohmood, C. B. Lopes, I. Lopes, I. Ahmad, A. C. Duarte and E. Pereira, Environ. Sci. Pollut. Res., 2013, 20, 1239–1260 CrossRef CAS PubMed.
- M. Vanaja, K. Paulkumar, M. Baburaja, S. Rajeshkumar, G. Gnanajobitha, C. Malarkodi, M. Sivakavinesan and G. Annadurai, Bioinorg. Chem. Appl., 2014 DOI:10.1155/2014/742346.
- K. Jyoti and A. Singh, Int. J. Genet. Eng. Biotechnol., 2016, 14, 311–317 CrossRef PubMed.
| This journal is © The Royal Society of Chemistry 2019 |


