 Open Access Article
Experimental investigation of the strong stability, antibacterial and anti-inflammatory effect and high bioabsorbability of a perilla oil or linseed oil nanoemulsion system
Baoqing Han†
 a,
Biao Yu†bcd,
Lu Liua,
Yi Xiu
 a and
Hongsu Wang*a
aCollege of Food Sciences and Engineering, Jilin University, Changchun 130062, Jilin Province, China. E-mail: wanghs@jlu.edu.cn; Fax: +86-431-87835781; Tel: +86-431-87835781
bJilin Provincial Key Laboratory of Animal Embryo Engineering, College of Animal Sciences, Jilin University, Changchun 130062, Jilin Province, China
cHigh Magnetic Field Laboratory, Key Laboratory of High Magnetic Field and Ion Beam Physical Biology, Hefei Institutes of Physical Science, Chinese Academy of Sciences, Hefei, Anhui 230031, China
dUniversity of Science and Technology of China, Hefei, Anhui 230036, China
First published on 15th August 2019
Abstract
Perilla oil (PO) and linseed oil (LO) are very rich in nutrients and have great potential market value. Using the Cremophor RH40-Span80 preparation system to make a perilla oil nanoemulsion (PON) or linseed oil nanoemulsion (LON) can improve the bioavailability and stability of these oils. The effect of different reaction conditions on the stability of the emulsion was investigated. The results showed that the PON and LON have good stability at pH ≥ 7, different storage temperatures (4 °C, 25 °C, 37 °C and 55 °C) and different NaCl concentrations (0, 2, 4, 6, 8 M). Meanwhile, it was found that the content of the lipid peroxidation product malondialdehyde (MDA) in the nanoemulsion did not change significantly over 7 days, further demonstrating the stability of the nanoemulsion. Through anti-inflammatory and antibacterial tests, it was found that the PON and LON have an effective inhibitory effect on inflammation; moreover, the PON inhibits the growth of Escherichia coli, Salmonella enteritidis and Pseudomonas tolaasii, and the LON has an inhibitory effect on Staphylococcus aureus and Pseudomonas tolaasii (inhibition zone > 10 mm). In addition, we found that there were no pathological differences in the heart, liver, spleen and kidney of Kunming mice between the PO and PON groups and the LO and LON groups. Furthermore, after intraperitoneal injection of P 407 into mice, the comparison between PON and PO and between LON and LO showed that the blood lipid levels of the mice in the PON and LON treatment groups increased, indicating that the absorption capacity of the small intestine of the mice for the PON and LON was enhanced. Therefore, the preparation of the PON and LON has good development prospects and opens up opportunities in the development of the food industry.
1. Introduction
Perilla (Perilla frutescens), a genus of annual herbs of the family Lamiaceae,1 is an edible plant widely used in food pigmentation and flavoring in Japan and China and that is also used as an oil in Europe, Russia and the United States.2 PO is rich in α-linolenic acid (ω-3 fatty acid) and has a beneficial effect on the human body. Many countries have begun to develop the perilla seed oil industry. In addition to ω-3 and other fatty acids, perilla seed oil contains many valuable nutrients and other hydrophilic phytochemicals, such as myristic acid, apigenin, luteolin and glycosides.3 Moreover, some studies have shown that the PO has antioxidative,4 anti-inflammatory5 and antibacterial effects.6 Because of these characteristics, PO has been widely used in the fields of cosmetics and medicine.Linen is an annual herb of the family Linaceae. LO is extracted from linseed by chemical or mechanical methods. Currently, the extraction of the LO is generally carried out by cold pressing.7 LO is rich in α-linolenic acid, linoleic acid and oleic acid, especially unsaturated fatty acids. As functional oil rich in ω-3 and ω-6 unsaturated fatty acids, LO has nutritional health and therapeutic effects.8 Studies have shown that LO has a positive effect on reducing the level of blood lipids,9 preventing tumors,10 cancer,11 and other diseases.12
Although PO and LO have many advantages, the bioactive substances in the PO and LO are easily affected by air, sunlight and high temperature. PO and LO have low water solubility, which causes the loss of biological activity and severely limits the application of the PO and LO in food industries.13,14 However, the bioactive substances in these essential oils can be well protected by emulsification.
Nanoemulsions are a thermodynamically stable system generally composed of an aqueous phase, an oil phase and a surfactant.15 Furthermore, the emulsion is stabilized by the addition of surfactants and then subjected to a homogeneous emulsification treatment to obtain an emulsion having a particle diameter of less than 100 nm.16 Due to their small particle size, nanoemulsions tend to have transparent/translucent properties and long-term physical stability. Moreover, compared to microemulsions, nanoemulsions can be prepared with moderate concentrations of surfactants and have broad application prospects in the chemical, pharmaceutical, cosmetic and petroleum drilling fluid fields.17 Liu N. et al. reported the extraction of protein from defatted perilla seed and used it as a surfactant to prepare an oil-in-water emulsion.2 Results showed that increasing perilla seed protein concentration was favorable for the emulsions against aggregation/flocculation. Utama D. T. et al. reported the use of PO and canola oil as raw materials to replace the animal fat method, which opened up a new direction for the application of nanoemulsion.18 Huang J. et al. studied the preparation of primary emulsions using Tween20 and lecithin as emulsifiers and prepared a lecithin–chitosan film multilayer emulsion of the LO by layer-by-layer electrostatic deposition.19 In many studies on nanoemulsion, they contain a single nonionic surfactant; however, the mixed surfactants have better properties than single surfactants.20 Maximum solubilization of the dispersed phase with a minimum amount of surfactant can be achieved using a mixture of surfactants.21 The surfactant used in this study was Cremophor RH40 and the cosurfactant was Span80. Cremophor RH40 can be used in a wide variety of pharmaceuticals and cosmetics due to its low toxicity and good compatibility with other ingredients in complex formulations.22 Span80 is a widely used nonionic surfactant that can be found in many studies on the preparation of the emulsion, often in combination with Tween surfactants.
In this paper, we have studied the preparation, stability, bioavailability and application (such as anti-inflammatory and antibacterial effects) of PON and LON, and determine the toxicity of the Cremophor RH40-Span80 preparation system. The information obtained from this study should provide valuable information for food and beverage applications (as shown in Scheme 1).
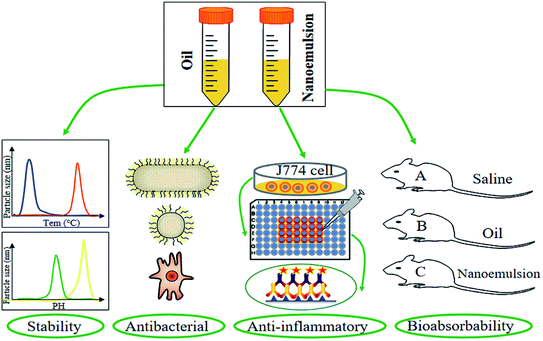 | ||
| Scheme 1 Strong stability, antibacterial, anti-inflammatory effect and high bioabsorbability of a perilla oil or linseed oil nanoemulsion system. | ||
2 Materials and methods
2.1 Materials and animals
The following materials were used: perilla oil, linseed oil (Shengji Industrial Co., Ltd., Jilin City, Jilin Province); Cremophor RH40 (Dalian Meilun Biotechnology Co., Ltd); Span80 (Tianjin Guangfu Fine Chemical Research Institute); H&E staining kit (Boster Inc, Beijing, China); and neutral-buffered formalin (Beijing Chemical Industry, Beijing, China). Fasting plasma total cholesterol (TC), triglyceride (TG), low-density lipoprotein cholesterol (LDL-c), and high-density lipoprotein cholesterol (HDL-c) levels were determined using kits from Biosino (Beijing, China). An Elisa kit was obtained from Thermo Fisher Scientific Inc (US).Ten-week-old Kunming male mice (n = 30) were purchased from the Laboratory Animal Center of Jilin University (Jilin, China). The mice were provided standard rodent chow and water and housed in cages (5 mice per cage) that were placed in an SPF animal facility with the laboratory maintained at a temperature of 23 °C and 40% humidity with a 12![[thin space (1/6-em)]](https://www.rsc.org/images/entities/char_2009.gif) :
:![[thin space (1/6-em)]](https://www.rsc.org/images/entities/char_2009.gif) 12 h light
12 h light![[thin space (1/6-em)]](https://www.rsc.org/images/entities/char_2009.gif) :
:![[thin space (1/6-em)]](https://www.rsc.org/images/entities/char_2009.gif) dark cycle. All animal welfare and experimental procedures were performed strictly according to the National Institutes of Health Guide for the Care and Use of Laboratory Animals (NIH publications no. 8023, revised 1978). Moreover, the procedures were approved by the Institutional Animal Care and Use Committee of Jilin University under approved protocol number SY201901004.
dark cycle. All animal welfare and experimental procedures were performed strictly according to the National Institutes of Health Guide for the Care and Use of Laboratory Animals (NIH publications no. 8023, revised 1978). Moreover, the procedures were approved by the Institutional Animal Care and Use Committee of Jilin University under approved protocol number SY201901004.
2.2 Pseudoternary phase diagram
A titration method was used to plot the pseudoternary phase diagram (PTPD).23 The oil (PO or LO) and surfactant (a combination of Cremophor RH40 and Span80 at 3/1 (w/w) ratio) were mixed in different proportions (9![[thin space (1/6-em)]](https://www.rsc.org/images/entities/char_2009.gif) :
:![[thin space (1/6-em)]](https://www.rsc.org/images/entities/char_2009.gif) 1, 8
1, 8![[thin space (1/6-em)]](https://www.rsc.org/images/entities/char_2009.gif) :
:![[thin space (1/6-em)]](https://www.rsc.org/images/entities/char_2009.gif) 2, 7
2, 7![[thin space (1/6-em)]](https://www.rsc.org/images/entities/char_2009.gif) :
:![[thin space (1/6-em)]](https://www.rsc.org/images/entities/char_2009.gif) 3, 6
3, 6![[thin space (1/6-em)]](https://www.rsc.org/images/entities/char_2009.gif) :
:![[thin space (1/6-em)]](https://www.rsc.org/images/entities/char_2009.gif) 4, 5
4, 5![[thin space (1/6-em)]](https://www.rsc.org/images/entities/char_2009.gif) :
:![[thin space (1/6-em)]](https://www.rsc.org/images/entities/char_2009.gif) 5, 4
5, 4![[thin space (1/6-em)]](https://www.rsc.org/images/entities/char_2009.gif) :
:![[thin space (1/6-em)]](https://www.rsc.org/images/entities/char_2009.gif) 6, 3
6, 3![[thin space (1/6-em)]](https://www.rsc.org/images/entities/char_2009.gif) :
:![[thin space (1/6-em)]](https://www.rsc.org/images/entities/char_2009.gif) 7, 2
7, 2![[thin space (1/6-em)]](https://www.rsc.org/images/entities/char_2009.gif) :
:![[thin space (1/6-em)]](https://www.rsc.org/images/entities/char_2009.gif) 8, 1
8, 1![[thin space (1/6-em)]](https://www.rsc.org/images/entities/char_2009.gif) :
:![[thin space (1/6-em)]](https://www.rsc.org/images/entities/char_2009.gif) 9) in a beaker. Next, a magnetic stirrer was placed in the beaker, and the solution was stirred at 60 °C. A constant pressure burette was used to titrate the water at a constant rate in the beaker while observing the change of the liquid phase.
9) in a beaker. Next, a magnetic stirrer was placed in the beaker, and the solution was stirred at 60 °C. A constant pressure burette was used to titrate the water at a constant rate in the beaker while observing the change of the liquid phase.
2.3 Preparation of oil-in-water emulsions
The mixed surfactants (Cremophor RH40 and Span80) were thoroughly stirred by a magnetic stirrer for 5 minutes to ensure that the surfactants were thoroughly mixed, and the bath temperature was 60 °C. The oil phase (PO or LO) was first mixed with the mixed surfactant, and a preliminary emulsion was obtained by the water titration method. During the preparation of nanoemulsion, PO or LO was used as the oil phase. The initially obtained emulsion was emulsified by a high-speed shear emulsifier (IKA T25 digital ULTRA-TURRAX, IKA, Germany) for 5 minutes, and the shear rate was 10![[thin space (1/6-em)]](https://www.rsc.org/images/entities/char_2009.gif) 000 rpm. Subsequently, the preliminary treatment emulsion was further emulsified for 15 minutes using ultrasonic waves of 500 W to obtain the nanoemulsion. The obtained nanoemulsion was placed in a centrifuge tube and sealed for later analysis.
000 rpm. Subsequently, the preliminary treatment emulsion was further emulsified for 15 minutes using ultrasonic waves of 500 W to obtain the nanoemulsion. The obtained nanoemulsion was placed in a centrifuge tube and sealed for later analysis.
2.4 Particle size and zeta potential measurements
The nanoemulsion needed to be diluted 50-fold with deionized water before measurement. The particle size and zeta potential of the nanoemulsion were measured at 25 °C by a dynamic light scattering instrument equipped with a zeta DTS1060C cell (Zetasizer Nano ZS, Malvern Instruments, Ltd., Malvern, UK). The measurement results showed the particle size (size, nm) and zeta potential (mV) of the nanoemulsion. All measurements were performed in triplicate.2.5 Stability analysis of nanoemulsion under environmental stresses
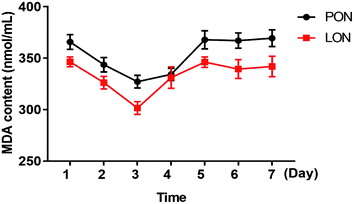
To explore the stability of the nanoemulsion under different environmental conditions, the particle size and zeta potential of the sample were measured at different temperatures (4–55 °C), different pH (2–10) and different NaCl concentrations (0–8 M). Moreover, the lipid peroxidation is an important indicator of stability. MDA appears to be the most mutagenic product of lipid peroxidation. Meanwhile, MDA has been widely used for many years as a convenient biomarker for lipid peroxidation of ω-3 and ω-6 fatty acids because of its facile reaction with thiobarbituric acid (TBA).24The nanoemulsion samples were dispensed into clean glass tubes and stored at 4 °C, 25 °C, 37 °C or 55 °C to evaluate the stability of the samples. The particle size and zeta potential of each sample were measured after 1 day, 5 days, 10 days and 15 days. All measurements were performed in triplicate.
The pH of the nanoemulsion sample was adjusted between 2 and 10 with 1.0 or 0.5 M NaOH and/or CH3COOH. Then, the nanoemulsion samples were transferred to clean glass tubes and stored at 25 °C. The particle size, zeta potential and physical stability of the sample were measured after 1 day and 7 days. All measurements were performed in triplicate.
The nanoemulsion sample was added to an equal volume of NaCl solutions at different concentrations (0–8 M). The sample was then evenly mixed by a vortex mixer, placed in a clean glass test tube and stored at 25 °C. The particle size, zeta potential and physical stability of the sample were measured after 1 day and 7 days. All measurements were performed in triplicate.
Place the sample (0.2 mL) in a 10 mL centrifuge tube, then place the reagent and vortex to mix. Then, it was bathed in a water bath at 95 °C for 40 minutes, cooled in an ice water bath, centrifuged at 4000 rpm for 15 minutes to obtain a supernatant. The supernatant was poured into a 96-well plate, and the absorbance was measured with enzyme-labeled instrument (Synergy HT, BioTek Instruments, Inc., USA) at 532 nm. This test detected MDA in nanoemulsions by MDA kit (Nanjing Jiancheng Bioengineering Institute, China). All measurements were performed in triplicate.
2.6 Cytotoxicity test
J774 cells (a murine macrophage cell line) were cultured in DMEM supplemented with 10% fetal bovine plasma (FBS, Gibco, USA). J774 cells maintained at 37 °C in a humidified atmosphere containing 5% CO2. Cytotoxicity was studied by the addition of PON and LON. A total of 5 × 10⁴ J774 cells per well were plated in a 96-well plate and treated with PON and LON (0.1, 0.2, 0.4 μg mL−1) for 5 h, then the LDH activity in the supernatant of the reaction system was detected, and the cytotoxicity was determined after 5 h in a 96-well plate reader by monitoring the absorbance at 490 nm. The J774 cells were supplemented with 0.2% Triton X-100 and DMSO to compare the role of DMEM in PON and LON induced cytotoxicity.252.7 Cellular anti-inflammatory test
J774 cells were treated with the L. monocytogenes (ATCC19115). A total of 3 × 10⁵ J774 cells per well were plated in a 24-well plate with 500 μL of medium and treated with PON and LON (0, 10, 20, 40 μg mL−1) for 24 h. Then, L. monocytogenes was added to the medium, and the cytokine level was determined after 5 h.2.8 Animal acute toxicity test
Male mice were fed ad libitum for 2 weeks and randomly divided into 5 groups, five mice in each group: (1) saline control group; (2) PO group; (3) PON group; (4) LO group; (5) LON group. After dissolving the PON and LON in water, they were intragastrically administered at a dose of 140 g kg−1. The treatments were administered to the stomach every 6 h and 2 times in one day. During 7 days of gavage administration, the clinical symptoms of body weight, mental state, activity, fur luster, appetite excretion, and mortality in each group of mice were recorded. After 7 days, the liver, spleen, kidney and heart of the mice in each group were observed and collected for routine pathological tissue preparation and H&E staining. The pathological changes in various organs were observed under a microscope.2.9 H&E staining
As previously reported,26 the tissue of the mice was assessed with an H&E staining Kit. Microscopic images were taken using a Nikon Eclipse E600 (Spach Optics Inc., New York, USA).2.10 Intestinal lipid absorption test in mice
According to the literature,26–28 the mice were fasted to undergo intestinal lipid absorption test at 12 weeks of age. At 30 minutes after the injection of P 407 (100 mg mL−1), LON and PON were orally administered at the dose of 20 g kg−1, whereas saline, LO and PO were administered to the mice in the control groups. Blood was collected via a tail vein nick at baseline and 3 h and 6 h postinjection. The plasma TG, TC, HDL-c and LDL-c were analyzed using commercial kits.2.11 Gut transit test in mice
Overnight-fasted mice were gavaged with 200 μL of Evans blue mixed liquor (5% Evans blue and 5% gum arabic in physiological saline, nanoemulsion, or oil solution). Afterward, the mice had free access to food and water, and the time until the Evans blue appeared in the feces was detected according to a preliminary experiment.272.12 Antibacterial test
Different bacteriostatic effect of PON and LON were tested on foodborne pathogenic bacteria, such as Escherichia coli (ATCC25922), Staphylococcus aureus (ATCC29213), Salmonella enteritidis (BNCC103134) and Pseudomonas tolaasii (BNCC134224) (BeNa Biological Co., Ltd, Beijing, China). The size of the inhibition zone indicates the magnitude of the bacteriostatic performance. The inhibition zone was measured by the Oxford Cup method.29 A 1.0 × 10⁵ CFU mL−1 experimental bacterial suspension was evenly coated on the agar plate and allowed to stand for a while. After drying, the agar plate was placed in a culture plate at an inner diameter of 6.0 mm, an outer diameter of 7.8 mm and a height of 10.0 mm. A certain amount of bacteriostatic agent (200 μL) was added to the Oxford Cup, and then the culture plate was incubated in a biochemical incubator at 37 °C for 12 h to measure the diameter of the inhibition zone.2.13 Statistical analysis
The experimental data were expressed as the mean value ± standard deviation (mean ± SD). Statistical analysis was performed by ORIGIN (Version 8.0; Microsoft Software Inc., Northampton, MA), and data were analyzed by t-test using the GraphPad prism 7.00 software (San Diego, America). P < 0.05 was regarded as significant. All measurements were performed in triplicate.3 Results and discussions
3.1 Pseudoternary phase diagram of PON and LON
To obtain the best ratio of the oil phase and mixed surfactant, we made emulsions in different proportions (1![[thin space (1/6-em)]](https://www.rsc.org/images/entities/char_2009.gif) :
:![[thin space (1/6-em)]](https://www.rsc.org/images/entities/char_2009.gif) 9, 2
9, 2![[thin space (1/6-em)]](https://www.rsc.org/images/entities/char_2009.gif) :
:![[thin space (1/6-em)]](https://www.rsc.org/images/entities/char_2009.gif) 8, 3
8, 3![[thin space (1/6-em)]](https://www.rsc.org/images/entities/char_2009.gif) :
:![[thin space (1/6-em)]](https://www.rsc.org/images/entities/char_2009.gif) 7, 4
7, 4![[thin space (1/6-em)]](https://www.rsc.org/images/entities/char_2009.gif) :
:![[thin space (1/6-em)]](https://www.rsc.org/images/entities/char_2009.gif) 6, 5
6, 5![[thin space (1/6-em)]](https://www.rsc.org/images/entities/char_2009.gif) :
:![[thin space (1/6-em)]](https://www.rsc.org/images/entities/char_2009.gif) 5, 6
5, 6![[thin space (1/6-em)]](https://www.rsc.org/images/entities/char_2009.gif) :
:![[thin space (1/6-em)]](https://www.rsc.org/images/entities/char_2009.gif) 4, 7
4, 7![[thin space (1/6-em)]](https://www.rsc.org/images/entities/char_2009.gif) :
:![[thin space (1/6-em)]](https://www.rsc.org/images/entities/char_2009.gif) 3, 8
3, 8![[thin space (1/6-em)]](https://www.rsc.org/images/entities/char_2009.gif) :
:![[thin space (1/6-em)]](https://www.rsc.org/images/entities/char_2009.gif) 2, 9
2, 9![[thin space (1/6-em)]](https://www.rsc.org/images/entities/char_2009.gif) :
:![[thin space (1/6-em)]](https://www.rsc.org/images/entities/char_2009.gif) 1) and analyzed PTPD. Tables 1, 2 and Fig. 1 present the PTPD for the oil-surfactants-water system, which shows the particle size and polydispersity indices of the PON and LON at 1 and 7 days. As shown in Tables 1 and 2, the nanoemulsion (PON and LON) can be formed only when the ratio of oil to surfactant is 4
1) and analyzed PTPD. Tables 1, 2 and Fig. 1 present the PTPD for the oil-surfactants-water system, which shows the particle size and polydispersity indices of the PON and LON at 1 and 7 days. As shown in Tables 1 and 2, the nanoemulsion (PON and LON) can be formed only when the ratio of oil to surfactant is 4![[thin space (1/6-em)]](https://www.rsc.org/images/entities/char_2009.gif) :
:![[thin space (1/6-em)]](https://www.rsc.org/images/entities/char_2009.gif) 6, 3
6, 3![[thin space (1/6-em)]](https://www.rsc.org/images/entities/char_2009.gif) :
:![[thin space (1/6-em)]](https://www.rsc.org/images/entities/char_2009.gif) 7, 2
7, 2![[thin space (1/6-em)]](https://www.rsc.org/images/entities/char_2009.gif) :
:![[thin space (1/6-em)]](https://www.rsc.org/images/entities/char_2009.gif) 8, or 1
8, or 1![[thin space (1/6-em)]](https://www.rsc.org/images/entities/char_2009.gif) :
:![[thin space (1/6-em)]](https://www.rsc.org/images/entities/char_2009.gif) 9, and the optimal ratio of oil to surfactant can be obtained after repeated trials and tests. The particle size and polydispersity indices of the PON and LON were tested at 1 and 7 days. When the ratio of the oil phase to the mixed surfactant was 3
9, and the optimal ratio of oil to surfactant can be obtained after repeated trials and tests. The particle size and polydispersity indices of the PON and LON were tested at 1 and 7 days. When the ratio of the oil phase to the mixed surfactant was 3![[thin space (1/6-em)]](https://www.rsc.org/images/entities/char_2009.gif) :
:![[thin space (1/6-em)]](https://www.rsc.org/images/entities/char_2009.gif) 7, the particle size of the prepared nanoemulsion hardly changed, and the ratio of oil phase to nanoemulsion was also relatively high enough to meet the requirements of subsequent tests. Moreover, the polydispersity indices of PON and LON at 1 and 7 days were less than 0.5, and after 7 days of storage, the polydispersity indices of the two nanoemulsions was smaller than those of the nanoemulsions stored for 1 day, which indicates that the PON and LON exhibit high stability.30 Zhu Y. et al. determined the ratio of oil phase to surfactant by comparing the size of the emulsified zone in PTPD.31 Li P. et al. determined surfactants and cosurfactants by comparing the size of the emulsified zone in PTPDs formed by different surfactants.15 In this study, PTPD was drawn only by studying different proportions of the oil phase and mixed surfactant, and the optimal ratio was explored by using particle size and dispersion coefficient as indicators.
7, the particle size of the prepared nanoemulsion hardly changed, and the ratio of oil phase to nanoemulsion was also relatively high enough to meet the requirements of subsequent tests. Moreover, the polydispersity indices of PON and LON at 1 and 7 days were less than 0.5, and after 7 days of storage, the polydispersity indices of the two nanoemulsions was smaller than those of the nanoemulsions stored for 1 day, which indicates that the PON and LON exhibit high stability.30 Zhu Y. et al. determined the ratio of oil phase to surfactant by comparing the size of the emulsified zone in PTPD.31 Li P. et al. determined surfactants and cosurfactants by comparing the size of the emulsified zone in PTPDs formed by different surfactants.15 In this study, PTPD was drawn only by studying different proportions of the oil phase and mixed surfactant, and the optimal ratio was explored by using particle size and dispersion coefficient as indicators.
| Oil/surfactants | Water (%) | Day 1 | Day 7 | |||
|---|---|---|---|---|---|---|
| Particle size (nm) | PDI | Particle size (nm) | PDI | |||
| 1 | 9![[thin space (1/6-em)]](https://www.rsc.org/images/entities/char_2009.gif) : :![[thin space (1/6-em)]](https://www.rsc.org/images/entities/char_2009.gif) 1 1 |
70 | 269.3 ± 17.0093 | 0.771 ± 0.0702 | 229.7 ± 9.7606 | 0.606 ± 0.2230 |
| 2 | 8![[thin space (1/6-em)]](https://www.rsc.org/images/entities/char_2009.gif) : :![[thin space (1/6-em)]](https://www.rsc.org/images/entities/char_2009.gif) 2 2 |
69 | 247.9 ± 13.5328 | 0.767 ± 0.0548 | 287.8 ± 19.5793 | 0.783 ± 0.0866 |
| 3 | 7![[thin space (1/6-em)]](https://www.rsc.org/images/entities/char_2009.gif) : :![[thin space (1/6-em)]](https://www.rsc.org/images/entities/char_2009.gif) 3 3 |
66 | 580.2 ± 17.6745 | 0.546 ± 0.0394 | 285.2 ± 15.0458 | 0.618 ± 0.1240 |
| 4 | 6![[thin space (1/6-em)]](https://www.rsc.org/images/entities/char_2009.gif) : :![[thin space (1/6-em)]](https://www.rsc.org/images/entities/char_2009.gif) 4 4 |
65 | 194.1 ± 0.7846 | 0.423 ± 0.0028 | 221.0 ± 4.7140 | 0.354 ± 0.0516 |
| 5 | 5![[thin space (1/6-em)]](https://www.rsc.org/images/entities/char_2009.gif) : :![[thin space (1/6-em)]](https://www.rsc.org/images/entities/char_2009.gif) 5 5 |
70 | 138.2 ± 0.1886 | 0.275 ± 0.0039 | 138.7 ± 0.4320 | 0.274 ± 0.0033 |
| 6 | 4![[thin space (1/6-em)]](https://www.rsc.org/images/entities/char_2009.gif) : :![[thin space (1/6-em)]](https://www.rsc.org/images/entities/char_2009.gif) 6 6 |
65 | 91.2 ± 0.4172 | 0.417 ± 0.0034 | 86.1 ± 0.3175 | 0.307 ± 0.0090 |
| 7 | 3![[thin space (1/6-em)]](https://www.rsc.org/images/entities/char_2009.gif) : :![[thin space (1/6-em)]](https://www.rsc.org/images/entities/char_2009.gif) 7 7 |
70 | 52.8 ± 0.4645 | 0.481 ± 0.0014 | 47.9 ± 2.4354 | 0.460 ± 0.0052 |
| 8 | 2![[thin space (1/6-em)]](https://www.rsc.org/images/entities/char_2009.gif) : :![[thin space (1/6-em)]](https://www.rsc.org/images/entities/char_2009.gif) 8 8 |
73 | 43.2 ± 0.5522 | 0.567 ± 0.0075 | 38.2 ± 0.2968 | 0.431 ± 0.0130 |
| 9 | 1![[thin space (1/6-em)]](https://www.rsc.org/images/entities/char_2009.gif) : :![[thin space (1/6-em)]](https://www.rsc.org/images/entities/char_2009.gif) 9 9 |
72 | 34.5 ± 0.3429 | 0.386 ± 0.0127 | 28.3 ± 1.0471 | 0.368 ± 0.0163 |
| Oil/surfactants | Water (%) | Day 1 | Day 7 | |||
|---|---|---|---|---|---|---|
| Particle size (nm) | PDI | Particle size (nm) | PDI | |||
| 1 | 9![[thin space (1/6-em)]](https://www.rsc.org/images/entities/char_2009.gif) : :![[thin space (1/6-em)]](https://www.rsc.org/images/entities/char_2009.gif) 1 1 |
69 | 192.9 ± 5.6334 | 0.629 ± 0.0351 | 295.9 ± 18.8716 | 0.759 ± 0.0189 |
| 2 | 8![[thin space (1/6-em)]](https://www.rsc.org/images/entities/char_2009.gif) : :![[thin space (1/6-em)]](https://www.rsc.org/images/entities/char_2009.gif) 2 2 |
66 | 265.9 ± 16.7428 | 0.859 ± 0.0284 | 232.7 ± 8.8432 | 0.743 ± 0.0469 |
| 3 | 7![[thin space (1/6-em)]](https://www.rsc.org/images/entities/char_2009.gif) : :![[thin space (1/6-em)]](https://www.rsc.org/images/entities/char_2009.gif) 3 3 |
70 | 274.5 ± 17.8034 | 0.682 ± 0.1075 | 247.2 ± 7.4406 | 0.783 ± 0.0095 |
| 4 | 6![[thin space (1/6-em)]](https://www.rsc.org/images/entities/char_2009.gif) : :![[thin space (1/6-em)]](https://www.rsc.org/images/entities/char_2009.gif) 4 4 |
69 | 188.5 ± 3.0269 | 0.403 ± 0.0176 | 189.6 ± 1.7211 | 0.415 ± 0.0111 |
| 5 | 5![[thin space (1/6-em)]](https://www.rsc.org/images/entities/char_2009.gif) : :![[thin space (1/6-em)]](https://www.rsc.org/images/entities/char_2009.gif) 5 5 |
72 | 142.8 ± 2.5807 | 0.337 ± 0.0505 | 137.6 ± 0.6600 | 0.268 ± 0.0048 |
| 6 | 4![[thin space (1/6-em)]](https://www.rsc.org/images/entities/char_2009.gif) : :![[thin space (1/6-em)]](https://www.rsc.org/images/entities/char_2009.gif) 6 6 |
67 | 80.0 ± 1.8437 | 0.328 ± 0.0342 | 90.9 ± 1.3696 | 0.338 ± 0.0297 |
| 7 | 3![[thin space (1/6-em)]](https://www.rsc.org/images/entities/char_2009.gif) : :![[thin space (1/6-em)]](https://www.rsc.org/images/entities/char_2009.gif) 7 7 |
70 | 47.9 ± 1.7435 | 0.474 ± 0.0156 | 51.2 ± 0.4061 | 0.440 ± 0.0051 |
| 8 | 2![[thin space (1/6-em)]](https://www.rsc.org/images/entities/char_2009.gif) : :![[thin space (1/6-em)]](https://www.rsc.org/images/entities/char_2009.gif) 8 8 |
70 | 43.4 ± 0.5797 | 0.464 ± 0.0026 | 44.5 ± 1.6252 | 0.438 ± 0.0135 |
| 9 | 1![[thin space (1/6-em)]](https://www.rsc.org/images/entities/char_2009.gif) : :![[thin space (1/6-em)]](https://www.rsc.org/images/entities/char_2009.gif) 9 9 |
70 | 30.8 ± 0.4956 | 0.293 ± 0.0090 | 21.6 ± 1.2515 | 0.296 ± 0.0057 |
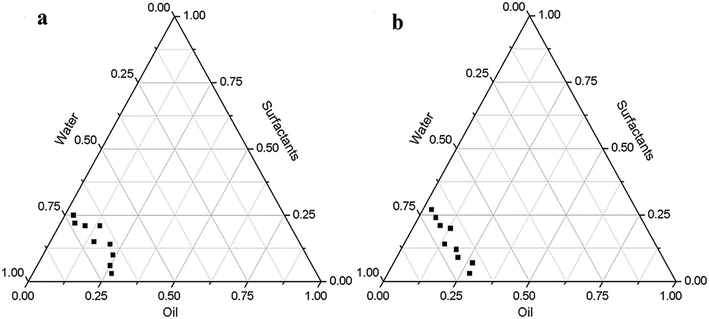 | ||
| Fig. 1 Pseudoternary phase diagram for (a) is perilla oil nanoemulsion and (b) is linseed oil nanoemulsion. | ||
3.2 The influence of environmental stresses on PON and LON
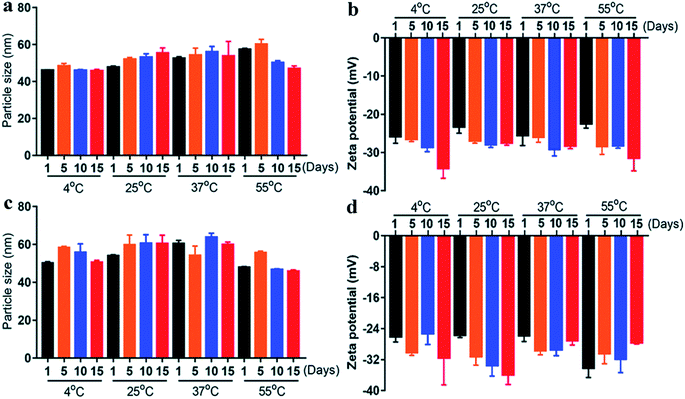
The particle size of the nanoemulsion is one of the important criteria for evaluating its stability. Moreover, when the particle size of a nanoemulsion decreases, its stability becomes greater.32 Zeta potential is a physical indicator for measuring the intensity of electrostatic repulsion between particles in a suspension system.33 Furthermore, the larger the absolute value of the zeta potential is, the more stable the nanoemulsion system.34In addition, Fig. 2 shows the zeta potential and particle size of nanoemulsions at different temperatures. When the two nanoemulsions were stored at 4 °C, 25 °C, 37 °C and 55 °C, they all showed a clear and transparent state, and there was no turbid stratification, which was consistent with the characteristics of nanoemulsion.36 Furthermore, when the PON and LON were stored at 55 °C for 15 days, the change in particle size was smaller than 1 day (<3 nm) and the zeta potential change very small (<−5 mV), which was probably not caused by electrostatic repulsion between particles but rather by a synergistic effect of the surfactant.37 Moreover, under different temperature and storage time conditions, there were no significant change in particle size and zeta potential of PON and LON. It seems certain that emulsion has good stability at 4–55 °C. Briefly, we simulated the changes in the stability of nanoemulsions in refrigerators, room temperature, in vivo and high-temperature storage or transportation conditions by testing the indicators at 4 °C, 25 °C, 37 °C and 55 °C, which is significant temperatures in the food industry.
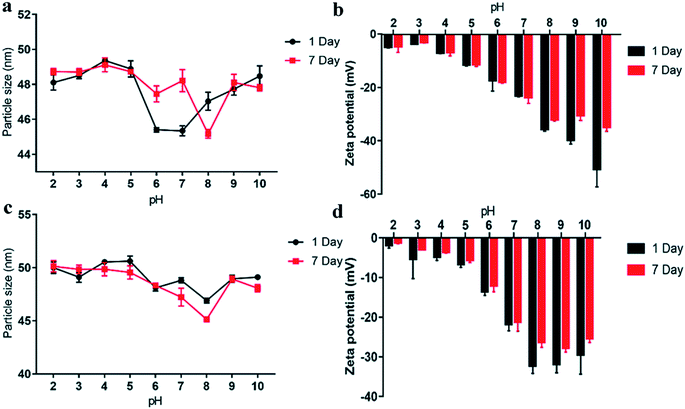
The stability of the sample at different pH values were determined by measuring the particle size and zeta potential of the nanoemulsion at 25 °C and pH 2–10. As shown in Fig. 3, the absolute value of zeta potential of the emulsion increased with the increasing pH. In addition the absolute value of zeta potential was less than 20 at pH < 7, which indicated that the PON and LON were unstable under acidic conditions.40 Meanwhile, whether it was PON or LON, the particle size appeared to increase first, then decreased and then rose in the range of pH 2–10, which may be due to the acidity of the protein. Since PO and LO are rich in proteins, the effects of acidic or alkaline conditions on proteins affect the properties of PON and LON.18,41 Strong alkaline condition also affected the chemical properties of PO and LO protein, which led to the protein-particle binding. Although the particle size of the emulsion changes within this pH range, the change in particle size was very small (<5 nm) with little effect. Interestingly, the absolute value of the zeta potential was relatively small at pH < 7, and there was no delamination or turbidity during storage at room temperature (25 °C) for 7 days. This phenomenon needed further study.
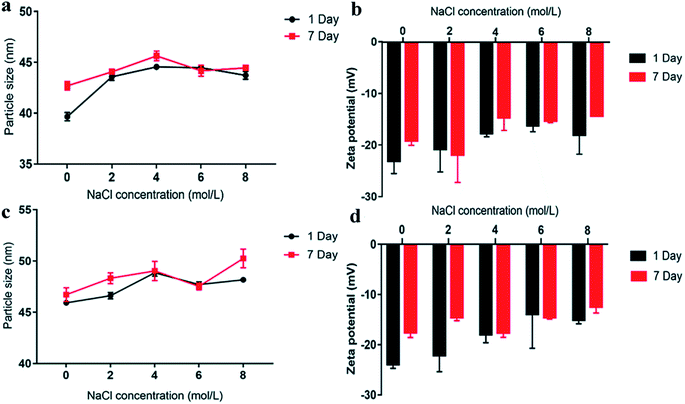
As shown in Fig. 4, although the particle size of the sample (stored for 1 and 7 days) changed little in the presence of NaCl, the absolute value of zeta potential of the nanoemulsion decreased, and the higher the NaCl concentration was, the lower the absolute value of the zeta potential. This effect was because as the ionic strength increases, the electric double layer around the emulsion droplets was compressed, and there was counterion binding between the cation and the negatively charged emulsion droplets.17 As shown in Fig. 4(a and b), when NaCl concentration was at 0–2 M, the zeta potential (1–7 day) of PON does not significantly change (<5 mV). In addition, the variation trend of particle size was similar with that in zeta potential, indicating that the PON was highly stable at low salt concentrations. Although zeta potential decreased with increasing NaCl concentration (4–8 M), the change in particle size within this concentration range was small. Furthermore, the zeta potential was approximately −20 mV, so PON was still relatively stable under 4–8 M NaCl concentration. In addition, as shown in Fig. 4(c and d), the zeta potential of LON generally decreased after adding NaCl solution of different concentrations, indicating that NaCl had a certain effect on LON that reduced its stability.
3.3 Cytotoxicity test and cellular anti-inflammatory test results
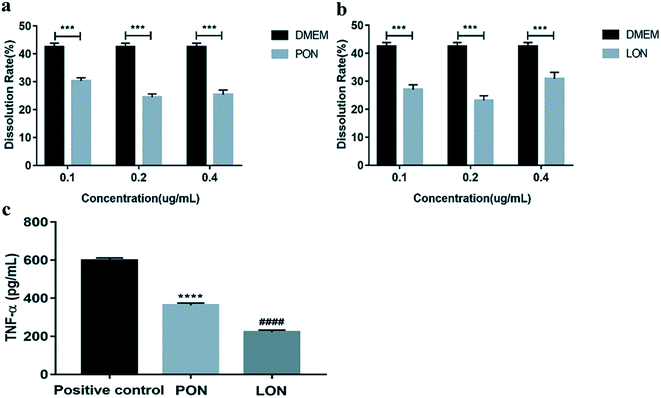
J774 cells were treated with different concentrations (0.1, 0.2 and 0.4 μg mL−1) of PON and LON for 24 h to determine whether LON and PON induce cytotoxicity. Compared to the control group, PON groups (0.1, 0.2 and 0.4 μg mL−1) showed significantly decreased the dissolution rates in J774 cells (p < 0.001). Moreover, the LON groups (0.1, 0.2 and 0.4 μg mL−1) presented the same results (p < 0.001). Furthermore, PON and LON treatment suppressed the expression of tumor necrosis factor α (TNF-α) and the effect of the treatment in the LON group was weaker than that of the treatment in PON group in J774 cells (p < 0.0001). Collectively, these results indicated that LON and PON may not be toxic and may reduce the level of TNF-α in J774 cells (Fig. 6).3.4 Increased absorption capacity of PON and LON in mouse small intestine
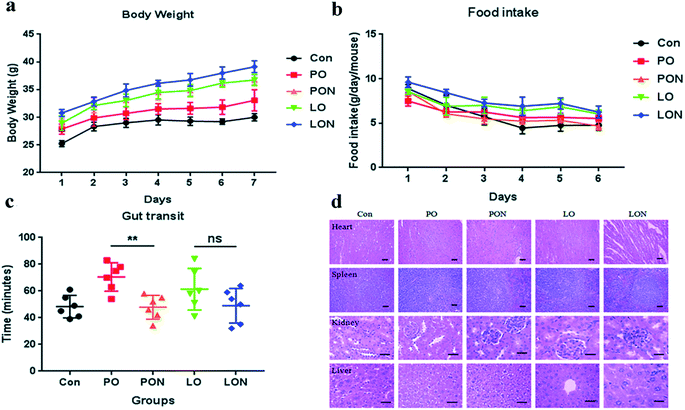
To further verify the effect of the nanoemulsion on the physiological state of mice, we performed in vivo experiments in mice. When the mouse experiment was completed, our data in all the experimental groups showed that the average body weight in the LON group was significantly higher than that in the LO group, while the average daily food intake in the LON group was not significantly different from that in the LO group. Similarly, although the average daily food intake in the PON group was similar with that in the PO group, the average body weight in the PON group was significantly higher than that in the PO group. Therefore, our results indicate that mice have better absorption capacity for LON than for LO. Similarly, compared to PO, PON has enhanced absorption capacity. In addition, H&E staining showed no significant pathological changes in heart, liver, spleen and kidney in the mice in the LON, LO, PON, and PO groups compared with those in the blank control group. It was shown that LON and PON do not induce toxic effects and damage organs. Furthermore, to explain why the LON and PON have better absorption capacity than LO and PO, the results of intestinal transport tests in mice showed that compared with the PO group, the PON group significantly shortened the time of emergence of Evans blue in the feces (Fig. 7).3.5 PON and LON treatment groups have a better intestinal lipid absorption capacity
To further compare the PON and LON groups of mice to the PO and LO groups, we explored the intestinal absorption capacity of the mice in each experimental group. We examined plasma levels of TG, TC, HDL-c and LDL-c at 0 h, 3 h and 6 h at 12 weeks of age (Fig. 8). The results showed that the TG and TC levels in the PON group were significantly higher than those in the PO group at 6 h in male mice (p < 0.05). Furthermore, the TC content in the plasma of male mice in the LON group was significantly higher than that in the plasma of male mice in the LO group at 6 h (p < 0.05). In HDL-C levels, PON group were significantly higher than those in the PO group at 3 h (p < 0.05). Therefore, our results indicate that at the same time point, mice in the PON and LON groups had better ability to absorb lipids in the small intestine than those in the PO and LO groups, respectively, resulting in a significant increase in plasma TG and TC levels.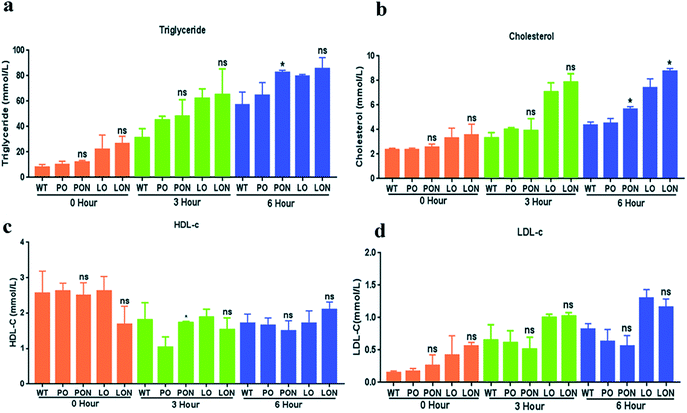 | ||
| Fig. 8 (a)–(d) shows the levels of TG, TC, HDL-c and LDL-c in the plasma of mice in each sample group, wherein figures (a)–(d) are the results for male mice. *, p < 0.05; ns, not significant. | ||
3.6 Antibacterial effect test
As shown in Table 3, the PON has a significant inhibitory effect on E. coli, S. enteritidis and P. tolaasii, and has a slight inhibitory effect on S. aureus (inhibition zone < 10 mm).43 LON has an obvious antibacterial effect on S. aureus, and has a certain inhibitory effect on P. tolaasii, slightly inhibits S. enteritidis, and has no inhibitory effect on E. coli. Although PO and LO have antibacterial activity, their surface tension is too large to dissolve in water-based medium, and their antibacterial effect are also poor. Therefore, their preparation into nanoemulsion is beneficial to their antibacterial effect.| E. coli (mm) | S. aureus (mm) | S. enteritidis (mm) | P. tolaasii (mm) | |
|---|---|---|---|---|
| PON | 14.33 ± 2.62 | 11.67 ± 1.25 | 14.33 ± 1.25 | 14.67 ± 0.94 |
| LON | 10.00 ± 0.82 | 14.33 ± 0.94 | 11.33 ± 2.05 | 12.67 ± 2.05 |
4. Conclusions
The direct addition of perilla oil or linseed oil to foods can have a negative effect on the performance of the food, and the perilla oil or linseed oil will be oxidized to reduce its bioavailability. This study examined whether PON and LON had good stability at pH ≥ 7, different storage temperature and NaCl concentrations. In addition, the stability of the nanoemulsion was also confirmed by detecting the content of MDA in the nanoemulsion. It is worth noting that regardless of how the environment changes, the emulsions do not appear turbid and stratified, and the particle size of the sample does not increase significantly. The cytotoxicity test and acute toxicity test proved that the PON and LON are nontoxic to J774 cells and in mice. The intestinal absorption test proved that the bioabsorbance of PON and LON is higher than that of PO and LO, respectively. The results of the antibacterial test proved that PON had obvious antibacterial effect on E. coli, S. enteritidis and P. tolaasii. In addition, LON had a significant antibacterial effect on S. aureus and P. tolaasii. The cytotoxicity test, acute toxicity test, intestinal absorption test and antibacterial test indicated that PON and LON possess good prospects in food and pharmaceuticals.Conflicts of interest
The authors declare no competing financial interest.Acknowledgements
This work was supported by the Key Program of Jilin Province [Grant no. 20180201044NY], and Jilin Educational Committee [Grant no. 3D518L714071].References
- L. Bumblauskiene, V. Jakstas, V. Janulis, R. Mazdzieriene and O. Ragazinskiene, Acta Pol. Pharm., 2009, 66, 409–413 Search PubMed
.
- N. Liu, Q. Chen, G. Li, Z. Zhu, J. Yi, C. Li, X. Chen and Y. Wang, Molecules, 2018, 23, 1533 CrossRef PubMed
.
- O. Chumphukam, K. Pintha, C. Khanaree, T. Chewonarin, W. Chaiwangyen, P. Tantipaiboonwong, M. Suttajit and O. Khantamat, J. Food Biochem., 2018, 42, e12556 CrossRef
.
- H. Kong, B. Zhou, X. Hu, X. Wang and M. Wang, J. Food Process. Preserv., 2018, 42, e13540 CrossRef
.
- Y. Lee, B. Song and J. Ju, Korean J. Food Sci. Technol., 2014, 46, 61–67 CrossRef
.
- A. Sonboli, A. Gholipour and M. Yousefzadi, Nat. Prod. Res., 2012, 26, 2121–2125 CAS
.
- Y. Gordeyeva and N. Shestakova, J. Ecol. Eng., 2018, 19, 102–105 CrossRef
.
- C. Herbig and U. Maier, Veg. Hist. Archaeobotany, 2011, 20, 527–533 CrossRef
.
- H. S. Naik, C. Srilatha, K. Sujatha, B. Sreedevi and T. N. V. K. V. Prasad, Vet. World, 2018, 11, 1433–1439 CrossRef PubMed
.
- C. Dwivedi, K. Natarajan and D. P. Matthees, Nutr. Cancer, 2005, 51, 52–58 CrossRef CAS PubMed
.
- L. Wang, J. M. Chen and L. U. Thompson, Int. J. Cancer, 2005, 116, 793–798 CrossRef CAS PubMed
.
- M. Dubey and C. P. Thakur, Atherosclerosis, 1979, 32, 81–86 CrossRef CAS PubMed
.
- S. H. Yoon and S. Noh, J. Am. Oil Chem. Soc., 2011, 88, 157–158 CrossRef CAS
.
- B. Bozan and F. Temelli, Bioresour. Technol., 2008, 99, 6354–6359 CrossRef CAS PubMed
.
- P. Li, A. Ghosh, R. F. Wagner, S. Krill, Y. M. Joshi and A. T. M. Serajuddin, Int. J. Pharm., 2005, 288, 27–34 CrossRef CAS PubMed
.
- J. Xi, Q. Chang, C. K. Chan, Z. Y. Meng, G. N. Wang, J. B. Sun, Y. T. Wang, H. H. Tong and Y. Zheng, AAPS PharmSciTech, 2009, 10, 172–182 CrossRef CAS PubMed
.
- Z. Mei, J. Xu and D. Sun, Colloids Surf., A, 2011, 375, 102–108 CrossRef CAS
.
- D. T. Utama, H. Jeong, J. Kim and S. K. Lee, Korean. J. Food Sci. Anim. Resour., 2018, 38, 580–592 Search PubMed
.
- J. Huang, Q. Wang, T. Li, N. Xia and Q. Xia, J. Sci. Food Agric., 2018, 98, 3513–3523 CrossRef CAS PubMed
.
- Y. Q. Su, W. Y. Tang, Y. Z. Song, C. L. Wang, Q. J. Tian, X. L. Wang, J. J. Quan, B. Q. Li, S. N. Wang and Y. H. Deng, Asian J. Pharm. Sci., 2017, 12, 28–36 CrossRef
.
- K. Kundu, A. Das, S. Bardhan, G. Chakraborty, D. Ghosh, B. Kar, S. K. Saha, S. Senapati, R. K. Mitra and B. K. Paul, Colloids Surf., A, 2016, 504, 331–342 CrossRef CAS
.
- T. Fouquet, H. Shimada, K. Maeno, K. Ito, Y. Ozeki, S. Kitagawa, H. Ohtani and H. Sato, J. Oleo Sci., 2017, 66, 1061–1072 CrossRef CAS PubMed
.
- C. von Corswant and P. E. G. Thoren, Langmuir, 1999, 15, 3710–3717 CrossRef CAS
.
- A. Ayala, M. F. Munoz and S. Arguelles, Oxid. Med. Cell. Longevity, 2014, 2014, 360438 Search PubMed
.
- Y. Zhou, J. Wang, Y. Guo, X. Liu, S. Liu, X. Niu, Y. Wang and X. Deng, J. Infect., 2019, 78(5), 364–372 CrossRef PubMed
.
- B. Yu, M. Zhang, J. Chen, L. Wang, X. Peng, X. Zhang, H. Wang, A. Wang, D. Zhao, D. Pang, H. OuYang and X. Tang, Life Sci., 2019, 227, 201–211 CrossRef CAS PubMed
.
- S. Obrowsky, P. G. Chandak, J. V. Patankar, S. Povoden, S. Schlager, E. E. Kershaw, J. G. Bogner-Strauss, G. Hoefler, S. Levak-Frank and D. Kratky, J. Lipid Res., 2013, 54, 425–435 CrossRef CAS PubMed
.
- B. Yu, X. Peng, L. Wang, A. Wang, Y. Su, J. Chen, X. Zhang, D. Zhao, H. Wang, D. Pang, H. Ouyang, X. Tang and M. Zhang, Int. J. Clin. Exp. Pathol., 2019, 12, 759–767 Search PubMed
.
- M. Vazirian, K. Hamidian, M. Noorollah, A. Manayi and N. Samadi, Res. J. Pharmacogn., 2019, 6, 1–10 Search PubMed
.
- R. F. Rodrigues, I. C. Costa, F. B. Almeida, R. A. S. Cruz, A. M. Ferreira, J. C. E. Vilhena, A. C. Florentino, J. C. T. Carvalho and C. P. Fernandes, Rev. Bras. Farmacogn., 2015, 25, 422–425 CrossRef CAS
.
- Y. Zhu, W. Xu, J. Zhang, Y. Liao, C. K. Firempong, M. Adu-Frimpong, W. Deng, H. Zhang, J. Yu and X. Xu, AAPS PharmSciTech, 2019, 20, 153 CrossRef PubMed
.
- I. Roland, Int. J. Pharm., 2003, 263, 85–94 CrossRef CAS PubMed
.
- A. Malhotra and J. N. Coupland, Food Hydrocolloids, 2004, 18, 101–108 CrossRef CAS
.
- Y. Shao and C.-H. Tang, Food Hydrocolloids, 2014, 37, 149–158 CrossRef CAS
.
- N. Mori Cortes, A. N. Califano and G. Lorenzo, Food Res. Int., 2019, 119, 283–290 CrossRef CAS PubMed
.
- Y. Zhang, J. Gao, H. Zheng, R. Zhang and Y. Han, Int. J. Nanomed., 2011, 6, 649–657 CrossRef CAS PubMed
.
- Y. Du, L.-J. Yin, Q.-H. Han, D. Zhao and H.-J. Liu, J. Food Process. Preserv., 2018, 42, e13568 CrossRef
.
- T. Tokle and D. J. McClements, Food Hydrocolloids, 2011, 25, 976–982 CrossRef CAS
.
- W. Gong, M. Li, Y. Zang, H. Xie, B. Liu and H. Chen, Plast., Rubber Compos., 2017, 46, 163–172 CrossRef CAS
.
- H. R. Sharif, P. A. Williams, M. K. Sharif, M. A. Khan, H. Majeed, W. Safdar, M. Shamoon, M. Shoaib, J. Haider and F. Zhong, Food Hydrocolloids, 2017, 66, 365–377 CrossRef CAS
.
- M. Zuk, D. Richter, J. Matula and J. Szopa, Ind. Crops Prod., 2015, 75, 165–177 CrossRef CAS
.
- G. G. Bovi, R. R. Petrus and S. C. Pinho, Int. J. Food Sci. Technol., 2017, 52, 2201–2209 CrossRef CAS
.
- J. B. Seibert, J. P. Bautista-Silva, T. R. Amparo, A. Petit, P. Pervier, J. C. Dos Santos Almeida, M. C. Azevedo, B. M. Silveira, G. C. Brandao, G. H. B. de Souza, L. F. de Medeiros Teixeira and O. D. H. Dos Santos, Food Chem., 2019, 287, 61–67 CrossRef CAS PubMed
.
Footnote |
| † Baoqing Han and Biao Yu have contributed equally to this work. |
| This journal is © The Royal Society of Chemistry 2019 |

