 Open Access Article
Three hierarchical porous magnesium borate microspheres: a serial preparation strategy, growth mechanism and excellent adsorption behavior for Congo red†
Rui-Feng Guo‡
,
Yan-Qing Ma‡ and
Zhi-Hong Liu *
*
Key Laboratory for Macromolecular Science of Shaanxi Province, School of Chemistry and Chemical Engineering, Shaanxi Normal University, Xi'an 710062, PR China. E-mail: liuzh@snnu.edu.cn; Tel: +86-29-81530805
First published on 26th June 2019
Abstract
The 3D hierarchical porous 7MgO·2B2O3·7H2O (MBH) microspheres were prepared by a phase transformation of chloropinnoite firstly, and anhydrous α-3MgO·B2O3 (MBA) microspheres were obtained by thermal conversion of 7MgO·2B2O3·7H2O, and then β-3MgO·B2O3 (MBB) microspheres were obtained by phase conversion of α-3MgO·B2O3. All samples were characterized by XRD, FT-IR, TG and SEM. The microsphere nanostructures with a hierarchical porous structure were assembled by nanosheets with a thickness of 20–30 nm, and the growth mechanisms were also proposed. By using N2 adsorption–desorption, the specific surface areas were measured as 103.62 m2 g−1 for MBH and 46.10 m2 g−1 for MBA. They exhibited excellent selective adsorption performance for Congo red (CR) with maximum adsorption capacities of 202.84 and 170.07 mg g−1 respectively, and the corresponding adsorption mechanisms were also investigated. The adsorption processes were well fitted with the pseudo-second-order rate equation and Langmuir adsorption model. In addition, the corresponding adsorption thermodynamic parameters were also calculated. It is necessary to highlight that the hierarchical porous microspheres could be considered as promising candidates for removal of CR dye pollutants.
Introduction
It is well-known that organic dyes, such as Congo red (CR), Methyl orange (MO), Methylene blue (MB), and Rhodamine B (RB) (Fig. S1†), are highly toxic, potentially carcinogenic and not easily biodegradable, which makes their presence in water bodies a serious threat to the environment, health and safety.1,2 Hence, the development of strategies that remove dyes from samples of aqueous solutions is of significant interest. Until now, several water treatment technologies have been implemented to remove dyes from wastewater, in which the chemical oxidation, photocatalytic degradation,2 membrane separation,3 and biodegradation4 methods are expensive, complex and easily generate secondary pollutants. Adsorption is the most commonly used method due to its advantages of high efficiency, low cost, no secondary pollution, and simple operation process.5,6 3D hierarchical porous materials with ultrahigh surface areas and large pore volumes have been extensively applied in water treatment.7,8Borate is a kind of important functional material because of its unique and rich structure. For example, magnesium borates might be as antiwear and antifriction additives,9 flame retardant,10 and nanowhiskers.11,12 Until now, there were several reports about the preparation of different magnesium borates with hierarchical nanostructures, such as flower-like Mg7B4O13·7H2O prepared via surfactant poly(vinyl pyrrolidone) (PVP) assisted precipitation process,13 MgBO2(OH) superstructures prepared by ionothermal synthesis method,14 and 2MgO·B2O3·H2O microsphere constructed by nanobelts array prepared by a template-free hydrothermal method.15 Among them, the adsorption performances for Congo red on MgBO2(OH) superstructures14 and 2MgO·B2O3·H2O microsphere15 have also been systematically investigated.
Further developing simple and template free methods for the preparation of hierarchical nanostructures with high surface area and excellent adsorption performance are still a challenging work. This paper first reports the preparation of hierarchical porous 7MgO·2B2O3·7H2O microspheres by a phase transformation of double salt chloropinnoite (2MgO·2B2O3·MgCl2·14H2O) which was crystallized out from high-boron-containing concentrated brine in Qinghai Salt Lake, China,16 and then well-preserved flower-like anhydrous α-3MgO·B2O3 microspheres with high crystallinity were obtained by a thermal conversion of 7MgO·2B2O3·7H2O microspheres. Both exhibit excellent adsorption performance for Congo red, which could be used as a promising adsorbent for CR from wastewater.
Experimental
Preparation of hierarchical flower-like 7MgO·2B2O3·7H2O microsphere by a phase transformation method
All used chemicals were of analytic reagent grade without further purification. Chloropinnoite was obtained according to the ref. 17.0.4 g of chloropinnoite was added into a 50 mL Teflon-lined stainless steel autoclave which contains 30 mL of deionized water. After the solution was magnetic stirred for 60 min at room temperature, the autoclave was sealed and placed into an oven at 100 °C for 24 h. After cooling to room temperature, the white precipitates obtained were separated by filtration and washed 3 times with distilled water and absolute ethanol respectively, and then dried at 60 °C for 6 h.
Preparation of hierarchical 3MgO·B2O3 nanostructure by a thermal conversion method
The above prepared MBH was placed in a crucible, which was calcined in a muffle furnace to 700 °C or 900 °C at a heating rate of 2 °C min−1 and continuously reaction for 3.5 h. After calcination, the obtained product for α-3MgO·B2O3 or β-3MgO·B2O3 was naturally cooled to room temperature and washed 3 times with distilled water and absolute ethanol, and dried at 60 °C for 6 h.Characterization of prepared samples
All samples were characterized by X-ray diffraction (XRD, Rigaku DMX-2550/PC, operating with Cu Kα radiation (λ = 1.5418 Å) at a scanning rate of 10° min−1 in a 2θ range from 5° to 70°), Fourier transform infrared (FT-IR) spectrum (measured on a Tensor27 infrared spectrometer (Bruker) using KBr disks), and thermal analysis (TG-DSC, performing on a TGA/DSC3+, METTLER thermal analyzer under a nitrogen atmosphere with a heating rate of 10 °C min−1 over the range from 30 to 800 °C). The morphologies of the samples were observed by field emission scanning electron microscopy (FSEM, SU-8020, Hitachi). The porosity and the Brunauer–Emmett–Teller (BET) specific surface area of samples were measured by the nitrogen adsorption/desorption at 77.3 K by using surface analytical instrument (America Micromeritics ASAP 2460. The sample had been degassed at 120 °C for 6.0 h under vacuum of 10−5 bar), and the pore size distribution was evaluated from the N2 desorption isotherm using the Barrett–Joyner–Halenda (BJH) model. The zeta potentials were measured with a dynamic light scattering instrument (Nano-ZSE, Malvern) at 90°.Adsorption experiments
Adsorption experiments were conducted at 25 °C. 5 mg of MBH or MBA sample was taken, and added to 20 mL of 20–200 mg L−1 CR aqueous solution. After magnetic stirring for different times, the liquid–solid phases were separated by using a centrifuge (12![[thin space (1/6-em)]](https://www.rsc.org/images/entities/char_2009.gif) 000 rpm). About 3 mL solution was taken and analyzed by UV-vis spectroscopy (UV-6100S double beam spectrophotometer, Mapada, China). Using a linear calibration curve over 2.5–25 mg L−1, the CR concentration was obtained by the peak of the absorbance band at the wavelength of 499 nm. Moreover, to study the kinetics of adsorption, the adsorption of CR solutions with initial concentration of 35 mg L−1 was monitored.
000 rpm). About 3 mL solution was taken and analyzed by UV-vis spectroscopy (UV-6100S double beam spectrophotometer, Mapada, China). Using a linear calibration curve over 2.5–25 mg L−1, the CR concentration was obtained by the peak of the absorbance band at the wavelength of 499 nm. Moreover, to study the kinetics of adsorption, the adsorption of CR solutions with initial concentration of 35 mg L−1 was monitored.
The adsorption capacity qt (mg g−1) at time t, the equilibrium adsorption capacity qe (mg g−1) and the removal efficiency Re of CR by MBH or MBA nanostructure were calculated using the following eqn (1)–(3):
 | (1) |
 | (2) |
 | (3) |
Results and discussion
Characterization of samples
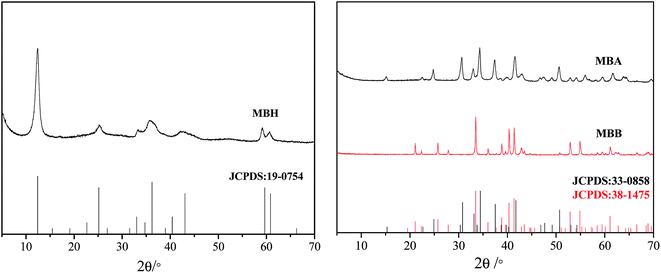
As shown in XRD patterns of the prepared samples (Fig. 1), all the diffraction peaks can be indexed as the JCPDS card no. 19-0754 for 7MgO·2B2O3·7H2O, JCPDS card no. 33-0858 for α-3MgO·B2O3, and JCPDS card no. 38-1475 for β-3MgO·B2O3.FT-IR spectrum of the MBH (Fig. S2†) exhibits the following absorption bands, which are assigned referring to the literature.18 3584 and 3444 cm−1 (stretching vibration of O–H), 1637 cm−1 (H–O–H bending). 1496 cm−1 (asymmetric stretching of B(3)–O), 1273 cm−1 (B–O–H in-plane bending mode), 1073 cm−1 and 974 cm−1 (asymmetric and symmetric stretching of B(4)–O respectively), 562 cm−1 (bending mode of B(4)–O). These IR assignments show its structure containing BO3, BO4 and B–O–H groups.
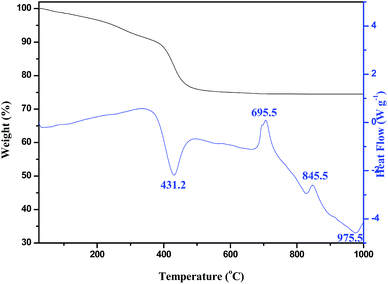
Fig. 2 gives the simultaneous TG-DSC curves. TG analysis indicates that there exists a weight loss of 23.68% from 100 °C to 600 °C, which correspond to the loss of 7 water molecules per molecule of 7MgO·2B2O3·7H2O, and basically consist with the calculated value of 23.01%. In the DSC curve, the endothermic peak at 419.1 °C corresponds to the loss of 7 water molecules and the further decomposition of 7MgO·2B2O3·7H2O. The exothermic peak at 695.5 °C with no related weight loss corresponds to the recrystallization of formed α-3MgO·B2O3. The exothermic peak at 845.5 °C corresponds to the phase transformation from α-3MgO·B2O3 into β-3MgO·B2O3. This result provides the prepared basis for calcining at 700 °C and 900 °C by thermal conversion method.
The SEM images of samples are shown in Fig. 3. Fig. 3a and b demonstrate that the precursor chloropinnoite exhibits belt shape with different lengths. Fig. 3c shows that the sample MBH exhibits flower-like microsphere with a diameter of ∼6 μm, which is assembled by the nanosheets with a thickness of about 20–30 nm as shown in Fig. 3d. Fig. 3e shows that the sample MBA exhibits a similar morphology to MBH, but the constituent unit of microsphere is nanosheet with many holes as seen in high magnification times for SEM (Fig. 3f). From Fig. 3g and h, it can be seen that the sample MBB exhibits a similar morphology to MBA.
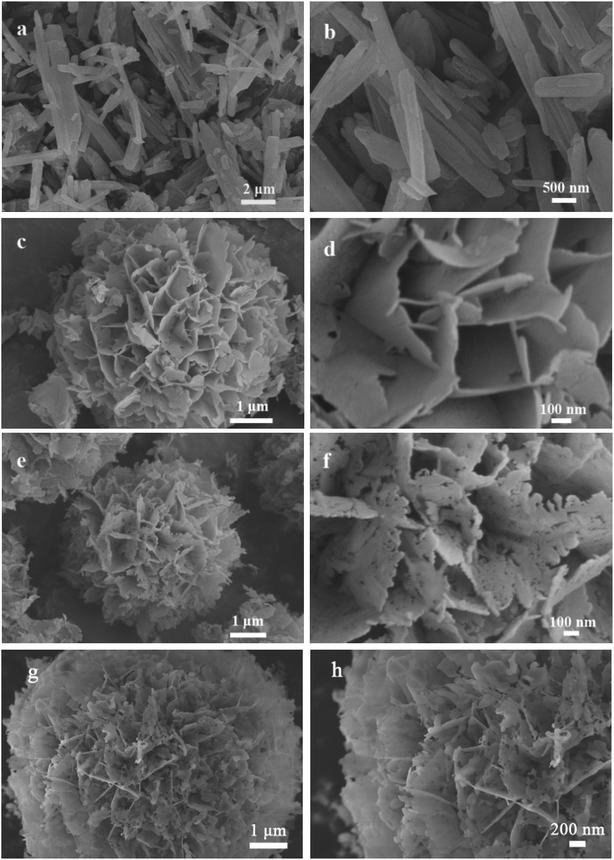 | ||
| Fig. 3 SEM images of samples: (a and b) chloropinnoite, (c and d) MBH, (e and f) MBA, (g and h) MBB. | ||
The specific surface areas and porous natures of MBH and MBA microspheres
Fig. 4 gives the nitrogen sorption isotherms of the as-prepared samples and their corresponding Barrett–Joyner–Halenda (BJH) pore size distribution. It can be seen from the curves that the adsorption isotherms exhibit type IV and the hysteresis loop of type H3, which indicate the existence of mesopores according to the definition of IUPAC.19 When the relative pressure (P/P0) is close to 1, hysteresis loops can be observed, which indicates the existence of macropores (>50 nm). The pore size distribution curves were obtained by using the Halsey equation and the branch calculation of nitrogen desorption isotherms by BJH method. It can be seen from inset of Fig. 4 that there exist a wide pore size distribution. The major peak for the MBH aperture distribution is in the 20.0–40.0 nm, and that for the MBA aperture distribution is in 40.0–60.0 nm, which indicates that there are more mesoporous pores in the MBH microspheres, and there are a few mesoporous and large pores in the MBA nanostructures. In the microsphere structure, the smaller pores might originate from the nanosheets, and the larger pores originate from the gap between the nanosheets of the hierarchical structure. The mesopores and macropores will make the as-obtained hierarchical microspheres with great potential applications.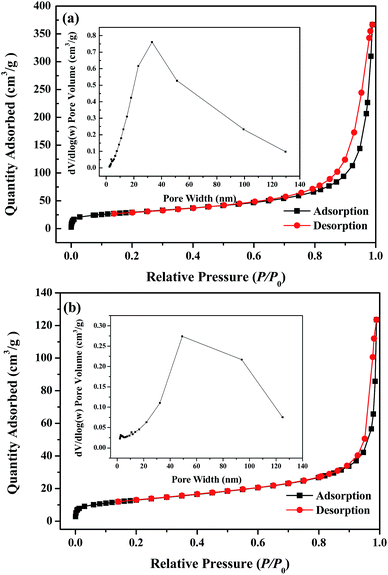 | ||
| Fig. 4 Nitrogen adsorption–desorption isotherms and corresponding pore diameter distribution profile (inset) of the as-obtained MBH (a) and MBA (b). | ||
It is well known that the specific surface area (BET) is one of the important indicators for measuring porous materials. The measured BET values of samples are 103.62 m2 g−1 for MBH and 46.10 m2 g−1 for MBA. The pore volumes of microspheres are 0.56 cm3 g−1 for MBH and 0.19 cm3 g−1 for MBA. The average pore sizes are 25.75 nm for MBH and 20.05 nm for MBA. For these parameters, MBA sample has smaller values, which might be resulted from some holes and gaps being blocked due to the calcination of MBH in the process of thermal conversion, although its flower-like shape is well preserved.
With larger BET, the MBH is expected to provide more active sites for adsorption, thus resulting in higher adsorption capacity. The above results confirm that the wider pore size distribution makes these two kinds of special porous microspheres adsorbent have better application prospects in wastewater treatment.
The influence of reaction times on the morphologies of MBH sample
In order to better understand the formation mechanism of the MBH microsphere, the influence of hydrothermal treatment times on the morphologies was investigated. The SEM images of as-prepared samples in different hydrothermal treatment times are shown in Fig. S3.† The time-dependent experimental result shows that nanosheets were formed at 6 h. As the reaction time was extended to 13 h, the rudiment for quarter flower-like sphere was formed. When the reaction time reached to 20 h, the incomplete hollow microspheres were formed. When the reaction time further prolong to 24 h, the complete porous microsphere nanostructures assembled from nanosheets were obtained.The formation mechanism for the flower-like MBH, MBA and MBB microspheres
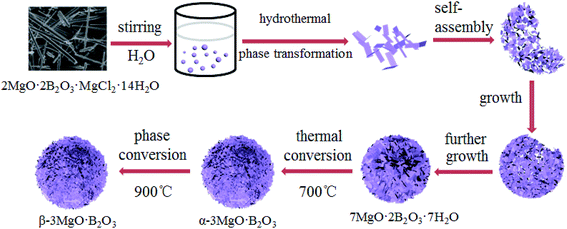
From the results of influence of different reaction times on the morphologies, the growth process for flower-like microsphere of MBH has been proposed as shown in Scheme 1.Source material of chloropinnoite was firstly dissolved in large amount of water, then this dilute solution was heated at 100 °C for 24 h under hydrothermal conditions, and MBH nanosheets was formed at 6 h by the phase transformation of chloropinnoite. Subsequently, due to the high surface energy of the MBH nanosheet, these nanosheets spontaneously self-assembled by overlapping mode to form the rudiment for quarter flower-like sphere at 13 h, and incomplete hollow microsphere at 20 h. Finally, as the reaction time prolonging, the complete flower-like microspheres for MBH were formed due to further growth. It needs to indicate that 7MgO·2B2O3·7H2O was the firstly obtained phase transformation product from chloropinnoite, through various magnesium borates of 2MgO·3B2O3·15H2O, MgO·B2O3·3H2O and 2MgO·B2O3·1–2H2O were obtained by this method.17
The high crystalline flower-like MBA microspheres construed by nanosheets with many holes were obtained by a thermal conversion of 7MgO·2B2O3·7H2O microspheres at 700 °C, then MBA was phase transformed into MBB at 900 °C. The keeping of microspheres and the existing holes in constituent unit for nanosheet should be related to the very slow heating rate of 2 °C min−1.
The effects of MBH and MBA microspheres on adsorption of different dyes and the corresponding adsorption mechanism
Generally, porous hierarchical nanostructures with high surface areas possess superior adsorption performance. To confirm the utility of two microspheres in water treatments, we used four different organic dyes, Congo red (CR), Methyl orange (MO), Methylene blue (MB), and Rhodamine B (RB), as molecular probes to explore the activity of the adsorbent. 5 mg of MBH or MBA sample was taken, and added to 10 mL of 20 mg L−1 organic dye aqueous solution. After adsorbing the different dyes for 3 h with the MBH and MBA adsorbents respectively, the UV-vis absorption spectra of the different organic dyes before and after being absorbed are shown in Fig. S4.† It can be seen that the absorbance has no significant changes in MO and RB, and the absorbance has a slight decrease in MB. But the absorbance has significant changes in CR, which shows that the samples MBH and MBA have a specific selectivity for the adsorption of CR. In addition, the adsorption of CR for sample MBB is slightly weaker than that of sample MBA, which might be resulted from the collapsing of part holes during phase conversion under higher temperature. So, the adsorption of CR for sample MBB was no necessary to investigate. In order to further illustrate specific selectivity for the adsorption of CR, the UV-vis adsorption of mixtures of a cationic dye for RB with CR by MBA was also tested. As shown in Fig. S4(e),† the CR characteristic peak disappear and RB characteristic peak keep no changing after adsorption.In order to determine the interaction between the adsorbent and CR molecules, zeta potential analysis was used to investigate the surface charge of the sample particles in aqueous solution.20 The results of zeta potential analysis are shown in Fig. S5.† As can be seen that the potential values of the two adsorbents in the solution are positive, while the potential value of the CR solution is negative, combined with the above adsorption performance, indicating that the interaction between the adsorbent and CR (the anionic dye molecules) may be electrostatic interaction.21 Hence, CR containing the negatively charged –SO3− group would be attracted to the positively charged surface of the MBH and MBA samples via electrostatic interaction. Though MO is also an anionic dye, its adsorption effect is poor. After comparing the two molecular structures (Fig. S1†), we find that the size of MO molecule is much smaller than that of CR molecule, which might lead to MO molecule penetrating the mesopores and macropores in the MBH microsphere easily. In addition, we also find that there are two –SO3− groups and two amino groups (–NH2) in the molecular structure of CR, while there is one –SO3− group and no –NH2 group in MO molecular structure. So, there not only exist more electrostatic interaction between CR and MBH/MBA samples, but also exist more hydrogen bonds N–H⋯O and O–H⋯N between CR and MBH/MBA samples that contains the hydroxyl group (–OH) on the surface of nanosheet. But both electrostatic interaction and hydrogen bond between MO and MBH/MBA samples are weaker. Both MB and RB are cationic dyes, and the zeta potentials of MBH and MBA samples are both positive, which is not conducive to the adsorption. In addition, the steric hindrance of RB is larger, which is also less favorable for adsorption. Herein, the prepared hierarchical porous flower-like MBH and MBA nanostructures would be used to removal of CR in solution in detail.
Adsorption kinetics
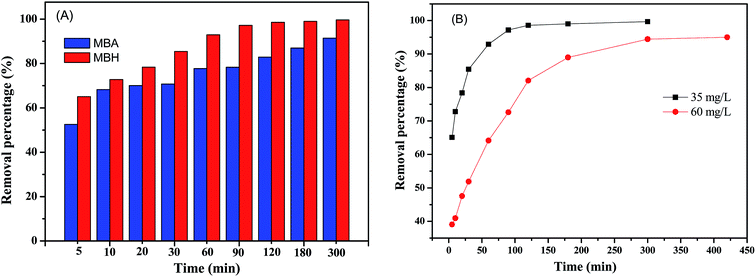
Adsorption kinetics is essential for adsorption research because this process can estimate the adsorption rate and illuminate the mechanism between pollutants and adsorbents. In order to compare the adsorption performance of samples MBH and MBA, we examined the removal efficiency (Re) of MBH and MBA on CR solutions at different time intervals. Fig. 5(A) shows the Re for 20 mL of 35 mg L−1 of CR solution after being treated by 10 mg of prepared MBH or MBA nanostructures at different time intervals. It can be seen that the adsorption rates were faster due to the rapid increase in removal efficiency values. Obviously, the Re of sample MBH is higher than that of sample MBA. At the time of adsorption of 60 min, the Re of MBH to CR is about 93%, while the Re of MBA to CR is only 78% under the same conditions. After MBH adsorbed for 120 min, Re was as high as 98.6%. After MBA adsorbed for 300 min, Re was 91.4%. It is obvious that the MBH sample has the better adsorption efficiency, which can be attributed to the fact that the MBH has a larger specific surface area and its unique pore structure, resulting in more active sites. About the decreased adsorption efficiency of MBA, it might be resulted from lower BET value and some unique microstructures being destroyed when calcination of MBH to be prepared MBA.As a comparison, keeping others conditions unchanged, the effect of contact time on CR removal efficiency by the prepared MBH nanostructure for different initial CR concentrations of 35 mg L−1 and 60 mg L−1 was also investigated. As showed in Fig. 5(B), the lower the CR concentration, the shorter the time to reach equilibrium, and the higher of the dye removal rate.
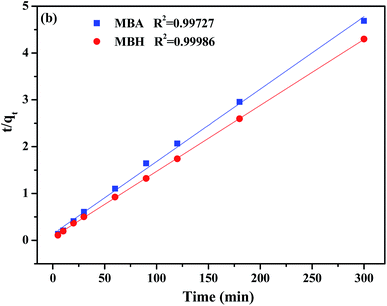
To further fully comprehend the inner laws and characteristics of the adsorption process, the pseudo-first-order kinetic models (eqn (4)) and pseudo-second-order kinetic models (eqn (5)) were applied to study the adsorption mechanism.15,22 The linear equations are expressed respectively as follows:
 | (4) |
 | (5) |
| Samples | qe,exp (mg g−1) | qe,cal (mg g−1) | k2 (×10−3 g mg−1 min−1) | R22 |
|---|---|---|---|---|
| MBH | 69.78 | 70.92 | 14.1 | 0.9973 |
| MBA | 64.01 | 64.60 | 1.80 | 0.9999 |
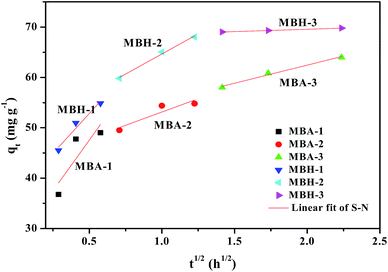
In order to elucidate the internal adsorption mechanism during the adsorption process and to investigate whether the intra particle diffusion in the adsorption process is a rate-limiting factor, we have further studied the adsorption kinetics data using the internal diffusion model. The empirical intra particle diffusion model is common to most adsorption processes,24 which is expressed as eqn (6):
 | (6) |
Adsorption isotherms
Adsorption isotherms play a crucial role in predicting the mechanism of interaction between CR molecules and adsorbent surface active sites. The following Langmuir and Freundlich isotherm models are representative mathematical models that have been widely applied to study the adsorption mechanisms.25 The Langmuir model (7) is proposed on an ideal homogeneous monolayer adsorption that the active sites on the adsorbent surface are equivalent and no interaction exists between the adsorbed contaminants, while the Freundlich model (8) is used for multilayer adsorption on heterogeneous surfaces.23
 | (7) |
 | (8) |
The adsorption isotherms at different initial CR concentrations (20–200 mg L−1) are shown in Fig. 8 and S7.† The parameters equilibrium constant KL (L mg−1) and Langmuir maximum adsorption capacity qm (mg g−1) can be calculated by the intercept and slope from the linear plot of Ce/qe versus Ce (Fig. 8). In the same manner, the parameters KF (roughly an indicator of the adsorption capacity) and n (adsorption intensity) can be confirmed through linear Freundlich isotherm model (Fig. S7†). Table 2 gives the values of related parameters and the correlation coefficients. Compared with the Freundlich model, the Langmuir model with the larger R2 is more compatible with the experimental data, which indicates that the adsorption of adsorbent MBH or MBA may originate from the active sites uniformly distributed on the surface, and the adsorption is a monolayer adsorption for CR. From Table 2, it can be found that 0 < KL <1, indicating that the adsorption process was preferential adsorption.26
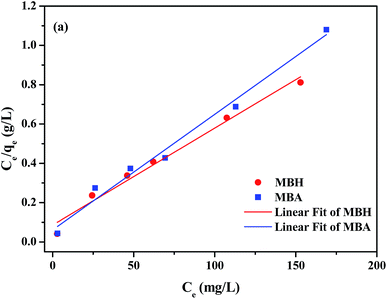 | ||
| Fig. 8 Plot of Ce/qe versus Ce for the CR adsorption by the MBH and MBA nanostructures fitting with the Langmuir isotherm adsorption model. | ||
| Adsorbent | Langmuir isotherm model | Freundlich isotherm model | ||||
|---|---|---|---|---|---|---|
| qm (mg g−1) | KL (L mg−1) | R2 | KF | n | R2 | |
| MBH | 202.84 | 0.0573 | 0.9793 | 50.26 | 3.86 | 0.9714 |
| MBA | 170.07 | 0.0957 | 0.9817 | 51.27 | 4.25 | 0.8857 |
The gained maximum adsorption capacities (qm) of MBH and MBA were 202.84 and 170.07 mg g−1 respectively, which were much higher than most reported adsorbent materials as listed in Table 3. It can be predicted that the obtained MBH and MBA flower-like microsphere samples might be used as excellent and highly efficient adsorbent materials to remove and immobilize anionic organic contaminants from polluted wastewater.
| Adsorbents | qm (mg g−1) | References |
|---|---|---|
| a All the maximum adsorption capacities were obtained by fitting the equilibrium adsorption data for a series of different concentrations in the Langmuir model. | ||
| Montmorillonite (MMT) | 12.7 | 27 |
| Hierarchical urchin-like α-Fe2O3 nanostructures | 66 | 28 |
| γ-Al2O3/Ni0.5Zn0.5Fe2O4 microfibers | 75.5 | 29 |
| Hierarchical Ni(OH)2 nanosheets | 82.9 | 30 |
| α-Fe2O3 hollow structures | 93.55 | 31 |
| Ca-bentonite | 107.41 | 32 |
| Dual-porosity Mn2O3 cubes | 125.6 | 33 |
| Hierarchical NiO nanosheets | 151.7 | 30 |
| Hollow nest-like α-Fe2O3 spheres | 160 | 34 |
| Hierarchical porous flower-like MBA microspheres | 170.07 | This work |
| Hierarchical porous MBO microspheres | 183.15 | 15 |
| Hierarchical porous flower-like MBH microspheres | 202.84 | This work |
| Hierarchical γ-AlOOH | 214.59 | 35 |
| MgBO2(OH) superstructures | 228.3 | 14 |
| γ-Al2O3 microspheres | 416.05 | 35 |
| Functionalized carbon nanotube/mixed metal oxides | 1250 | 36 |
| Monodispersed hierarchical flower-like nickel(II) oxide | 534.8 | 37 |
| Hierarchically porous SiO2/C hollow microspheres | 2512 | 38 |
Aiming at a realistic application, it would be important to understand the amounts of CR adsorbed by the prepared samples using tap and river water samples to prepare the CR solutions. As shown in following Fig. S8(A),† the removal percentage of CR for MBH sample was still very high compared with CR solutions prepared by using deionized water. It is also found that the CR solutions prepared by using river water has been adsorbed more quickly, as shown in Fig. S8(B)† for the UV-vis absorption spectra of CR solutions after being treated by the MBH nanostructures for 30 min. This more quick removal rate might be related with the micro-biological degradation in tap and river water samples.
Adsorption thermodynamics
In order to inspect the effects of temperature on adsorption and further study the adsorption mechanism, we also carried out the investigation of adsorption thermodynamics. The Gibbs free energy change ΔG0 related with the adsorption process can be obtained by equilibrium constant Kd through the classical Van't Hoff equations (eqn (9) and (10)).
ΔG0 = −RT![[thin space (1/6-em)]](https://www.rsc.org/images/entities/char_2009.gif) ln ln![[thin space (1/6-em)]](https://www.rsc.org/images/entities/char_2009.gif) Kd Kd
| (9) |
 | (10) |
 | (11) |
The entropy change (ΔS0) and enthalpy change (ΔH0) can be obtained through intercept and slope of ln![[thin space (1/6-em)]](https://www.rsc.org/images/entities/char_2009.gif) Kd versus 1/T, as shown in Fig. S9.† The Gibbs free energy (ΔG0) at the corresponding temperature can be calculated according eqn (9). The above thermodynamic parameters are all listed in Table 4.
Kd versus 1/T, as shown in Fig. S9.† The Gibbs free energy (ΔG0) at the corresponding temperature can be calculated according eqn (9). The above thermodynamic parameters are all listed in Table 4.
| Adsorbent | T (K) | ΔG0 (kJ mol−1) | ΔH0 (kJ mol−1) | ΔS0 (kJ mol−1 K−1) |
|---|---|---|---|---|
| MBH | 293 | −7.912 | 110.2 | 0.4027 |
| 298 | −9.613 | |||
| 303 | −11.95 | |||
| MBA | 293 | −5.510 | 80.92 | 0.2947 |
| 298 | −6.724 | |||
| 303 | −8.462 |
The value of ΔG0 is negative, indicating that the adsorption of CR by sample MBH or MBA is a spontaneous process, and the increase of temperature is favorable for the adsorption. The positive value of ΔH0 reveals that the adsorption is endothermic reaction, which indicates that the adsorption process is chemical adsorption.39 The positive value of ΔS0 indicates the randomness is increased during the adsorption of CR on MBH and MBA microspheres.
Conclusions
In summary, highly uniform nanosheets constructed 7MgO·2B2O3·7H2O (MBH) and 3MgO·B2O3 (MBA and MBB) microspheres with hierarchical porous architecture had been successfully fabricated via a mild phase transformation and thermal conversion method, respectively. This continuous preparation strategy is simple and green, and the corresponding growth mechanisms were also proposed. Moreover, MBH and MBA microspheres had a specific selectivity for the adsorption of CR, with the maximum adsorption capacities of 202.84 mg g−1 and 170.07 mg g−1, respectively. The excellent adsorption performances of MBH and MBA for CR were attributed to the synergistic effect of the more surface positive charge, larger specific surface area and more active sites. The adsorptions of CR on the two prepared adsorbents were fitted with the pseudo-second-order kinetics model, and satisfied well with the Langmuir model. Meanwhile, the result for the investigation of adsorptive thermodynamics showed that the adsorption process was a spontaneous and endothermic process. It can be predicated that both hierarchical porous microsphere samples could be as promising candidates for immobilized CR dye pollutant from wastewater because of their economics, excellent adsorption capacity and environmentally friendly.Conflicts of interest
There are no conflicts to declare.Acknowledgements
This project is supported by the National Natural Science Foundation of China (No. 21573142).References
- R. M. Yu, Y. Z. Shi, D. Z. Yang, Y. X. Liu, J. Qu and Z. Z. Yu, ACS Appl. Mater. Interfaces, 2017, 9, 21809–21819 CrossRef CAS PubMed.
- F. Chen, A. S. Gong, M. Zhu, G. Chen, S. D. Lacey, F. Jiang, Y. Li, Y. Wang, J. Dai, Y. Yao, J. Song, B. Liu, K. Fu, S. Das and L. Hu, ACS Nano, 2017, 11, 4275–4282 CrossRef CAS PubMed.
- Y. Q. Zheng, B. C. Zhu, H. Chen, W. You, C. J. Jiang and J. G. Yu, J. Colloid Interface Sci., 2017, 504, 688–696 CrossRef CAS PubMed.
- S. Vahidhabanu, A. A. Idowu, D. Karuppasamy, B. R. Babu and M. Vineetha, ACS Sustainable Chem. Eng., 2017, 5, 10361–10370 CrossRef CAS.
- L. S. Zhong, J. S. Hu, H. P. Liang, A. M. Cao, W. G. Song and L. J. Wan, Adv. Mater., 2006, 18, 2426–2431 CrossRef CAS.
- M. A. Mudassir, S. Z. Hussain, A. Rehman, W. Zaheer, S. T. Asma, A. Jilani, M. Aslam, H. Zhang, T. M. Ansari and I. Hussain, ACS Appl. Mater. Interfaces, 2017, 9, 24190–24197 CrossRef CAS PubMed.
- C. J. Pei, G. P. Han, Y. Zhao, H. Zhao, B. Liu, L. J. Cheng, H. Q. Yang and S. Z. Liu, J. Hazard. Mater., 2016, 318, 732–741 CrossRef CAS PubMed.
- Y. Q. Zhang, X. B. Yang, Z. X. Wang, J. Long and L. Shao, J. Mater. Chem. A, 2017, 5, 7316–7325 RSC.
- Y. Zeng, H. B. Yang, W. Y. Fu, L. Qiao, L. X. Chang, J. J. Chen, H. Y. Zhu, M. H. Li and G. T. Zou, Mater. Res. Bull., 2008, 43, 2239–2247 CrossRef CAS.
- L. Zhang and Z. H. Liu, J. Therm. Anal. Calorim., 2017, 129, 715–719 CrossRef CAS.
- W. Zhu, R. Wang, S. Zhu, L. Zhang, X. Cui, H. Zhang, X. Piao and Q. Zhang, ACS Sustainable Chem. Eng., 2014, 2, 836–845 CrossRef CAS.
- W. C. Zhu, S. L. Zhu and L. Xiang, CrystEngComm, 2009, 11, 1910–1919 RSC.
- A. M. Chen, J. Li, P. Gu and J. Hu, Powder Technol., 2014, 267, 54–60 CrossRef CAS.
- Z. Q. Zhang, W. C. Zhu, R. G. Wang, L. L. Zhang, L. Zhu and Q. Zhang, J. Mater. Chem. A, 2014, 2, 19167–19179 RSC.
- Y. Q. Ma and Z. H. Liu, J. Taiwan Inst. Chem. Eng., 2018, 86, 92–100 CrossRef CAS.
- S. Y. Gao, Z. G. Chen and J. N. Feng, Chin. J. Inorg. Chem., 1986, 1–2, 40–52 Search PubMed.
- W. Li, S. Y. Gao, S. P. Xia, V. M. Valyashko and M. A. Urusova, Thermochim. Acta, 1998, 308, 183–188 CrossRef.
- J. Li, S. P. Xia and S. Y. Gao, Spectrochim. Acta. A., 1995, 51, 519–532 CrossRef.
- J. B. Condon, Surface area and porosity determinations by physisorption: measurements and theory, Elsevier, Amsterdam, 2006 Search PubMed.
- D. Maiti, S. Mukhopadhyay and P. S. Devi, ACS Sustainable Chem. Eng., 2017, 5, 11255–11267 CrossRef CAS.
- R. Yu, Y. Shi, D. Yang, Y. Liu, J. Qu and Z. Z. Yu, ACS Appl. Mater. Interfaces, 2017, 9, 21809–21819 CrossRef CAS PubMed.
- J. L. Marco-Brown, L. Guz, M. S. Olivelli, B. Schampera, R. M. Torres Sánchez, G. Curutchet and R. Candal, Chem. Eng. J., 2018, 333, 495–504 CrossRef CAS.
- H. Qian, Y. L. Lin, B. Xu, L. P. Wang, Z. C. Gao and N. Y. Gao, Chem. Eng. J., 2018, 349, 849–859 CrossRef CAS.
- J. S. Wu, J. S. Wang, H. Y. Li, Y. C. Du, K. L. Huang and B. X. Liu, J. Mater. Chem. A, 2013, 1, 9837–9847 RSC.
- A. Afkhami and R. Moosavi, J. Hazard. Mater., 2010, 174, 398–403 CrossRef CAS PubMed.
- Z. Huang, Y. Li, W. Chen, J. Shi, N. Zhang, X. Wang, Z. Li, L. Gao and Y. Zhang, Mater. Chem. Phys., 2017, 202, 266–276 CrossRef CAS.
- L. Wang and A. Q. Wang, J. Hazard. Mater., 2007, 147, 979–985 CrossRef CAS PubMed.
- J. Fei, Y. Cui, J. Zhao, L. Gao, Y. Yang and J. Li, J. Mater. Chem., 2011, 21, 11742–11746 RSC.
- X. C. Yang, Z. Wang, M. X. Jing, R. J. Liu, L. Jin and X. Q. Shen, Water, Air, Soil Pollut., 2014, 225, 1819–1830 CrossRef.
- B. Cheng, Y. Le, W. Q. Cai and J. G. Yu, J. Hazard. Mater., 2011, 185, 889–897 CrossRef CAS PubMed.
- J. Wu, J. Wang, H. Li, Y. Du, K. Huang and B. Liu, J. Mater. Chem. A, 2013, 1, 9837–9847 RSC.
- L. L. Lian, L. P. Guo and C. J. Guo, J. Hazard. Mater., 2009, 161, 126–131 CrossRef CAS PubMed.
- Y. J. Shao, B. Ren, H. M. Jiang, B. J. Zhou, L. P. Lv, J. Z. Ren, L. C. Dong, J. Li and Z. F. Liu, J. Hazard. Mater., 2017, 333, 222–231 CrossRef CAS PubMed.
- Z. H. Wei, R. E. Xing, X. Zhang, S. Liu, H. H. Yu and P. C. Li, ACS Appl. Mater. Interfaces, 2012, 5, 598–604 CrossRef PubMed.
- Z. F. Li, Y. Du, S. Y. Zhang, Z. T. Chen, K. Yang, X. J. Lv and C. F. Zhua, RSC Adv., 2016, 6, 89699–89707 RSC.
- S. X. Yang, L. Y. Wang, X. D. Zhang, W. J. Yang and G. L. Song, Chem. Eng. J., 2015, 275, 315–321 CrossRef CAS.
- Y. Q. Zheng, B. C. Zhu, H. Chen, W. You, C. J. Jiang and J. G. Yu, J. Colloid Interface Sci., 2017, 504, 688–696 CrossRef CAS PubMed.
- J. Wang, L. Y. Xiao, S. A. Wen, N. Chen, Z. Y. Dai, J. Y. Deng, L. H. Nie and J. Min, RSC Adv., 2018, 8, 19852–19860 RSC.
- S. H. Kim and P. P. Choi, Dalton Trans., 2017, 46, 15470–15479 RSC.
Footnotes |
| † Electronic supplementary information (ESI) available. See DOI: 10.1039/c9ra03654g |
| ‡ Both authors contributed equally to this work and should be considered co-first authors. |
| This journal is © The Royal Society of Chemistry 2019 |

