 Open Access Article
Structure and photocatalytic performance of rice husk-like Ba-doped GaOOH under light irradiation
Panqi Huang and
Jingfei Luan*
State Key Laboratory of Pollution Control and Resource Reuse, School of the Environment, Nanjing University, Nanjing 210093, China. E-mail: jfluan@nju.edu.cn
First published on 26th June 2019
Abstract
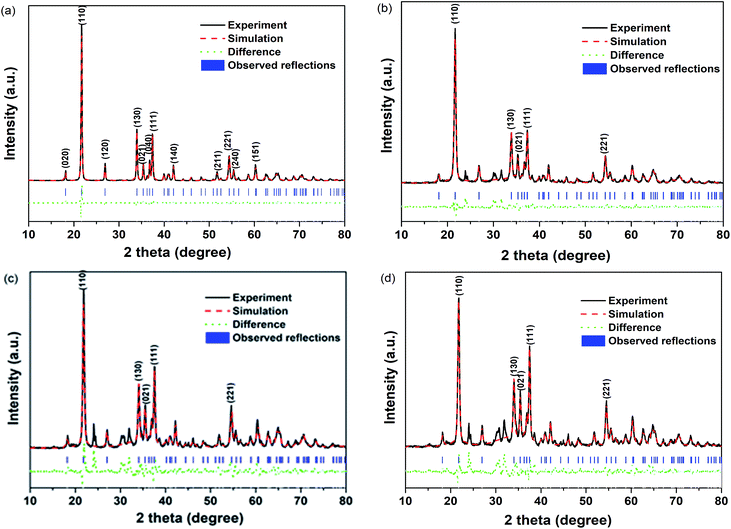
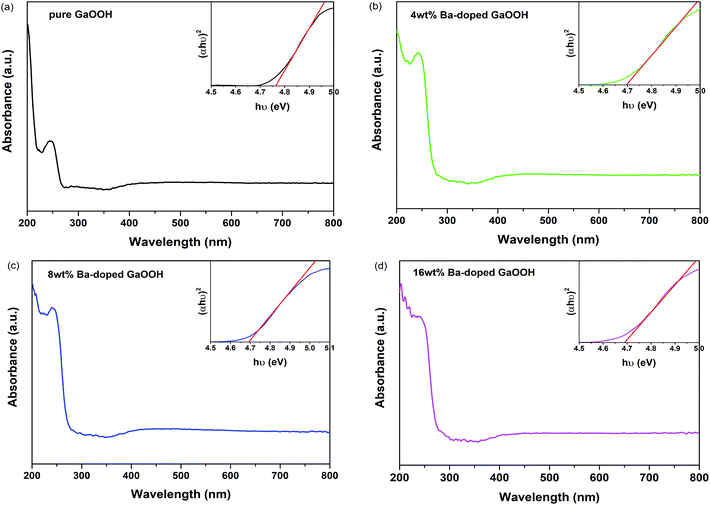
The effects of Ba-doping on the structure and photocatalytic performance of GaOOH were investigated for the first time in this paper. XRD, SEM, TEM, XPS, UPS, FT-IR, UV-Vis DRS, PL, BET and EPR characterizations were carried out to analyze the properties of Ba-doped GaOOH. The results showed that GaOOH crystallized well with the orthorhombic crystal system with space group Pbnm. The lattice parameters of GaOOH were found to be a = 4.509526 Å, b = 9.771034 Å and c = 2.969284 Å. The transition in the structural morphology of GaOOH before and after Ba-doping was observed in SEM pictures in which the morphology of GaOOH varied from wood-like to rice husk-like. At the same time, the specific surface area of 4 wt% Ba-doped GaOOH (21.5854 m2 g−1) was 3.42 times that of pure GaOOH (6.3047 m2 g−1). Ba-doping caused a red shift of the band gap according to UV-Vis DRS results. The enhanced defect states caused by Ba-doping was confirmed by PL results, which decreased the recombination rate of photogenerated electrons and photogenerated holes. Compared with pure GaOOH, when GaOOH with different Ba content was used as photocatalyst, the removal rate of enrofloxacin was increased by more than 20% only by illumination for 60 min. In addition, Ba-doped GaOOH had excellent stability and could be reused, which could reduce costs and increase the potential of its practical application.
Introduction
GaOOH (gallium oxyhydroxide), a wide band gap (4.75 eV) semiconductor material, has been extensively prepared and is often used as a photocatalyst and as a precursor for the preparation of various gallium-containing compounds, such as Ga2O3, GaN and ZnGa2O4.1–10 Many ways have been found to prepare GaOOH with different morphologies and properties.11–15 A hydrothermal method with ionic liquid aide was found to prepare α-GaOOH with layered structure by D. Li et al.16 Wedge-like α-GaOOH particles were prepared by F. Shiba et al.17 through the hydrolysis process, using sodium acetate as a growth regulator. Electrochemical oxidation of gallium based liquid metals was used to prepare GaOOH in the study of B. Lertanantawong et al.18 Using oxalic acid to form various forms of α-GaOOH at different temperatures during hydrothermal processes was studied by M. Muruganandham et al.19 Y. H. Hsu et al. prepared Au-modified GaOOH nanorods to improve performance of methanol fuel cells under light irradiation.20Metal ion doping technology has been regarded as one of the effective ways to construct surface defects of semiconductor materials and improve the surface characteristics.21–26 According to the A. Firdous's report,27 after Ba doping, the absorption edge of ZnS moved towards the blue region and the optical band gap of ZnS reduced, enhancing potential applications for ZnS. It was also observed in G. Srinet's report28 that band gap redshifted and defect states was enhanced for ZnO after Ba-doping. Meanwhile, before and after Ba-doping, the nanostructure morphology of ZnO changed. There were few reports on metal ion doping of GaOOH, mainly focusing on the lanthanide metal ion, such as Dy(3+),29 Eu(3+)30,31 and Ln(3+),32–36 and both are applied as fluorescent materials and precursors. The doping of GaOOH with a main group metal ion and its direct use as a photocatalyst have not been reported. Therefore, this paper reports the Ba-doped GaOOH for the first time. In this paper, XRD (X-ray diffraction), SEM (scanning electron microscopy), TEM (transmission electron microscopy), XPS (X-ray photoelectron spectroscopy), UPS (ultraviolet photoelectron spectroscopy), FT-IR (Fourier transform infrared spectroscopy), UV-Vis DRS (UV-Vis diffuse reflectance spectroscopy), BET (Brunauer–Emmett–Teller method), PL (fluorescence spectroscopy) and EPR (electron paramagnetic resonance spectroscopy) were utilized to analyze the structural properties of pure GaOOH and Ba-doped GaOOH prepared by us. In addition, the removal rate of enrofloxacin under illumination with pure GaOOH or Ba-doped GaOOH as a photocatalyst was measured.
Experimental
Preparation of pure GaOOH and Ba-doped GaOOH
In this paper, solvothermal method was selected to prepare pure GaOOH and Ba-doped GaOOH. Specific steps to prepare Ba-doped GaOOH were as follows: (I) 1.1296 g Ga2O3 (purity of 99.99%, Aladdin Biochemical Technology Co., Ltd., Shanghai, China) was accurately weighed and placed in a 250 mL beaker and then 80 mL of deionized water and 80 mL of absolute ethanol were added. (II) According to the requirement of different doping amount, Ba (NO3)2 (purity of 99.9%, Sinopharm Group Chemical Reagent Co., Ltd., Shanghai, China) was added accurately to above beaker. The doping amount (the mass ratio of Ba element to GaOOH) was set to 4%, 8%, 16%, respectively. (III) 1 mol L−1 sodium hydroxide solution was added dropwise to adjust the pH to 13. (IV) After stirring at room temperature for 30 min, the above solution was transferred from the beaker to a 200 mL tetrafluoro-lined reactor and heated at 200 °C for 12 h. (V) After the completion of the heating, it was cooled to room temperature, washed several times with water and absolute ethanol, and then dried at 60 °C for 12 h, and finally grinded into powders. The resulting products were marked as 4 wt% Ba-doped GaOOH, 8 wt% Ba-doped GaOOH and 16 wt% Ba-doped GaOOH, respectively. Pure GaOOH was prepared as a control sample according to the above steps with no Ba (NO3)2 added.Characterization of pure GaOOH and Ba-doped GaOOH
Some scientific methods were selected to analyze pure GaOOH and Ba-doped GaOOH catalysts prepared above. Powder X-ray diffractometer (XRD, D/MAX-RB, Rigaku Corporation, Japan) was selected to analyze the crystal form of pure GaOOH and Ba-doped GaOOH. The instrument adopted CuKα radiation (λ = 1.54056) and collected data using step-scan program at 295 K. Scan range was set to 15–45°. Time per step and step interval was 1.2 second and 0.04°. Scanning electron microscope (SEM, LEO 1530VP, LEO Corporation, Dresden, Germany) was selected to analyze the morphological features of pure GaOOH and Ba-doped GaOOH. Transmission electron microscopy (TEM, Tecnai F20 S-Twin, FEI Corporation, Hillsboro, OR, USA) was selected to analyze the morphology and selected diffraction spot of pure GaOOH and Ba-doped GaOOH. X-ray photoelectron spectroscopy (XPS, ESCALABMK-2, VG Scientific Ltd., London, UK) was selected to analyze the Ga3+ content, Ba2+ content and O2− content of Ba-doped GaOOH. Fourier transform infrared spectrometer (Nexus, Nicolet Corporation, Madison, WI, USA) with an attenuated total reflectance (ATR) mode was selected to analyze the main chemical vibrational species of pure GaOOH and Ba-doped GaOOH. Full-function fluorescence spectrometer (Fluoromax-4, Horiba Scientific) was selected to analyze the photoluminescence properties of pure GaOOH and Ba-doped GaOOH. UV-Vis spectrophotometer (UV-2450, Shimadzu Corporation, Kyoto, Japan) was selected to measure UV-visible diffuse reflectance spectra of pure GaOOH and Ba-doped GaOOH catalysts and blank background material was BaSO4. Brunauer–Emmett–Teller (BET) method (ASAP 2020 V3.00 H, USA) with N2 adsorption at liquid nitrogen temperature was selected to measure the specific surface areas of pure GaOOH and Ba-doped GaOOH. Electron paramagnetic resonance spectrometer (EPR, EMX-10/12, Bruker, German) was selected to analyze hydroxyl radical (·OH) and superoxide radical (·O2−).Photocatalytic performance of pure GaOOH and Ba-doped GaOOH
The photocatalytic performance of pure GaOOH and Ba-doped GaOOH catalysts was analyzed by degrading enrofloxacin, an antibiotic that was difficult to biodegrade and its accumulation was very harmful to the human body. A photocatalytic reactor (Xujiang Machine, Nanjing, China) was selected to carry out photocatalytic reactions. The photocatalytic reactor included a mercury lamp (500 W), optical filters and a magnetic stirring device. The major emission wavelength of the mercury lamp we used in this paper was 365 nm and the spectral distribution and relative energy of the mercury lamp was shown in Table 1. In addition, the optical filters could filter out light with a wavelength greater than 400 nm, which meant that only ultraviolet light with a wavelength of less than 400 nm could pass through the optical filters to irradiate the reaction tubes containing the contaminant solution and the catalyst sample. The parameters of photocatalytic experiment were as follows: the initial concentration of enrofloxacin was set to be 10 mg L−1, the catalyst dosage was set to be 1 g L−1 and the time of ultraviolet light irradiation was set to be 120 min. In the experiment process, 0.05 g catalyst was weighed and added to a test tube containing 50 mL of enrofloxacin solution. The above tube was placed in the photocatalytic reactor and magnetically stirred for half an hour under dark conditions for dark adsorption. Then ultraviolet light irradiation was carried out. 2 mL of the solution was taken under ultraviolet light for 10 min, 20 min, 30 min, 40 min, and 60 min, and the absorbance of enrofloxacin was measured at 276 nm using the UV-visible spectrophotometer (UV-2550, Shimadzu Corporation, Kyoto, Japan).| Wavelength (nm) | 265.2–265.5 | 296.7 | 302.2–302.8 | 312.6–313.2 | 365.0–366.3 | 404.5–407.8 | 435.8 | 546.1 | 577.0–579.0 |
| Relative energy (%) | 15.3 | 16.6 | 23.9 | 49.9 | 100.0 | 42.2 | 77.5 | 93.0 | 76.5 |
The absorbency standard curve of enrofloxacin was obtained by measuring the absorbance of enrofloxacin at a concentration of 2 mg L−1, 4 mg L−1, 6 mg L−1, 8 mg L−1, 10 mg L−1 and 12 mg L−1, respectively. Then the linear relationship between the concentration of enrofloxacin and the absorbance was obtained by linear simulation. The removal rate of enrofloxacin (D%) was calculated by the following equation: D% = (C0 − Ct)/C0 × 100%, where C0 was the initial concentration of enrofloxacin and Ct was the concentration of enrofloxacin at time t.
Results and discussion
Characterization
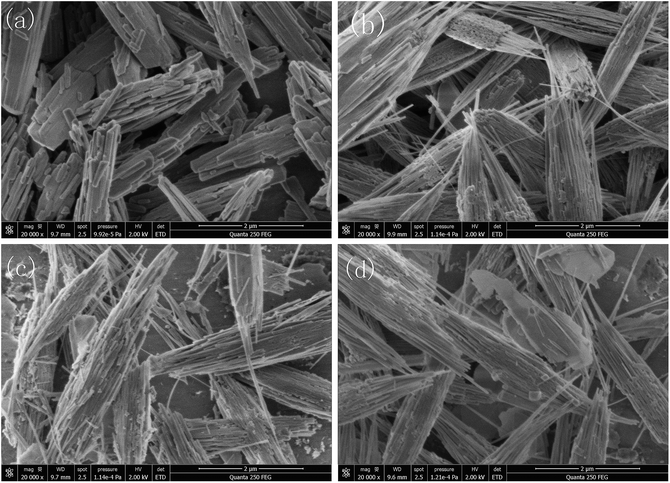 | ||
| Fig. 2 SEM photographs of: (a) pure GaOOH; (b) 4 wt% Ba-doped GaOOH; (c) 8 wt% Ba-doped GaOOH; (d) 16 wt% Ba-doped GaOOH. | ||
In addition, the specific surface areas of pure GaOOH and Ba-doped GaOOH were measured by using BET method. The BET results showed that the specific surface areas of pure GaOOH, 4 wt% Ba-doped GaOOH, 8 wt% Ba-doped GaOOH and 16 wt% Ba-doped GaOOH were 6.3047 m2 g−1, 21.5854 m2 g−1, 18.7497 m2 g−1 and 18.1918 m2 g−1, respectively. It was obvious that the Ba-doping significantly increased the specific surface area of GaOOH and the specific surface area of 4 wt% Ba-doped GaOOH was 3.42 times that of pure GaOOH. Compared with 4 wt% Ba-doped GaOOH, the specific surface area of 8 wt% Ba-doped GaOOH or 16 wt% Ba-doped GaOOH slightly decreased, which might result from the fracture of the fiber structures at both ends of GaOOH, as shown in Fig. 2.
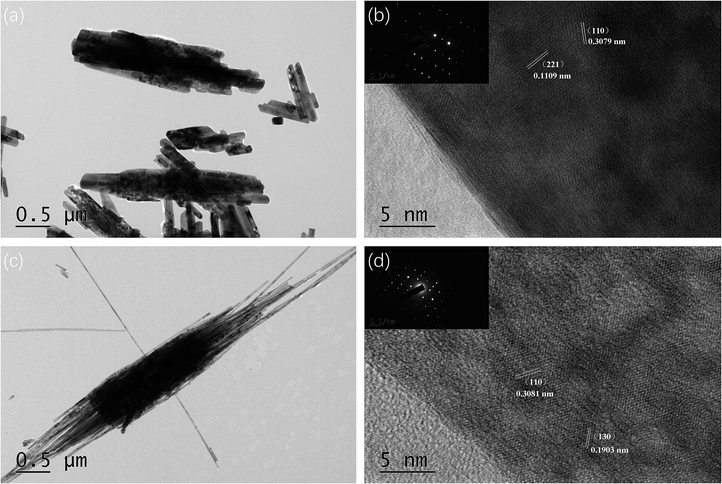
Fig. 3 shows the TEM information of pure GaOOH and 4 wt% Ba-doped GaOOH which included the high resolution TEM pictures, the SAED patterns and the HRTEM images with clear lattice fringe spacing. Regarding the morphology of the prepared samples, the TEM results were agree with the SEM pictures (Fig. 2). The fibrous structures at both ends of the 4 wt% Ba-doped GaOOH were observed clearly (Fig. 3(c)) and the diameter of the fiber rods was approximately 25 nm. Fig. 3(b and d) shows that the prepared pure GaOOH and 4 wt% Ba-doped GaOOH both had very good single crystal structure. Moreover, as shown in Fig. 3(b and d), (110) lattice plane of pure GaOOH and 4 wt% Ba-doped GaOOH was observed, which was also detected in the XRD patterns (Fig. 1).
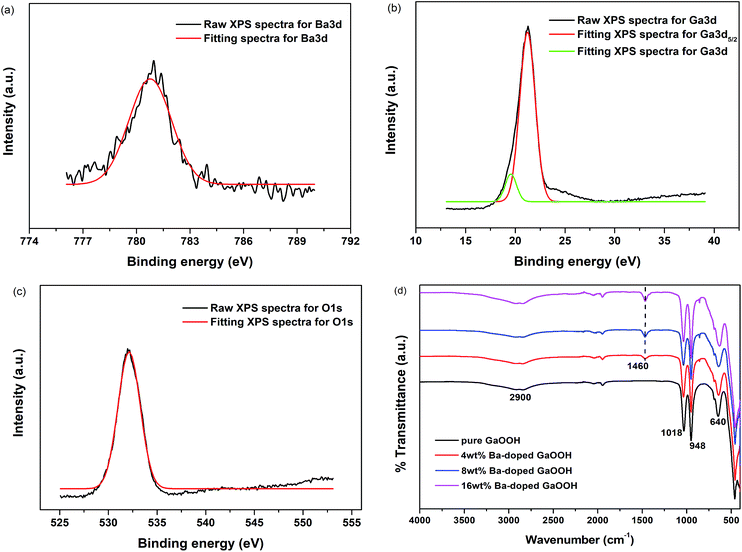 | ||
| Fig. 4 XPS spectra of 4 wt% Ba-doped GaOOH ((a) Ba3d; (b) Ga3d; (c) O1s) and (d) FT-IR spectra of pure GaOOH and GaOOH with different Ba-doping amount. | ||
Fig. 4(d) shows the FT-IR spectra of pure GaOOH and GaOOH with different Ba-doping amount prepared by us. Compared to pure GaOOH, after Ba-doping, new peak appeared at and 1460 cm−1 and the peak intensity increased as the amount of Ba-doping increased, which should thus characterize the barium phase.40 In addition, both pure GaOOH and Ba-doped GaOOH had broad peaks at 2900 cm−1 and sharp peaks at 1018 cm−1 and 948 cm−1. Among them, the peak at 2900 cm−1 was attributed to the vibration of O–H in GaOOH,29 and the peaks at 948 cm−1 and 1018 cm−1 were attributed to the constitutional Ga–OH bending mode and its overtones, respectively.29,41 The relative strength and position of the two bands (948 cm−1 and 1018 cm−1) were related to the shape of the GaOOH.42 Pure GaOOH also showed peaks at 640 cm, while the position of the peak shifted slightly to the lower wavenumber after Ba-doping, as shown in Fig. 4(d), because Ba-doping changed the appearance of GaOOH (Fig. 2). The phenomenon that lattice vibration band was affected by the appearance of the sample was also observed on FeOOH.43,44
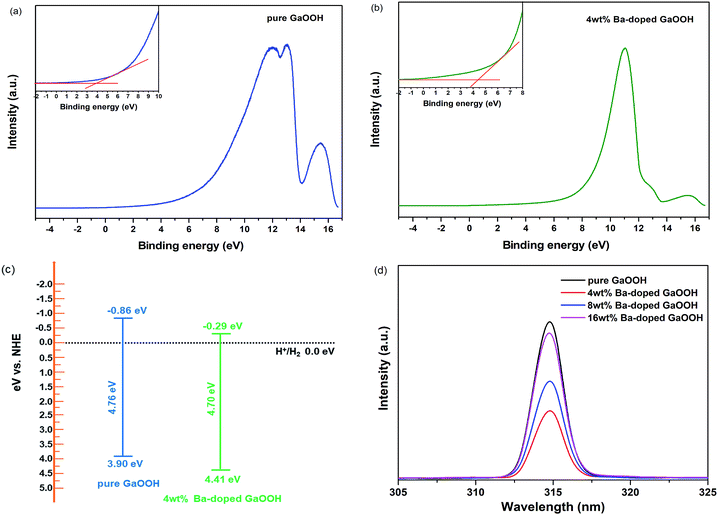
Fig. 6(d) shows the PL spectra of pure GaOOH and GaOOH with different Ba-doping amount prepared by us. As shown in Fig. 6(d), all samples showed a single emission peak at 315 nm. The PL emissions of samples might result from the recombination of the defect-related excitations through an excitation – excitation collision process.49 After the samples were excited, electron–hole pairs were generated, wherein the holes were on the valence band or the defect-related position, and the electrons were on the conduction band or the defect-related position, and the two emitted photons during the recombination process, thereby the luminescence spectrums were generated as shown in Fig. 6(d). At an excitation wavelength of 280 nm, electron–hole pair generation was only attributed to defect-conduction band because the excitation energy of 280 nm light (4.43 eV) was lower than the band gaps of all samples prepared by us.50 Thus, it was concluded that Ba-doping caused defects on GaOOH surface. As shown in Fig. 6(d), Ba-doping caused the decrease of emission peak intensity. When the amount of Ba-doping was 4 wt%, the intensity of emission peak was lowest, meaning that the recombination rate of electrons and holes was lowest, which provided a great possibility for the application of GaOOH in the field of photodegradation pollutants and hydrogen production.
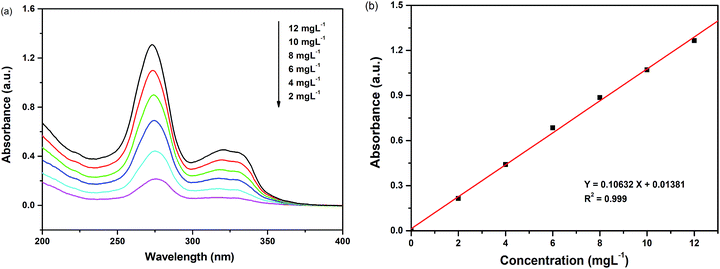 | ||
| Fig. 7 (a) UV-Vis absorption spectra of different concentrations of enrofloxacin; (b) absorbency standard curve of enrofloxacin. | ||
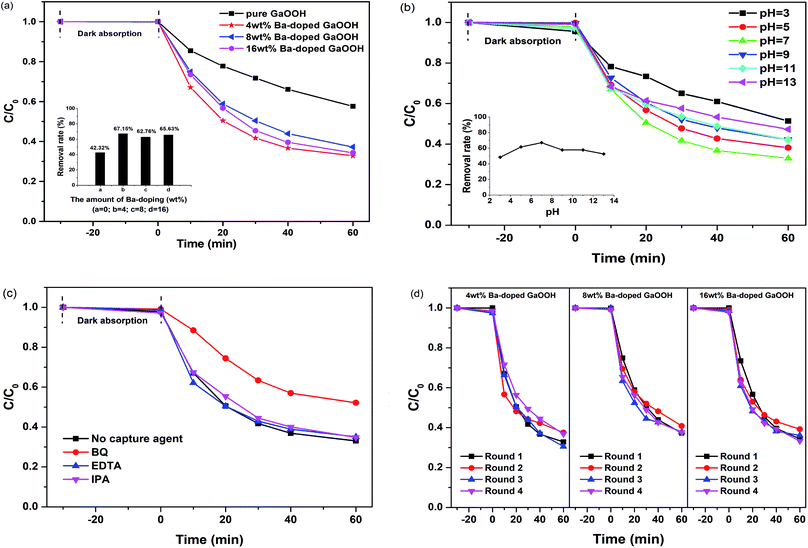
Fig. 8(a) shows the photocatalytic removal efficiency of enrofloxacin under UV light for 60 min with pure GaOOH and 4 wt%, 8 wt% and 16 wt% Ba-doped GaOOH as a photocatalyst, respectively. The results showed that the photocatalytic performance of GaOOH was significantly enhanced after Ba-doping. The removal rate of enrofloxacin by Ba-doped GaOOH was more than 20% higher than that of pure GaOOH. One of the reasons for the enhancement of the photocatalytic performance of Ba-doped GaOOH was the increase in specific surface area after Ba doping, according to the BET results.
Fig. 8(b) shows the photocatalytic removal efficiency of enrofloxacin at different initial pH using 4 wt% Ba-doped GaOOH as a photocatalyst. The results showed that the optimal initial pH for photocatalytic degradation of enrofloxacin by 4 wt% Ba-doped GaOOH was 7. In addition, when the initial pH was 5, 7, 9, and 11, the photocatalytic degradation efficiency of 4 wt% Ba-doped GaOOH on enrofloxacin did not change significantly, indicating that 4 wt% Ba-doped GaOOH photocatalyst had strong acid–base adaptability.
Fig. 8(c) shows the photocatalytic removal efficiency of enrofloxacin with the addition of different capture agents using 4 wt% Ba-doped GaOOH as a photocatalyst. In this experiment, BQ (benzoquinone), EDTA (ethylenediaminetetraacetic acid) and IPA (isopropanol) acted as a capture agent for ·O2−, h+ and ·OH, respectively. The addition amount of BQ, EDTA or IPA was set to be 1 mL and the concentration of BQ, EDTA or IPA was set to be 0.15 mmol L−1. From Fig. 8(c), it was clearly that the addition of EDTA and IPA almost did not affect the photocatalytic degradation of enrofloxacin by 4 wt% Ba-doped GaOOH, but the addition of BQ significantly inhibited the photocatalytic degradation of enrofloxacin. Thus, it was concluded that in the process of photocatalytic degrading enrofloxacin, above active species could be ranked to increase photodegradation rate: h+ < ·OH < ·O2−. In addition, the possible active radicals in the process of photocatalytic degrading enrofloxacin were measured by EPR characterization. Here, the 5,5-dimethyl-1-pyrroline N-oxide (DMPO) was used to spin traps the active radicals in the system for detection. As shown in Fig. 9, no EPR signals relevant to DMPO adducts were observed for 4 wt% Ba-doped GaOOH, when it was in darkness. However, after illumination, signals were observed in Fig. 9(a) and (b), corresponding with the DMPO/·OH adduct and DMPO/·O2− adduct, respectively.
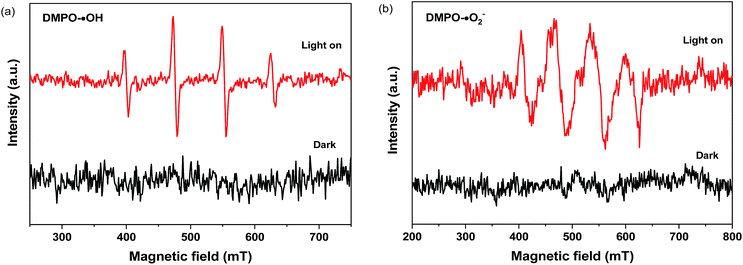 | ||
| Fig. 9 DMPO spin-trapping EPR spectra of 4 wt% Ba-doped GaOOH in aqueous dispersion for DMPO–·OH (a) and in methanol dispersion for DMPO–·O2− (b). | ||
Fig. 8(d) shows the cyclic photocatalytic degradation of enrofloxacin using 4 wt%, 8 wt% and 16 wt% Ba-doped GaOOH as a photocatalyst, respectively. The results showed that in each of the four rounds of photocatalytic degradation experiments, the removal rates of enrofloxacin were basically the same, indicating that 4 wt%, 8 wt% and 16 wt% Ba-doped GaOOH had excellent stability and could be used repeatedly, which was beneficial to reduce the cost of catalyst in practical applications.
Conclusions
Ba-doped GaOOH prepared by solvothermal method was reported for the first time in this paper. According to XRD results, pure GaOOH and Ba-doped GaOOH were successfully prepared with the orthorhombic crystal system by space group Pbnm and the lattice parameters of GaOOH were a = 4.509526 Å, b = 9.771034 Å and c = 2.969284 Å. The morphology of GaOOH transformed from wood-like to rice husk-like structure after Ba-doping, which had many fibrous independent structures at both ends. It was obvious in BET results that the Ba-doping significantly increased the specific surface area of GaOOH and the specific surface area of 4 wt% Ba-doped GaOOH was 3.42 times that of pure GaOOH. UV-Vis DRS results revealed that Ba-doping decreased the band gap of GaOOH. In FT-IR results, the vibration peak caused by Ba doping was observed, indicating the successful doping of Ba. Moreover, Ba-doping caused defects on GaOOH surface, which decreased the combination rate of electrons and holes and enhanced the photocatalytic performance of GaOOH. The removal rates of enrofloxacin were 67.15%, 62.76%, 65.63% with 4 wt%, 8 wt% and 16 wt% Ba-doped GaOOH as a photocatalyst, respectively, higher than that of pure GaOOH (42.32%). Finally, it was found that Ba-doped GaOOH had good acid–base adaptability and good recyclability, which helps to reduce the cost in practical applications and greatly improves the practical application potential of GaOOH.Conflicts of interest
There are no conflicts to declare.Acknowledgements
This work was supported by the National Natural Science Foundation of China (No. 20877040). This work was supported by a grant from the Technological Supporting Foundation of Jiangsu Province (No. BE2009144). This work was supported by a grant from the Natural Science Foundation of Jiangsu Province (No. BK2007717, BK2006130). This work was supported by a grant from China-Israel Joint Research Program in Water Technology and Renewable Energy (No. 5).References
- M. Sun, D. Li, W. Zhang, X. Fu, Y. Shao, W. Li, G. Xiao and Y. He, Nanotechnology, 2010, 21, 355601 CrossRef PubMed.
- H. S. Qian, P. Gunawan, Y. X. Zhang, G. F. Lin, J. W. Zheng and R. Xu, Cryst. Growth Des., 2008, 8, 1282 CrossRef CAS.
- C. C. Huang and C. S. Yeh, New J. Chem., 2010, 34, 103 RSC.
- S. Yan, L. Wan, Z. Li, Y. Zhou and Z. Zhou, Chem. Commun., 2010, 46, 6388 RSC.
- L. H. Shi, J. Zhang, S. Wu, Y. A. Li, L. N. Jiang and Q. L. Cui, J. Am. Ceram. Soc., 2014, 97, 2607–2614 CrossRef CAS.
- H. K. Lee, M. S. Kim and J. S. Yu, IEEE Photonics Technol. Lett., 2012, 24, 285–287 CAS.
- B. Zhan, Q. Cui, W. Liu and J. Zhang, Chin. J. Chem., 2009, 27, 2175–2177 CrossRef CAS.
- S. Yan, J. Wang, H. Gao and N. Y. Wang, Adv. Funct. Mater., 2013, 23, 758–763 CrossRef CAS.
- W. S. Jung and B. K. Min, Mater. Lett., 2004, 58, 3058–3062 CrossRef CAS.
- S. Ge, L. Zhang, H. M. Jia and Z. Zheng, J. Mater. Res., 2009, 24, 2268–2275 CrossRef CAS.
- A. C. Tas, P. J. Majewski and F. J. Aldinger, J. Am. Ceram. Soc., 2002, 85, 1421 CrossRef CAS.
- M. Muruganandham, R. Suri, M. S. M. Abdel Wahed, M. Sillanpá, B. Ahmmad, G. J. Lee and J. J. Wu, Mater. Lett., 2013, 111, 137 CrossRef CAS.
- A. C. Tas, P. J. Majewski and F. Aldinger, J. Am. Chem. Soc., 2002, 85, 1421–1429 CAS.
- I. Lee, J. Kwak, S. Haam and S. Lee, J. Cryst. Growth, 2010, 312, 2107–2112 CrossRef CAS.
- S. G. Chen, S. M. Luo, Y. Zhou, Y. Chen, Y. Q. Liu and C. G. Long, Mater. Lett., 2008, 62, 4566–4569 CrossRef CAS.
- D. Li, X. C. Duan, Q. Qin, H. M. Fan and W. J. Zheng, J. Mater. Chem. A, 2013, 1, 12417 RSC.
- F. Shiba, M. Yuasab and Y. Okawa, CrystEngComm, 2018, 20, 4910 RSC.
- B. Lertanantawong, J. D. Riches and A. P. O'Mullane, Langmuir, 2018, 34, 7604–7611 CrossRef CAS PubMed.
- M. Muruganandham, R. Amutha, M. S. M. Abdel Wahed, B. Ahmmad, T. Ohkubo, R. P. S. Suri, J. J. Wu and M. Sillanpää, J. Phys. Chem. C, 2012, 116, 44–53 CrossRef CAS.
- Y. H. Hsu, A. T. Nguyen, Y. H. Chiu, J. M. Li and Y. J. Hsu, Appl. Catal., B, 2016, 185, 133–140 CrossRef CAS.
- P. Bouras, E. Stathatos and P. Lianos, Appl. Catal., B, 2007, 73, 51–59 CrossRef CAS.
- X. C. Meng and Z. S. Zhang, Appl. Surf. Sci., 2017, 392, 169–180 CrossRef CAS.
- F. Bensouici, M. Bououdina, A. A. Dakhel, R. Tala-Ighil, M. Tounane, A. Iratni, T. Souier, S. Liu and W. Cai, Appl. Surf. Sci., 2017, 395, 110–116 CrossRef CAS.
- A. Tabib, W. Bouslama, B. Sieber, A. Addad, H. Elhouichet, M. Fárid and R. Boukherrou, Appl. Surf. Sci., 2017, 396, 1528–1538 CrossRef CAS.
- S. S. Xue, H. B. He, Q. Z. Fan, C. L. Yu, K. Yang, W. Y. Huang, Y. Zhou and Y. Xie, J. Environ. Sci., 2017, 60, 70–77 CrossRef PubMed.
- C. Li, Z. Yan and Z. Yuan, Funct. Mater. Lett., 2018, 11, 1750082 CrossRef CAS.
- A. Firdous, M. A. Baba, D. Singh and A. H. Bhat, Appl. Nanosci., 2015, 5, 201–206 CrossRef CAS.
- G. Srinet, R. Kumar and V. Sajal, Mater. Lett., 2014, 126, 274–277 CrossRef CAS.
- G. G. Li, C. Peng, C. X. Li, P. P. Yang, Z. Y. Hou, Y. Fan, Z. Y. Cheng and J. Lin, Inorg. Chem., 2010, 49, 1449–1457 CrossRef CAS PubMed.
- S. Basu, B. S. Naidu, M. Pandey, V. Sudarsan, S. N. Jha, D. Bhattacharyya, R. K. Vatsa and R. J. Kshirsagar, Chem. Phys. Lett., 2012, 528, 21–25 CrossRef CAS.
- B. S. Naidu, M. Pandey, J. Nuwad, V. Sudarsan, R. K. Vatsa, R. J. Kshirsagar and C. G. S. Pillai, Inorg. Chem., 2011, 50, 4463–4472 CrossRef PubMed.
- L. Binet, D. Gourier and C. Minot, J. Solid State Chem., 1994, 113, 420–433 CrossRef CAS.
- N. Ueda, H. Hosono, R. Waseda and H. Kawazoe, Phys. Lett., 1997, 71, 933–935 CAS.
- T. Miyata, T. Nakatani and T. Minami, Thin Solid Films, 2000, 373, 145–149 CrossRef CAS.
- E. G. Villora, T. Atou, T. Sekiguchi and T. Sugawara, Solid State Commun., 2001, 120, 455–458 CrossRef CAS.
- M. Ogita, K. Higo, Y. Nakanishi and Y. Hatanaka, Appl. Surf. Sci., 2001, 721, 175–176 Search PubMed.
- J. F. Luan and P. Q. Huang, Materials, 2018, 11, 491 CrossRef PubMed.
- A. C. Taş, P. J. Majewski and F. Aldinger, J. Am. Ceram. Soc., 2002, 85, 1414–1420 CrossRef.
- R. Elilarassi and G. Chandrasekaran, Mater. Chem. Phys., 2010, 123, 450–455 CrossRef CAS.
- S. P. D. Valle, O. Marie and H. P. Nguyen, Appl. Catal., B, 2018, 223, 116–124 CrossRef.
- X. H. Liu, G. Z. Qiu, Y. Zhao, N. Zhang and R. Yi, J. Alloys Compd., 2007, 439, 275–278 CrossRef CAS.
- S. Krehula, M. Ristić, S. Kubuki, Y. Iida, M. Fabián and S. Musić, J. Alloys Compd., 2015, 620, 217–227 CrossRef CAS.
- S. Krehula, S. Popović and S. Musić, Mater. Lett., 2002, 54, 108–113 CrossRef CAS.
- S. Krehula and S. Musić, J. Cryst. Growth, 2008, 310, 513–520 CrossRef CAS.
- S. M. Hong, C. K. Rhee and Y. Sohn, J. Alloys Compd., 2019, 774, 11–17 CrossRef CAS.
- J. Tauc, R. Grigorov and A. Vancu, Phys. Status Solidi, 1966, 15, 627–637 CrossRef CAS.
- M. A. Butler, J. Appl. Phys., 1977, 48, 1914–1920 CrossRef CAS.
- J. F. Luan, Y. Shen, S. Wang and N. B. Guo, Polymers, 2017, 9, 69 CrossRef PubMed.
- S. Wu, J. Zhang, L. Shi, S. Tang, Y. Li, L. Jiang and Q. Cui, RSC Adv., 2014, 4, 8209–8215 RSC.
- X. Xu, K. Bi, K. Huang, C. Liang, S. Lin, W. J. Wang, T. Z. Yang, J. Liu, D. Y. Fan, H. J. Yang, Y. G. Wang and M. Lei, J. Alloys Compd., 2015, 644, 485–490 CrossRef CAS.
| This journal is © The Royal Society of Chemistry 2019 |

