DOI:
10.1039/C9RA03814K
(Paper)
RSC Adv., 2019,
9, 34214-34226
A study on the local corrosion behavior and mechanism of electroless Ni–P coatings under flow by using a wire beam electrode
Received
21st May 2019
, Accepted 7th October 2019
First published on 23rd October 2019
Abstract
The local corrosion behavior and mechanism of Ni–P coatings in a 3.5 wt% sodium chloride solution with different flow speeds (0 m s−1, 0.5 m s−1, 1 m s−1) were investigated through a wire beam electrode (WBE) with morphological, elemental and electrochemical analyses as well as numerical simulations. It was found that the microstructure of the Ni–P coating was in the shape of broccoli and possessed satisfactory compactness and uniformity. The numerical simulations showed that the speed increased and the static pressure decreased at the local area. Combined with WBE, it was found that the average corrosion potential decreased at that area. The results indicated that the corrosion tendency and corrosion rate of the Ni–P coating were larger at higher speeds, and the corrosion resistance could be improved by the electroless Ni–P coating. WBE was helpful in revealing the local electrochemical information of the Ni–P coating.
1. Introduction
An electroless Ni–P coating plays an important role in modern industry and is widely applied in the oil and gas field industries, marine engineering, and chemical industry because of its good resistance to corrosion, excellent uniform coating ability and low electrical resistivity.1–4 However, the structural parts with the Ni–P coating corrode seriously due to the flow.5,6 At present, many research studies have been published on the corrosion resistance of the Ni–P coatings. Wang et al.7 found that the erosion rate of the substrate was higher than that of the electroless Ni–P coating. Anijdan et al.8 showed that the wear resistance of the coatings improved with an increase in the particle size. Wang et al.9 determined that the coating exhibited higher corrosion resistance via laser re-melting and annealing. In addition, the results by Shoghi et al.10 showed that the corrosion resistance of a magnesium alloy greatly improved after coating Ni–P. However, the localized corrosion mechanism study of electroless Ni–P layers at low flow rates is still lacking, and the development of new methods is still a major field of research.
To date, WBE, which is also named as a multi-electrode array, has been used for the research of the localized corrosion mechanism for years.11–14 The remarkable features of WBE involve testing the potential and current of the whole electrode with an array of orderly wires. Using the WBE method, Zhang et al.15 showed that the atmospheric corrosion of the Q235 steel presented the characteristic of local corrosion, which developed to become uniform corrosion afterwards by WBE. Xu et al.16 found that the flow accelerated corrosion, and erosion-corrosion can evolve and propagate freely on the electrode array surface by simulating and monitoring it. In addition, numerical simulation techniques have been used to study local corrosion behaviors increasingly with the development of the computer technology.17,18 When studying the carbon dioxide corrosion of the X80 pipeline steel using WBE and numerical simulations, Zhang et al.19 showed that the total anodic current density decreased slightly and then became stabilized ultimately as the water film thickness was increased. However, there are very limited reports regarding the influence of the flow on the local corrosion behavior of electroless Ni–P coatings by employing the WBE method and numerical simulations.
The present work aimed to study the local corrosion behavior and mechanism of a substrate and an Ni–P coating under a flow based on the WBE method and numerical simulations. Meanwhile, the top of WBE was electrolessly plated with Ni–P, and its corrosion behavior under flow was studied. The results of the study will provide a novel insight into the localized corrosion behavior and mechanism of Ni–P coatings.
2. Materials, experiment, and numerical simulation
2.1 Electroless Ni–P coating
To deposit the coating, the WBE (10 × 10) samples, which were made from the Q235 steel, and the blocky Q235 steel were used as the sub-layers. First, the substrate was ground to 1500 grit by sandpapers and polished by corundum powder with a diameter of 1 mm and then cleaned with purified water and dried in a drying oven. Second, the substrate was placed in a solution of 10 wt% hydrogen chloride until bubbles appeared and then, we cleaned it again with purified water. The substrate was then immersed into the Ni–P electroless bath with rpm of 200 for 2 h and the temperature was maintained at 85 °C at the same time. Table 1 provides the composition and condition of the bath used for the production of the coating.
Table 1 Compositions of the electroless bath to produce the Ni–P coating
| The components of the bath |
Amount |
| Nickel sulfide (g l−1) |
12.5 |
| Sodium hypophosphite (g l−1) |
5.5 |
| Sodium acetate (g l−1) |
8 |
| Citric acid (g l−1) |
2 |
| Sodium dodecyl sulfate (g l−1) |
0.4 |
| Thiocarbamide (mg) |
0.5 |
2.2 Experimental setup
Fig. 1 shows the schematic experimental setup used to obtain the corrosion potential and galvanic currents flowing over a sample WBE surface immersed in 3.5 wt% sodium chloride solutions at various speeds. Three different speeds (0 m s−1, 0.5 m s−1, 1 m s−1) and two kinds of samples (substrate and Ni–P coating) were studied. These selected speeds were the linear speed at the midpoint of the top surface of the cylindrical container radius and the speeds were calculated by calibration. One hundred wires with the same size in WBE were made from the Q235 steel. The wires were insulated from each other and the diameter of each wire was 1.5 mm. The wire spacing was 2 mm. Only the heads of the wires were exposed, and the other areas were sealed with epoxy resin. The exposed average area of each wire was approximately 1.76 mm2.
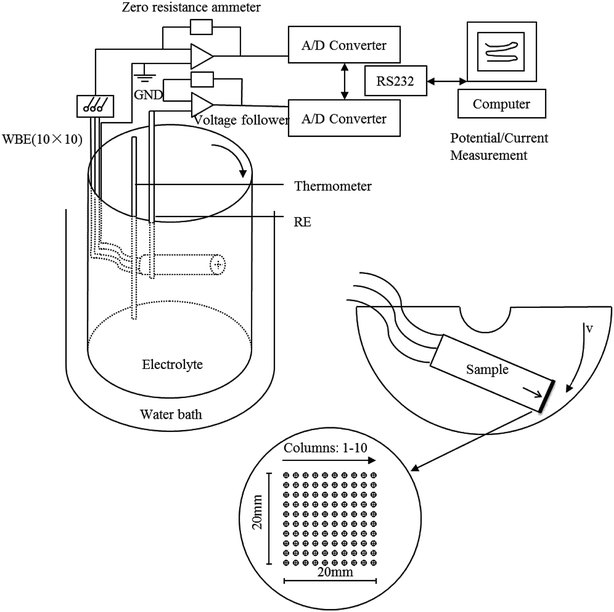 |
| | Fig. 1 Schematic diagram of the experimental setup using WBE. | |
2.3 Experimental method
The macroscopic feature was observed by a microscope (XTL-500). The morphologies were investigated using a scanning electron microscope (SEM, EVO MA15 Zeiss, Carl Zeiss Co, Oberkochen, Germany), which was equipped with an energy-dispersive X-ray spectrometer (EDS, Oxford).
Electrochemical tests were carried out with CST520 (potential and current mapper by wire beam electrodes) and electrochemical workstation CS310, which were manufactured by China Wuhan CorrTest Instruments Corp., Ltd. A three-electrode electrochemical cell with WBE (substrate and Ni–P coating) as the working electrode, a saturated calomel electrode as the reference electrode and a platinum electrode as the auxiliary electrode was used. To achieve a stabilized condition in the electrochemical workstation tests, all samples were initially immersed in a 3.5 wt% sodium chloride solution for two hours. The voltage of the electrochemical impedance spectra (EIS) tests was 10 mV, and the frequency range was 10 mHz to 100 kHz. In addition, the scanning rate of the potentiodynamic polarization tests was 1 mV s−1, and the voltage range was from −750 mV to +1250 mV relative to the open circuit potential. To achieve an acceptable level of accuracy, each test was repeated three times.
2.4 Numerical simulation of the flow
The numerical simulation of the flow was performed using the software ANSYS. Based on the flow speed condition and the experimental equipment and in order to make the numerical analysis model simple and reliable, as shown in Fig. 2, the corresponding two-dimensional physical model was established. The total number of grid nodes was 12![[thin space (1/6-em)]](https://www.rsc.org/images/entities/char_2009.gif) 924. Meanwhile, AB was the speed inlet boundary, CD was the pressure outlet boundary, and AD and BC were the solid wall boundary. The inlet speed was 1 m s−1 based on the maximum average speed of the experimental conditions. To study the flow field around the sample, the following assumptions were made: the liquid flow was assumed to be isothermal, and the fluid was assumed to be an incompressible steady-state flow. The standard k–ε model was selected.20 The simple algorithm was used to iterate in 2000 steps to simulate the speed field and stress field.
924. Meanwhile, AB was the speed inlet boundary, CD was the pressure outlet boundary, and AD and BC were the solid wall boundary. The inlet speed was 1 m s−1 based on the maximum average speed of the experimental conditions. To study the flow field around the sample, the following assumptions were made: the liquid flow was assumed to be isothermal, and the fluid was assumed to be an incompressible steady-state flow. The standard k–ε model was selected.20 The simple algorithm was used to iterate in 2000 steps to simulate the speed field and stress field.
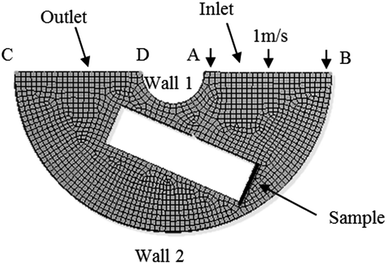 |
| | Fig. 2 Model of flow simulation and calculation. | |
3. Results and discussion
3.1 Morphological and elemental analyses
In order to prevent corrosion at the interface between the coating and the substrate, the WBE surface was sealed with silicone, as shown in Fig. 3. Meanwhile, Fig. 4 reveals the SEM micrograph together with the EDS spectral analysis of the Ni–P coating. As can be seen in Fig. 4(a), the morphology of this coating is spherical or cauliflower-like. The spheres (Ni–P nucleus) were organized alongside each other without cracks, holes and other defects. The reason for forming this spherical shape is that the Ni–P precipitates tend to reduce their energy associated with the surface. These results were consistent with the study by Ma et al.21 Fig. 4(b) shows the cross-section microstructure (SEM) of the Ni–P coating. It could be seen that the bonding between the coating and the substrate was strong and the thickness of the Ni–P coating was 3–4 μm. Table 2 gives the results of the quantity of the elements present in the Ni–P coating through EDS analysis. It could be seen that the Ni–P coating contained 5.87 wt% phosphorus. It was clear that the phosphorus content of the produced coating was between 5% and 9%, which was beneficial for improving the corrosion resistance.22
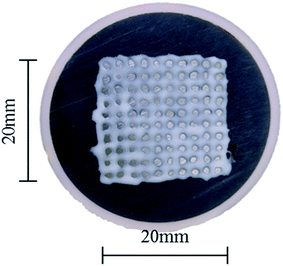 |
| | Fig. 3 The WBE surface sealed with silicone rubber. | |
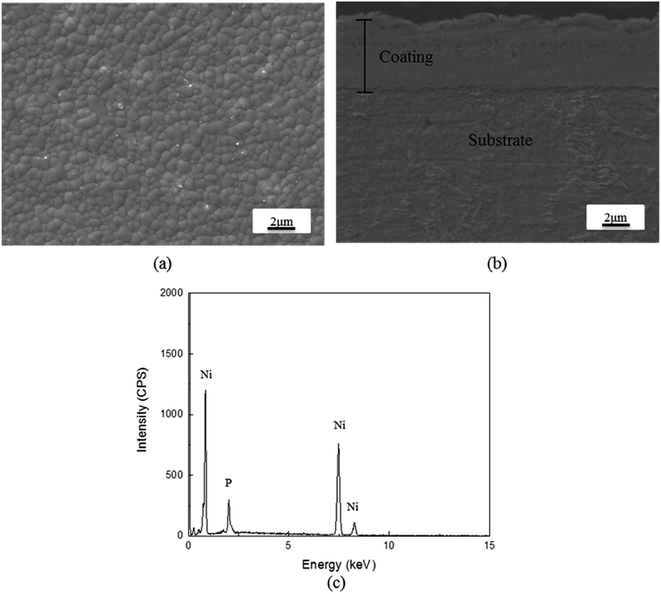 |
| | Fig. 4 (a) Microstructure (SEM) of the Ni–P coating. (b) The cross-section microstructure (SEM) of the Ni–P coating. (c) Elemental analysis (EDS) of the Ni–P coating. | |
Table 2 The amount of different elements (EDS results) in the Ni–P coating
| Element |
Wt% |
Atomic% |
| P |
5.87 |
10.57 |
| Ni |
94.13 |
89.43 |
3.2 Electrochemical analysis
With the existence of different flow speeds, there were distinct corrosion behaviors for the substrate and the Ni–P coating. Fig. 5 and 6 show the corrosion potential and galvanic current distribution maps at different flow speeds for the substrate (Fig. 5(a) and (b)) and the Ni–P coating (Fig. 6(a) and (b)), respectively, within eight hours. The coordinates in the maps are the column and row numbers of the microelectrode in WBE.
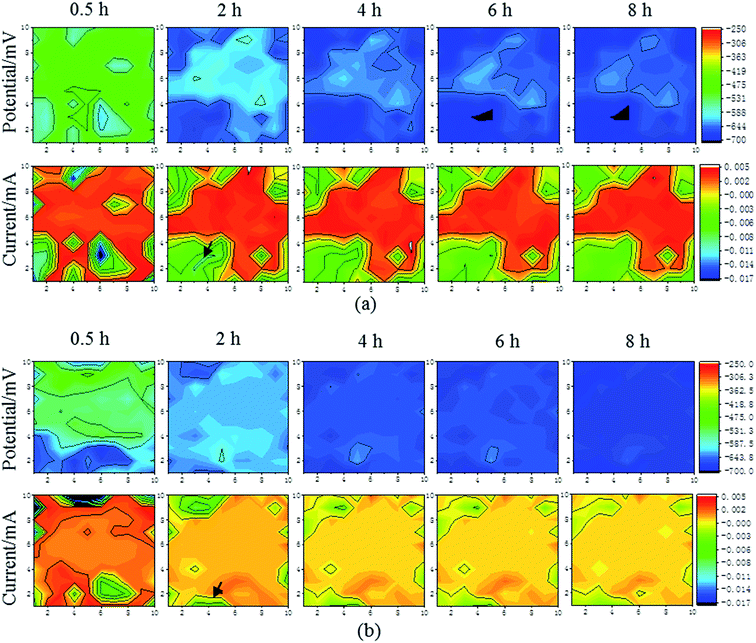 |
| | Fig. 5 The corrosion potential and galvanic current distribution maps of the substrate at room temperature and different speeds: (a) 0.5 m s−1; (b) 1 m s−1. | |
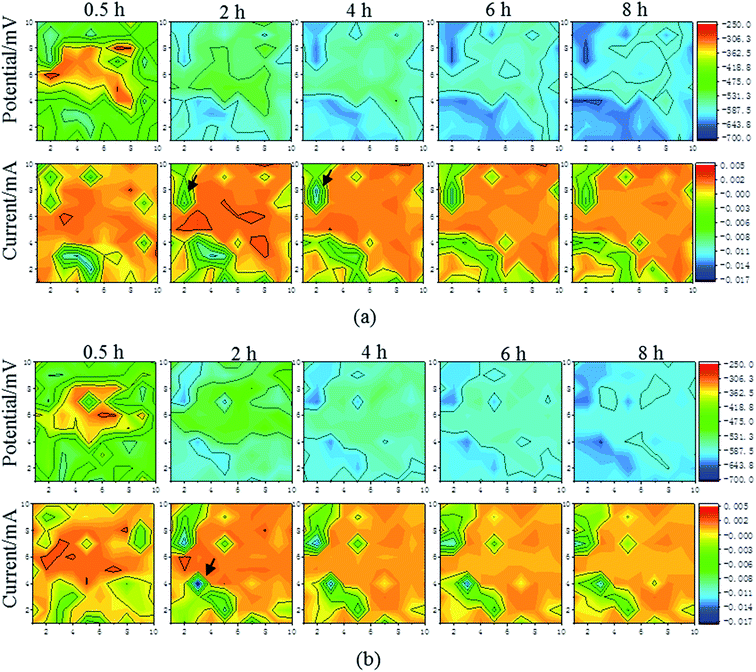 |
| | Fig. 6 The corrosion potential and galvanic current distribution maps of the Ni–P coating at room temperature and different speeds: (a) 0.5 m s−1; (b) 1 m s−1. | |
There were some significant numerical differences in the corrosion potentials and galvanic current distributions in the respective areas of the sample as a whole, which were reflected from the color and the scale. In all the stages, as shown for WBE (the corrosion potential distribution maps in Fig. 5 and 6), it can be seen that the corrosion potential of both samples becomes more negative over time within eight hours regardless of the flow speed. Furthermore, the average corrosion potential of the substrate was −531.3 mV within half hour when the speed was 1 m s−1, but that of the Ni–P coating was −418.8 mV. The average galvanic current of the substrate was 0.003 mA within half hour when the speed was 1 m s−1, but that of the Ni–P coating was 0.001 mA. This indicated that the Ni–P coating possessed a lower corrosion potential and higher galvanic current than the Ni–P coating within half hour. The same law was found when the speed was 0.5 m s−1. In addition, the region of the positive current was the anode; these maps revealed that the anode current decreased and the cathode current increased with the decrease in the corrosion potential behaved as the tendency of local corrosion to general corrosion. However, from the color in Fig. 5 and 6, as indicated by the arrows, the cathode current of the substrate changes to −0.003 mA from −0.001 mA in a small area within four hours at the speed of 1 m s−1. The cathode current of the Ni–P coating changed to −0.01 mA from −0.004 mA in a small area within four hours when the speed was 1 m s−1. It was also found that the cathode current became negative in a small area within four hours when the speed was 0.5 m s−1. This was attributed primarily to the generation of the corrosion products at the WBE surface. The corrosion product layer can hinder the transport of the corrosive electrolyte to the sample surface, which may directly lead to the decrease in the cathode current. Meanwhile, there are the same corrosion laws that the cathode current of the local area increases with the increase in immersion time because the corrosion product is washed away by the fluid. Therefore, it is effective to use WBE to research the local corrosion behavior of a substrate and an Ni–P coating.
From Fig. 5 and 6, it is seen that the corrosion mechanism at 0.5 m s−1 is the same as the mechanism at 1 m s−1. To obtain accurate numerical variation at 1 m s−1 of the electrochemical parameters about different columns on the surface of WBE, a series of numerical analyses were applied based on the average corrosion potential. For the two kinds of samples in the immersion experiment at 1 m s−1, the average corrosion potential at room temperature as a function of corrosion time is depicted in Fig. 7. It can be observed that the average corrosion potentials of different columns on the surface of the substrate are from −560 mV to −595 mV within half hour, while those of the Ni–P coating are from −425 mV to −475 mV. This indicates that the average corrosion potential of different columns on the surface of the substrate is more negative than that for the Ni–P coating. Moreover, it decreases as the immersion time increases. Meanwhile, as can be seen in Fig. 7, by comparing the average corrosion potentials of different columns on the surfaces of the two kinds of the samples at the same immersion time in 1 m s−1, the area with the most negative corrosion potential is concentrated on the column of one to three. Apparently, this suggests that the corrosion tendency in the column of one to three is higher than others.
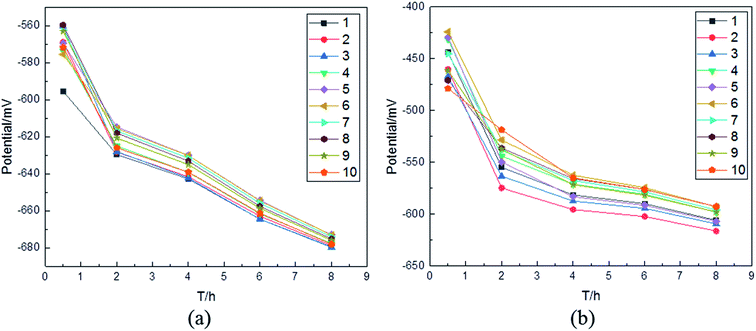 |
| | Fig. 7 The average corrosion potential at the speed of 1 m s−1 for different columns on the surface of WBE as a function of corrosion time: (a) the substrate; (b) the Ni–P coating. | |
In order to further explain the phenomenon in Fig. 7, the flow field around the sample at 1 m s−1 was simulated. The speed vectors at 1 m s−1 are shown in Fig. 8(a); it can be seen that the vector of the fluid becomes denser on the surface of the sample. Meanwhile, there is an important phenomenon indicated in Fig. 8(b): the speed on the surface of the sample decreases from B to A, which corresponds to the potential change on the surface of the sample in Fig. 7(a) and (b). The Q235 steel is mainly composed of Fe, and the Ni–P coating is more difficult to corrode than the Q235 steel. The sample mainly undergoes an electrochemical corrosion reaction when immersed in 3.5 wt% sodium chloride solutions. It can be concluded that the Ni–P coating surface was corroded first. Then, the substrate began to corrode. As the fluid flowed, the chemical interaction of O2 with the sample was promoted. P was oxidized to H2PO2−, forming an adsorption layer. The adsorption layer was unstable and easily fell off under the action of the fluid shearing force. With the increase in the oxygen concentration under the flow condition, Fe was more easily oxidized to Fe2+.23,24 However, the average corrosion potential of the first column, as shown in Fig. 7(a), was the most negative at the beginning, and it gradually became less negative than those of the second and third columns on increasing the immersion time. On the contrary, as can be seen in Fig. 7(b), the most negative average corrosion potential is not that of the first column. The phenomenon can be explained as follows: after enough immersion time, more compact corrosion products were concentrated on the surface of the sample, which blocked the diffusion of corrosive media to prevent the sample from corrosion. Meanwhile, it could be seen that the flow speed in B was not only higher than that in A, but also so narrow that the fluid flow was very complicated. Therefore, the corrosion products moved with the direction of the fluid movement and accumulated on the first column. In addition, the static pressure field at 1 m s−1 (Fig. 8(c)) revealed that the largest static pressure was 9.41 Pa. According to Fig. 8(b) and 11, the effect on the corrosion result after eight hours is not obvious.
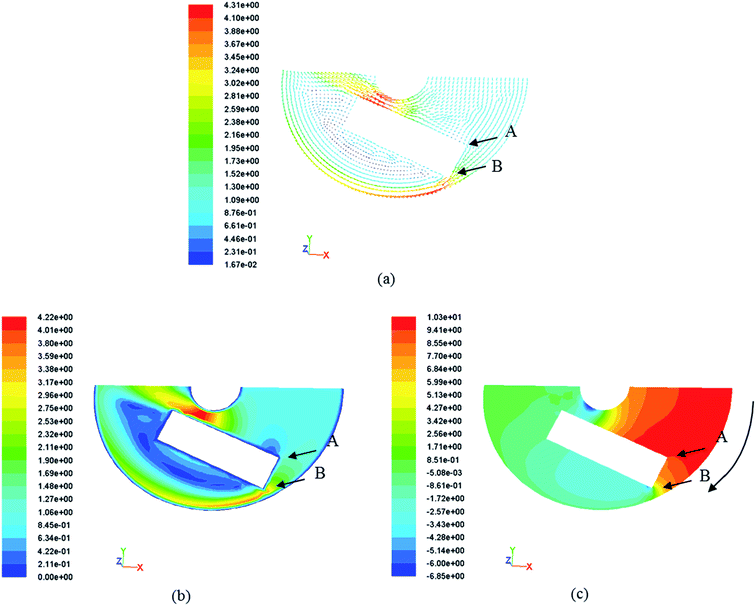 |
| | Fig. 8 (a) Speed vectors at 1 m s−1; (b) speed field at 1 m s−1; (c) static pressure field at 1 m s−1. | |
The Nyquist plots acquired from the EIS test for the blocky Q235 steel and the Ni–P coating under different speed conditions are depicted in Fig. 9. The reaction of the electrode was mainly due to the surface charge transfer process. The large capacitance arc diameter indicated that the charge transfer resistance was large. The size of the capacitance arc diameter in the EIS spectrum reflects the size of the charge transfer resistance.25 As shown in Fig. 9(a) and (b), the radius of the capacitance arc decreases as the speed increases, and the capacitance arc radius of the Ni–P coating is larger than that of the substrate. This indicated the higher resistance against the corrosion of the Ni–P coating with respect to that of the substrate, and the corrosion resistance decreased with the increase in speed.
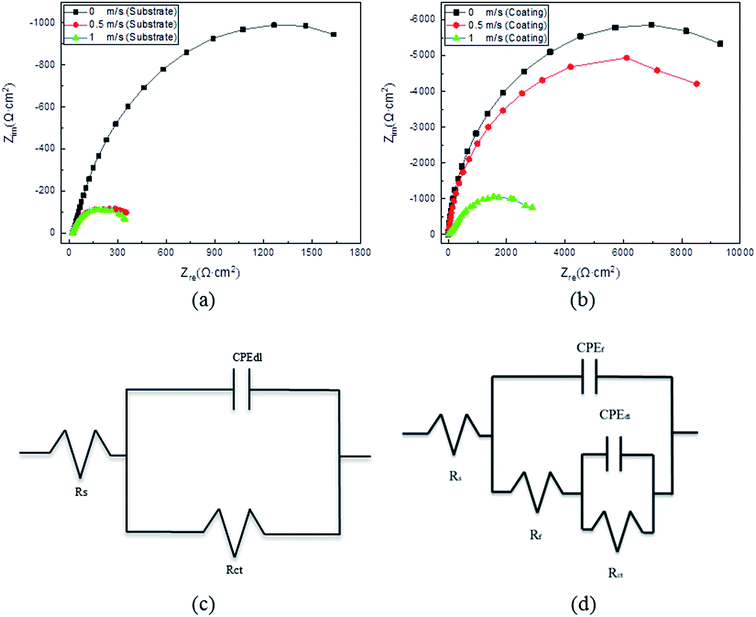 |
| | Fig. 9 Nyquist plots acquired from EIS tests for the Q235 steel (a) and the Q235 steel with Ni–P coating (b) at room temperature and different speeds. Schematic diagram of the equivalent circuits for the Q235 steel corresponding to the Nyquist plots (c) and schematic diagram of the equivalent circuits for the coating corresponding to the Nyquist plots (d). | |
The typical Nyquist plots of the Q235 steel and electroless Ni–P coating in Fig. 9(a) and (b) can be fitted by the widely employed equivalent circuits in Fig. 9(c) and (d), respectively.26 In the equivalent circuits, the electrolyte resistance is Rs, the pore resistance at the coating surface is Rf, and the constant phase element is CPEf. CPE is generally attributed to the distributed surface reactivity, roughness, electrode porosity, and current and potential distributions associated with the electrode geometry. Therefore, here, we used CPEf rather than an ideal capacitor.27 The metal/electrolyte interface is represented by Rct and CPEdl. For the Q235 steel, the interface was between the steel surface and the electrolyte; in contrast, for the Ni–P coating, the metal/electrolyte interface was exposed to the electrolyte through defects in the coating and was therefore in series with Rf. The impedance of the above elements in the equivalent circuits is expressed by eqn (1)–(4), where the resistance impedance is ZR. The constant phase element impedance is ZCPE, which is composed of admittance (Y0) and a dispersion coefficient (n). Ztotal-steel and Ztotal-coating are the whole equivalent circuits' impedance for the Q235 steel and Ni–P coating, respectively. The different parameters associated with the proposed equivalent circuits and the relevant polarization resistance (Rp) are summarized in Tables 3 and 4. Normally, Rp is evaluated by the mathematical sum of Rct and Rf.28 A higher Rp value implies higher corrosion resistance of materials. As evident from Tables 3 and 4, the corrosion resistance of the Q235 steel and Ni–P coating decreased with the increase in flow speed. Meanwhile, the corrosion resistance of the Q235 steel improved after being coated.
| |
 | (2) |
| |
 | (3) |
| |
 | (4) |
Table 3 Parameters of equivalent circuits in Fig. 9(a)
| Parameters |
Q235 (0 m s−1) |
Q235 (0.5 m s−1) |
Q235 (1 m s−1) |
| Rs (Ω cm2) |
95.32 |
81.06 |
74.44 |
| CPEf |
Y0 (Ω−1 cm−2 sn) |
— |
— |
— |
| n (0 < n < 1) |
— |
— |
— |
| Rf (Ω cm2) |
— |
— |
— |
| CPEdl |
Y0 (Ω−1 cm−2 sn) |
2.68 × 10⁻⁴ |
5.40 × 10⁻⁴ |
1.18 × 10⁻³ |
| n (0 < n < 1) |
0.81 |
0.71 |
0.71 |
| Rct (Ω cm2) |
1.07 × 10⁴ |
1.52 × 10³ |
1.48 × 10³ |
| Rp (Ω cm2) |
1.07 × 10⁴ |
1.52 × 10³ |
1.48 × 10³ |
Table 4 Parameters of equivalent circuits in Fig. 9(b)
| Parameters |
Ni–P (0 m s−1) |
Ni–P (0.5 m s−1) |
Ni–P (1 m s−1) |
| Rs (Ω cm2) |
90.97 |
87.69 |
66.81 |
| CPEf |
Y0 (Ω−1 cm−2 sn) |
5.76 × 10⁻⁶ |
5.81 × 10⁻⁶ |
5.51 × 10⁻⁵ |
| n (0 < n < 1) |
0.95 |
0.94 |
0.74 |
| Rf (Ω cm2) |
5.14 × 10⁴ |
4.15 × 10⁴ |
1.39 × 10³ |
| CPEdl |
Y0 (Ω−1 cm−2 sn) |
6.45 × 10⁻⁵ |
8.88 × 10⁻⁵ |
8.17 × 10⁻⁵ |
| n (0 < n < 1) |
0.79 |
0.92 |
0.72 |
| Rct (Ω cm2) |
1.95 × 10⁴ |
1.85 × 10⁴ |
1.19 × 10⁴ |
| Rp (Ω cm2) |
7.09 × 10⁴ |
6.00 × 10⁴ |
1.33 × 10⁴ |
The polarization curves for the blocky Q235 steel and the Ni–P coating in 3.5 wt% sodium chloride solutions and under the speeds of 0, 0.5 and 1 m s−1 are shown in Fig. 10. The corrosion characteristics of the substrate and the Ni–P coating are provided in Table 5. It can be observed from Fig. 10 that a higher corrosion current occurs at a higher speed and the corrosion current of the Ni–P coating is lower than that of the substrate. Overall, it can be seen from Fig. 10 and Table 5 that the corrosion resistance of the substrate can be improved by the electroless Ni–P coating, and the corrosion resistance decreases with the increase in speed.
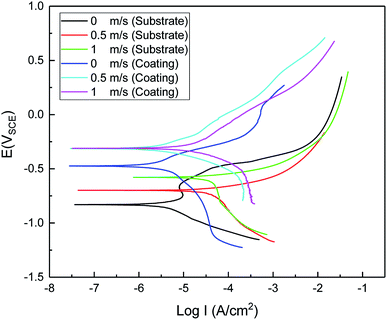 |
| | Fig. 10 Polarization graphs of the Q235 steel and the Ni–P coating at room temperature and different speeds. | |
Table 5 The corrosion current density and potential in composite coatings of the Q235 steel and the Ni–P coating at room temperature and various speeds
| Sample |
Speed (m s−1) |
Ecorr (mV) |
Icorr (μA cm−2) |
| Q235 steel |
0 |
−976.31 |
22.38 |
| 0.5 |
−700.53 |
42.68 |
| 1 |
−580.25 |
46.61 |
| Ni–P coating |
0 |
−473.34 |
2.31 |
| 0.5 |
−312.27 |
2.99 |
| 1 |
−309.95 |
11.72 |
3.3 Corrosion morphology
The macroscopic corrosion morphology of the WBE surfaces after eight hours of immersion time in 3.5 wt% sodium chloride solutions at the speed of 1 m s−1 is shown in Fig. 11(a). The sealed silica was removed after corrosion; it indicated that severe corrosion occurred on each column, and there was a yellow-brown corrosion product on the surface of WBE. Among them, the yellow product was mainly composed of α-FeOOH and γ-FeOOH.29,30 This indicated that WBE was prone to corrosion seriously within eight hours. However, from Fig. 11(b), there is a different trend of WBE with the Ni–P coating: α-FeOOH and γ-FeOOH mainly concentrate on columns one to three. Meanwhile, the WBE corrosion resistance was improved by the Ni–P coating so that the corrosion products did not appear in some areas. The results were consistent with the data of the electrochemical tests and numerical simulations of flow.
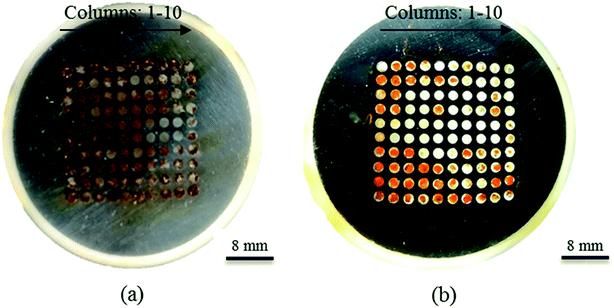 |
| | Fig. 11 The macroscopic corrosion morphology images of the sample surfaces after eight hours of immersion time in 3.5 wt% sodium chloride solutions at room temperature and a speed of 1 m s−1: (a) WBE; (b) WBE with Ni–P coating. | |
In order to further research the dynamic localized corrosion behavior of the samples after eight hours of immersion time in 3.5 wt% sodium chloride solutions at different speeds, the macroscopic corrosion morphologies of the substrate and the Ni–P coating were investigated (Fig. 12). It can be seen that corrosion products are accumulated on the substrate surface, which is corroded seriously. Meanwhile, the surface of the Ni–P coating was no longer smooth. When the fluid was static, as shown in Fig. 12(a), α-FeOOH and γ-FeOOH mainly adsorbed onto the substrate surface. The corrosion products are not observed in Fig. 12(d). When the fluid speed was 0.5 m s−1, as shown in Fig. 12(b), there were more corrosion products on the substrate surface, while the corrosion products within the local area were washed away due to the higher flow speed. It was clear that the washed traces of the samples were revealed by the exposed shiny surface. At the same time, as shown in Fig. 12(e), there is a small amount of yellow products and black spots in the local area of the surface of the Ni–P coating, and these spots are different in size and color. When the fluid speed was 1 m s−1, as shown in Fig. 12(c), the area with corrosion products on the surface of the sample was less than that at 0.5 m s−1. However, Fig. 12(f) shows that more corrosion products appear at the local area of the Ni–P coating surface, and black spots with different colors and sizes are still observed. This result indicated that the corrosion products on the Q235 steel were washed away and the Ni–P coating was corroded to the substrate at the speed of 1 m s−1.
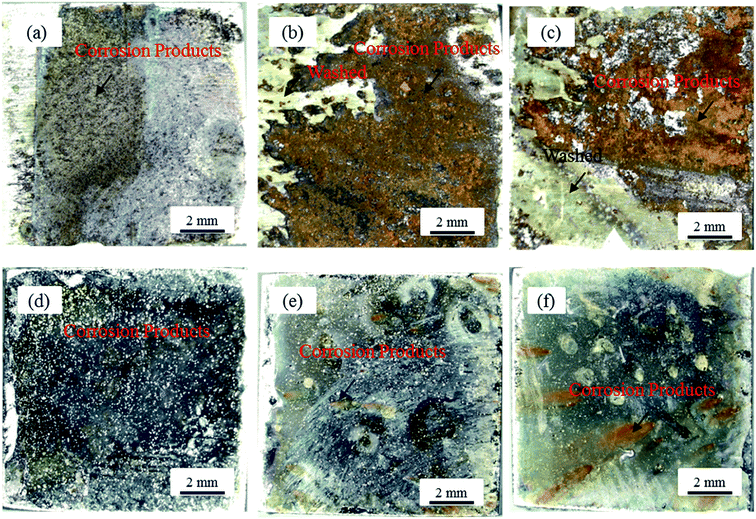 |
| | Fig. 12 The macroscopic corrosion morphology images of the sample surfaces after eight hours of immersion time in 3.5 wt% sodium chloride solutions at room temperature and different speed conditions: the Q235 steel (a) 0 m s−1; (b) 0.5 m s−1; (c) 1 m s−1; the Ni–P coating (d) 0 m s−1; (e) 0.5 m s−1; (f) 1 m s−1. | |
In terms of the results under macroscopic conditions, it is necessary to observe the microscopic morphology of the sample after corrosion. Fig. 13 shows the micro-morphology of the samples after eight hours of immersion time in 3.5 wt% sodium chloride solutions at different speeds. When the fluid was static, it was observed that some flaky corrosion products became attached to the surface of the substrate (Fig. 13(a)) and a large number of sparse white particles appeared (Fig. 13(d)). When the fluid speed was 0.5 m s−1, as shown in Fig. 13(b), the corrosion products of the substrate surface were no longer flaky in shape and it became sparsely high, accompanied by grooves. However, as shown in Fig. 13(e), there are corrosion holes only in a localized area for the Ni–P coating. When the fluid speed was 1 m s−1, a smooth and uniform corrosion appearance appeared in the localized area of the substrate surface (Fig. 13(c)). At the same time, a larger corrosion pit appeared in the local region under the same SEM magnification (Fig. 13(f)). These results indicated that the corrosion became more serious as the fluid speed increased. The reason for this observation is that the interaction of chloride ions with the surface of the sample increased. Apart from this, the substrate tended to corrode uniformly within eight hours of immersion time. The pitting corrosion occurred in a localized area of the Ni–P coating, and the position and depth of the pitting corrosion were uneven.
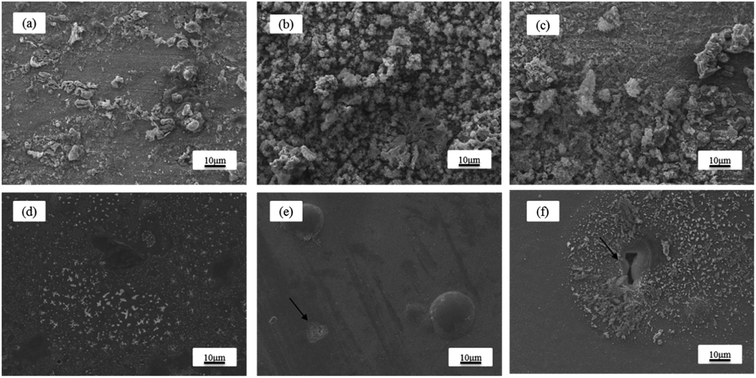 |
| | Fig. 13 SEM images of the sample surfaces after eight hours of immersion time in 3.5 wt% sodium chloride solutions at room temperature and different speed conditions: Q235 steel at (a) 0 m s−1, (b) 0.5 m s−1, and (c) 1 m s−1; Ni–P coating at (d) 0 m s−1, (e) 0.5 m s−1, and (f) 1 m s−1. | |
4. Conclusions
In this study, the local corrosion behavior and mechanism of the substrate and the Ni–P coating in 3.5 wt% sodium chloride solutions under different flow speeds were investigated. The results showed that the local corrosion behavior and mechanism of the substrate and the Ni–P coating complicated with the increase in the corrosion time; the corrosion rate increased at the local area of the surface of the sample as the fluid velocity increased, and the Ni–P-coated samples had less corrosion products as the soaking time increased. It was concluded that the corrosion resistance of the substrate was improved by the electroless Ni–P coating. Compared with the Ni–P coating, the electroless Ni–P coating on top of WBE can be beneficial for studying the local corrosion behavior. The obtained corrosion potential and galvanic current distribution maps can be used to study the local corrosion tendency. Meanwhile, the combination of the WBE method and numerical simulations applied in corrosion research is feasible for the evaluation of the local corrosion behavior and the mechanism of the substrate and the Ni–P coating.
Conflicts of interest
There are no conflicts to declare.
Acknowledgements
This research was financially supported by the National Natural Science Foundation (No. 51801167), Young Elite Scientists Sponsorship Program by China Association for Science and Technology (YESS, No. 2018QNRC001), and Youth Scientific and Innovation Research Team for Advanced Surface Functional Materials, Southwest Petroleum University (No. 2018CXTD06).
References
- D. Seifzadeh, H. K. Mohsenabadi and Z. Rajabalizadeh, Electroless Ni–P plating on magnesium alloy by innovative, simple and non-toxic oxalate pretreatment and its corrosion protection, RSC Adv., 2016, 6, 97241–97252 RSC.
- H. Liu, Y. Y. Lv, Z. Liu, H. Liu and G. E. Thompson, Dry sliding wear behaviour and structural characteristics of laser-annealed electroless Ni–P/Ni–Mo–P duplex coatings, Tribol. Int., 2016, 103, 343–351 CrossRef CAS.
- G. J. Zhang, W. Y. Lai, C. X. Yin and X. Q. Xu, Research Status of Ni–P Electroless Plating on Metal Surface, Surf. Technol., 2016, 45(2), 8–16 CAS.
- S. Y. Bi, H. Zhao, L. Hou and Y. X. Lu, Comparative study of electroless Co–Ni–P plating on Tencel fabric by Co0-based and Ni0-based activation for electromagnetic interference shielding, Appl. Surf. Sci., 2017, 419, 465–475 CrossRef CAS.
- Y. Yang and Y. F. Cheng, Electrolytic deposition of Ni–Co–SiC nano-coating for erosion-enhanced corrosion of carbon steel pipes in oil sand slurry, Surf. Coat. Technol., 2011, 205, 3198–3204 CrossRef CAS.
- S. R. Allahkaram, S. Mamaghani and T. Rabizadeh, An evaluation of Ni–P and Ni–P/Nano-SiO2 coatings on sweet corrosion of API-5L-X70 pipelines steels, Int. J. Mod. Phys. C, 2012, 5, 825–832 CAS.
- C. H. Wang, Z. Farhat, G. Jarjoura, M. K. Hassan and A. M. Abdullah, Indentation and erosion behavior of electroless Ni–P coating on pipeline steel, Wear, 2017, 376, 1630–1639 CrossRef.
- S. H. M. Anijdan, M. Sabzi, M. R. Zadeh and M. Farzam, The influence of pH, rotating speed and Cu content reinforcement nano-particles on wear/corrosion response of Ni–P–Cu nano-composite coatings, Tribol. Int., 2018, 127, 108–121 CrossRef CAS.
- Q. Y. Wang, Y. C. Xi, Y. H. Zhao, S. Liu, S. L. Bai and Z. D. Liu, Effects of laser re-melting and annealing on microstructure, mechanical property and corrosion resistance of Fe-based amorphous/crystalline composite coating, Mater. Charact., 2017, 127, 239–247 CrossRef CAS.
- P. Shoghi, D. Seifzadeh, M. Gholizadeh-Gheshlaghi and A. Habibi-Yangjeh, Pretreatment-free Ni–P plating on magnesium alloy at low temperatures, Trans. Nonferrous Met. Soc. China, 2018, 28, 2478–2488 CrossRef CAS.
- Y. Tan and T. Liu, Characterising localised corrosion inhibition by means of parameters measured by an electrochemically integrated multielectrode array, Br. Corros. J., 2014, 49, 23–31 CAS.
- H. Ju, Y. F. Yang, Y. F. Liu, S. F. Liu, J. Z. Duan and Y. Li, Mapping the galvanic corrosion of three metals coupled with a wire beam electrode: The influence of temperature and relative geometrical position, Materials, 2018, 11(3), 357 CrossRef.
- Y. Huo, M. Y. Tan and M. Forsyth, Visualising dynamic passivation and localised corrosion processes occurring on buried steel surfaces under the effect of anodic transients, Electrochem. Commun., 2016, 66, 21–24 CrossRef CAS.
- J. Z. Hu, P. C. Deng, J. B. Zhang, X. Gao, H. H. Hu, Q. B. Liu and G. Wang, Macro non-uniform corrosion of q235 steel in tropical and coastal red soils, Corros. Sci. Prot. Technol., 2017, 29, 233–240 Search PubMed.
- X. X. Zhang, Z. M. Gao, W. B. Hu, Z. P. Wu, L. H. Han, L. H. Lu, Y. Xiu and D. H. Xia, Correlation between corrosion behavior and image information of Q235 steel beneath thin electrolyte film, J. Chin. Soc. Corros. Prot., 2017, 37(5), 444–450 Search PubMed.
- Y. Z. Xu and M. Y. Tan, Visualising the dynamic processes of flow accelerated corrosion and erosion corrosion using an electrochemically integrated electrode array, Corros. Sci., 2018, 139, 438–443 CrossRef CAS.
- R. H. Ponnamma, D. Teegala, S. R. Ranjan, V. Kain and B. D. Kumar, Numerical simulation of turbulent flow in carbon steel pipes leading to flow accelerated corrosion, Arabian J. Sci. Eng., 2014, 39(8), 6435–6451 CrossRef.
- G. F. Xu, G. F. Ou, T. Chen, P. X. Li and H. Z. Jin, Numerical simulation and factor analysis of petrochemical pipe erosion-corrosion failure, IOP Conf. Ser.: Mater. Sci. Eng., 2016, 129, 12–33 Search PubMed.
- D. Zhang, Y. Jin, X. Guan, J. J. Wang, Y. H. Jin and Y. Li, Numerical and electrochemical analyses on carbon dioxide corrosion of X80 pipeline steel under different water film thicknesses in NACE solution, J. Nat. Gas Sci. Eng., 2017, 37, 199–216 CrossRef.
- P. Li, Y. Zhao, B. Liu, G. X. Zeng, T. Zhang, D. Xu, H. Gu, T. Y. Gu and F. H. Wang, Experimental testing and numerical simulation to analyze the corrosion failures of single well pipelines in Tahe oilfield, Eng. Failure Anal., 2017, 80, 112–122 CrossRef.
- B. L. Ma and R. H. Wang, Tuning interface to improve corrosion resistance of electroless Ni–P coating on AZ31B alloy, Metals, 2018, 8, 328 CrossRef.
- J. Q. Gao and W. B. Hu, A research on the control of phosphorous content in electroless Ni–P coating and the effect on the performances of the coating, Electroplat. Pollut. Control, 2002, 22, 1–4 CAS.
- R. H. Ponnamma, D. Teegala, S. R. Ranjan, V. Kain and B. D. Kumar, Numerical simulation of turbulent flow in carbon steel pipes leading to flow accelerated corrosion, Arabian J. Sci. Eng., 2014, 39(8), 6435–6451 CrossRef.
- H. Yang, W. Z. Lu and J. Li, et al., Research progress in degradation process of anti-corrosion coatings in water containing environments, Corros. Sci. Prot. Technol., 2012, 24(6), 452–457 CAS.
- S. C. Chung, S. L. Sung, C. C. Hsien and H. C. Shih, Application of EIS to the initial stages of atmospheric zinc corrosion, J. Appl. Electrochem., 2000, 30(5), 607–615 CrossRef CAS.
- R. S. Raman, P. C. Banerjee, D. E. Lobo, H. Gullapalli, M. Sumandasa, A. Kumar and M. Majumder, Protecting copper from electrochemical degradation by graphene coating, Carbon, 2012, 50, 4040–4045 CrossRef.
- W. Trabelsi, E. Triki, L. Dhouibi, M. G. S. Ferreira, M. L. Zheludkevich and M. F. Montemor, The use of pre-treatments based on doped silane solutions for improved corrosion resistance of galvanised steel substrates, Surf. Coat. Technol., 2006, 200, 4240–4250 CrossRef CAS.
- Q. Y. Wang, Y. R. Tang, R. Pei, Y. C. Xi and S. Wan, A study on preparation and corrosion behavior of nano rare earth oxide-modified chromized coatings, Mater. Corros., 2019, 1–9 Search PubMed.
- J. A. Jaén, J. Iglesias and C. Hernández, Analysis of short-term steel corrosion products formed in tropical marine environments of panama, Int. J. Corros., 2012, 3, 1–11 Search PubMed.
- H. Antony, H. Legrand, L. Maréchal, S. Perrin, Ph. Dillmann and A. Chaussé, Study of lepidocrocite γ-FeOOH electrochemical reduction in neutral and slightly alkaline solutions at 25 °C, Electrochim. Acta, 2005, 51, 745–753 CrossRef CAS.
|
| This journal is © The Royal Society of Chemistry 2019 |
Click here to see how this site uses Cookies. View our privacy policy here.  Open Access Article
 *a,
Rui Peia,
Yu-Chen Xia,
Li-Jin Donga,
Shu-Lin Baib and
Shanhong Wan*c
![[thin space (1/6-em)]](https://www.rsc.org/images/entities/char_2009.gif) 924. Meanwhile, AB was the speed inlet boundary, CD was the pressure outlet boundary, and AD and BC were the solid wall boundary. The inlet speed was 1 m s−1 based on the maximum average speed of the experimental conditions. To study the flow field around the sample, the following assumptions were made: the liquid flow was assumed to be isothermal, and the fluid was assumed to be an incompressible steady-state flow. The standard k–ε model was selected.20 The simple algorithm was used to iterate in 2000 steps to simulate the speed field and stress field.
924. Meanwhile, AB was the speed inlet boundary, CD was the pressure outlet boundary, and AD and BC were the solid wall boundary. The inlet speed was 1 m s−1 based on the maximum average speed of the experimental conditions. To study the flow field around the sample, the following assumptions were made: the liquid flow was assumed to be isothermal, and the fluid was assumed to be an incompressible steady-state flow. The standard k–ε model was selected.20 The simple algorithm was used to iterate in 2000 steps to simulate the speed field and stress field.


