 Open Access Article
Low-cost and environmentally friendly synthesis of an Al3+ and Mn4+ co-doped Li4Ti5O12 composite with carbon quantum dots as an anode for lithium-ion batteries
Hui Nana,
Yiming Zhanga,
Haomin Weia,
Huiyuan Chena,
Caihong Xuea,
Guijun Yanga,
Shuai Zou *a,
Gang Wang*b and
Hong Lin
 c
c
aQinghai University, Xining 810016, China. E-mail: shuai_zou1990@163.com
bQinghai Nationalities University, Xining 810007, China. E-mail: wanggang5208@qhu.edu.cn
cTsinghua University, Beijing 100084, China
First published on 16th July 2019
Abstract
To increase the specific capacity and conductivity of lithium titanate (LTO), low-cost and environmentally friendly carbon quantum dots (CQDs) were used to composite with Al3+ and Mn4+ co-doped Li4Ti5O12 (LTO-Al/Mn) to improve its electrical properties. The Al3+ and Mn4+ were successfully substituted for Ti located at (16d) sites in the LTO and the CQDs formed a composite with LTO-Al/Mn. The specific capacity of the first cycle at 0.1C increased to 296.5 mA h g−1, and the impedance decreased to 16.8 Ω. The specific capacity maintained 236.0 mA h g−1 after 100 cycles.
Introduction
With the increasingly serious environmental problems caused by the gradual exhaustion of non-renewable energy, lithium ion batteries (LIBs) have become one of the most promising technologies for energy storage batteries. Spinel lithium titanate (Li4Ti5O12, LTO) is a new kind of electrode material for energy storage batteries, especially as a potential long-life anode material in LIBs, which has aroused wide attention due to its zero-strain character. In the charge/discharge process, the volume change is less than 1%. Furthermore, it has a flat potential plateau at about 1.55 V (vs. Li/Li+), which is higher than the reduction potential of most organic electrolytes.1,2 This is beneficial in avoiding the formation of lithium dendrites. However, LTO has important shortcomings; for example, the theoretical specific capacity is only 175 mA h g−1, and the intrinsic conductivity is only 10−13 S cm−1.3–7 Thus, the commercial application of LTO in LIBs is hindered by these weaknesses.To promote the process of commercial application, numerous research studies have been conducted to improve the performance of LTO, including nano-sized synthesis,8–10 coating a second phase with high capacity or conductivity such as Ag, Cu, or carbon,11–16 and doping with ions such as Na+, Mg2+, Fe3+, Ag+, Zn2+ and F− in Li, Ti, or O sites.16–19 To our knowledge, the ionic radii of Al3+ and Mn4+ are approximately equal to Ti4+. The performance of the material makes it possible for elemental substitution without changing the crystal structure, which is useful to improve the conductivity and retain the high cycling performance at the same time. Carbon quantum dots (CQDs) were easily fabricated via the electrochemical anodic oxidation of alcohol. Batteries and electrochemical capacitors (ECs), which are also called super capacitors, are the two most important applications for CQDs. Javed et al.20 prepared CQDs from the chemical oxidation of D-(+)-glucose. The CQDs possess a quasi-spherical structure with facile storage and transport channels for lithium and sodium-ions. The specific capacity retained 869.4 mA h g−1 at 0.5C after 500 cycles and 340.2 mA h g−1 at 20C after 500 cycles. The performance of CQDs is excellent in cycling and the high C rate cycle. The quantum effects, efficient ion diffusion, and the charge transfer performance benefit from the extreme downsizing of the diameter.
Experimental section
Hulless barley straw and wheat straw were soaked in an 80% H3PO4 solution for 0.5 h and then placed in a blast drying oven at 140 °C for an activation time of 1 h. The activation of both mixtures was carried out in a laboratory muffle furnace under N2 flow. In the tubular furnace, the temperature was increased at approximately 5 °C min−1 from room temperature to 450 °C and maintained at 450 °C for 2.5 h. Afterward, the two activated carbons were washed several times with deionized water and adding 0.1 M HCl to remove ash byproducts. Then, washing products with deionized water until pH = 7 were reached. The CQDs were dried at 110 °C for 24 hours and stored in a dryer.In this experiment, 5–10 nm TiO2, Al(NO3)3·9H2O, MnO2, LiOH·H2O and CQDs were used as raw materials. Tween-80 and span-80 served as surfactants; ethylene glycol (EG) was the solvent; and 30 wt% NH3·H2O acted as the pH regulator. Tween-80 and span-80 were mixed together in a beaker, and the Hydrophile Lipophilic Balance (HLB) value of mixture was adjusted to 9.5. The EG was mixed with deionized water in equal portions. The mixture was stirred for 5 min while heating at 50 °C in a water bath. Then, TiO2 (1.5250 g), MnO2 (0.0469 g), Al(NO3)3·9H2O (0.0109 g) and CQDs (0.0500 g) were added to the mixture and stirred in a water bath for 5 min. Next, the beaker was placed on a magnetic stirrer, and the LiOH·H2O (1.0507 g) was added and stirred for 30 min at 500 rpm. The mixture was then transferred to polytetrafluoroethylene (PTFE) lining, and 10 mL of 30% (wt) NH3·H2O was added. The reaction kettle was sealed and placed in a drying oven at 170 °C for 36 h. Samples were washed by deionized water and anhydrous ethanol three times and dried at 50 °C for 10 h in a vacuum oven. Then, the samples were ground and transferred to a corundum crucible.
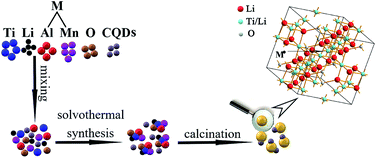
The temperature was raised to 800 °C at a rate of 10 °C min−1 and was heated at 800 °C for 3 h in the tube furnace cooling to room temperature with N2 protection. The samples were ground by wet ball-milling for 12 h at 250 rpm in a zirconia ceramic jar. Anhydrous ethanol was used to wash the samples three times, and they were then dried in a vacuum oven for 10 h at 50 °C. The sample of CQDs composite with Al3+ and Mn4+ co-doped LTO (LTO-Al/Mn-CQDs) were finally obtained. Fig. 1 shows the entire schematic diagram of the formation of LTO-Al/Mn. All of the raw materials were mixed evenly and synthesized the new material.
Characterization
The microstructure of the electrode materials was analyzed using transmission electron microscopy (TEM, JEM-2100F) equipped with an EMSA/MAS energy dispersive spectroscope (EDS), and X-ray diffractometry (XRD, D/max2500PC).All of the half-cell tests were performed in standard CR2032-type coin cells using lithium foil as the cathode current collector. The doped samples acted as the working electrodes and Celgard 2400 as the separator. The electrode was prepared as follows: 80 wt% doped LTO, 10 wt% acetylene black, and 10 wt% polyvinylidene fluoride (PVDF) were dispersed in 1-methyl-2-pyrrolidinone (NMP) to prepare a slurry. The resultant slurry was then coated on aluminum foil and dried at 120 °C for 12 h in a vacuum oven. The thickness of the LTO electrode was roughly 40 μm. The electrolyte was 1 mol L−1 LiPF6 dissolved in a 1![[thin space (1/6-em)]](https://www.rsc.org/images/entities/char_2009.gif) :
:![[thin space (1/6-em)]](https://www.rsc.org/images/entities/char_2009.gif) 1
1![[thin space (1/6-em)]](https://www.rsc.org/images/entities/char_2009.gif) :
:![[thin space (1/6-em)]](https://www.rsc.org/images/entities/char_2009.gif) 1 (vol%) mixture of ethylene carbonate (EC), dimethyl carbonate (DMC), and ethyl methyl carbonate (EMC). The cells were assembled in an Ar-filled glove box where both moisture and oxygen content were less than 0.1 ppm. The charge/discharge cycles were performed at room temperature. Electrochemical impedance spectroscopy (EIS) and cyclic voltammetry (CV) were measured on an electrochemical workstation (Zennium E, Zahner, Germany). The charge/discharge measurements were conducted on a multichannel battery test system (Arbin BT200, America).
1 (vol%) mixture of ethylene carbonate (EC), dimethyl carbonate (DMC), and ethyl methyl carbonate (EMC). The cells were assembled in an Ar-filled glove box where both moisture and oxygen content were less than 0.1 ppm. The charge/discharge cycles were performed at room temperature. Electrochemical impedance spectroscopy (EIS) and cyclic voltammetry (CV) were measured on an electrochemical workstation (Zennium E, Zahner, Germany). The charge/discharge measurements were conducted on a multichannel battery test system (Arbin BT200, America).
Results and discussion
An XRD pattern is shown in Fig. 2. The diffraction pattern is similar with all of the diffraction peaks corresponding to the single-phase cubic spinel structure with group Fd![[3 with combining macron]](https://www.rsc.org/images/entities/char_0033_0304.gif) m (JCPDS card no. 49-0207), and no distinct peaks were detected. Close inspection of the XRD patterns revealed that the peaks shifted to high degrees with the doping of Al3+, Mn4+, and Al3+/Mn4+. For a clear observation, the peak position variation of the (1 1 1) plane was magnified and shown in Fig. 2(b).
m (JCPDS card no. 49-0207), and no distinct peaks were detected. Close inspection of the XRD patterns revealed that the peaks shifted to high degrees with the doping of Al3+, Mn4+, and Al3+/Mn4+. For a clear observation, the peak position variation of the (1 1 1) plane was magnified and shown in Fig. 2(b).
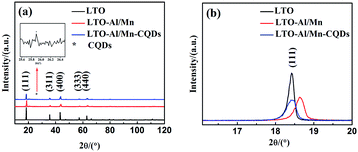 | ||
| Fig. 2 (a) XRD patterns of pure LTO, LTO-Al/Mn and LTO-Al/Mn-CQDs samples; (b) enlarged XRD patterns of (1 1 1) peaks. | ||
The characteristic peak of CQDs is shown at 25.9°. It is a direct evidence to prove the composites are successfully synthesized. The lattice parameters of LTO, LTO-Al/Mn and LTO-Al/Mn-CQDs were 8.3612, 8.3188 and 8.3553 Å, respectively. The decrease of the lattice parameter indicated that Al3+ and Mn4+ were successfully substituted for titanium located at (16d) sites in the LTO and the composites were successfully formed with LTO-Al/Mn; this slight change was attributed to the smaller size of the Al3+ (0.535 Å) and Mn4+ ions (0.530 Å) than the Ti4+ ion (0.605 Å).
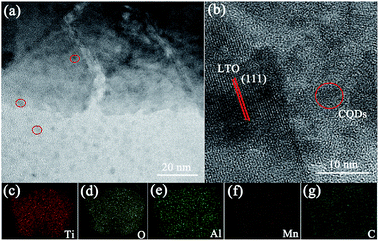
To further study the morphology of the materials, high-resolution (HR) TEM images and elemental mapping images provide further illustration. Fig. 3 exhibits the TEM image and elemental mappings of LTO-Al/Mn-CQDs. From Fig. 3(a) and (b) we can clearly observe the CQDs and LTO-Al/Mn, showing that the composites were successfully obtained. The distribution of Al, Mn and C can be seen in the Fig. 3(c)–(g), which is the powerful evidence for proving the uniform doping of the elements in the LTO crystal structure and the composites were finally obtained. The results are consistent with the XRD patterns.
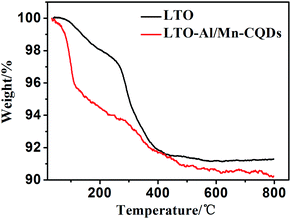
The percentage of CQDs in the composite was characterized by TGA in air. The temperature was raised to 800 °C at a rate of 10 °C min−1. As shown in Fig. 4, the mass of LTO retained 91.30% and the LTO-Al/Mn-CQDs retained 90.25%. The loss of LTO contains the oxidation and the decomposition of surfactant and the loss of LTO-Al/Mn-CQDs contains the oxidation and the decomposition of surfactant and CQDs. The difference of the loss percentage is the content of CQDs. The percentage of CQDs in the composite is 1.05%.
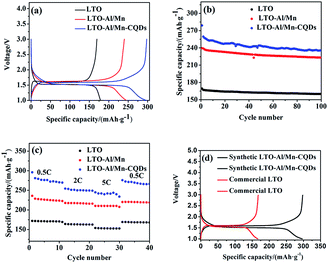
Fig. 5(a) shows the first charge–discharge curves of the LTO, LTO-Al/Mn, and LTO-Al/Mn-CQDs samples at 0.1C rate in the potential window between 1.0 V and 3.0 V. The cycling behavior is typical of LTO with a flat plateau at an average potential of 1.55 V, which is attributed to a two-phase phenomenon pertaining to Li4Ti5O12 and Li7Ti5O12 phases. The migration of Li+ is between Li4Ti5O12 and Li7Ti5O12 phases during charge/discharge processes, and the capacities of LTO, LTO-Al/Mn, and LTO-Al/Mn-CQDs are 169.4, 240.1 and 296.5 mA h g−1, respectively. All of the above samples improve the specific capacities of LTO to different degrees. The sample of LTO-Al/Mn-CQDs has the largest capacity of all samples. The main reason is that Al, Mn co-doped and CQDs can provide more Li+ active storage sites,21–23 causing the sample to have higher lithium storage performance.
The cycling performances of the samples at a rate of 2C are exhibited in Fig. 5(b). As is shown in Fig. 5(b), the cycling performances of all samples are steady. The specific capacity of LTO-Al/Mn-CQDs still maintains a high value of 236.0 mA h g−1 after many cycles.
High rate performance is one of the most important electrochemical characteristics of LIBs. It plays a key role in fast charge/discharge processes. As shown in Fig. 5(c), the specific capacities of LTO-Al/Mn-CQDs vary from 295.8 to 233.8 mA h g−1 with the C rate varying from 0.5C to 5C. The sample recovers from 233.8 to 266.1 mA h g−1 when the C rate returns to 0.5C. The capacity decreases only 10.0% after the high C rate cycles. The stable high rate cycling performance is vital to fast charge/discharge processes.
A comparison of the synthetic LTO-Al/Mn-CQDs with commercial LTO in the first cycle is shown in Fig. 5(d). The specific capacity of commercial LTO is only 166.47 mA h g−1. However, the specific capacity of the synthetic LTO-Al/Mn-CQDs is 296.5 mA h g−1. This serves as an important evidence to prove that the LTO-Al/Mn-CQDs perform better than the commercial LTO.
The charge/discharge reaction and the reversibility of the samples were examined by CV between 0 and 3 V at a scan rate of 0.2 mV s−1. The oxidation peaks and reduction peaks represent the processes of insertion and extraction of Li+, respectively. The peaks have a good symmetry, which demonstrates that the reversibility of the samples is perfect. This type of performance plays a key role in long lifetime of LIBs. The LIBs can have a long active time, which can greatly reduce the amount of retired batteries. It was also discovered that the maxima of the peaks are different. The CV curve of LTO-Al/Mn-CQDs is sharper, larger, and higher than that of pure LTO, and LTO-Al/Mn. In general, a sharp and large peak represents a fast insertion/extraction of Li+, while a broad peak indicates a lagging process.24 Therefore, LTO-Al/Mn-CQDs has a faster insertion and extraction of Li+ and better charge/discharge kinetics. The performance can provide a huge advance in fast charging and discharging.
Electrochemical impedance spectroscopy (EIS) may be considered as one of the most sensitive tools for researching electrode behaviors in LIBs. EIS results of the coin cells with the samples are shown in Fig. 6(b). The measurements were carried out after the first cycle. The impedance spectra are composed of one semicircle at higher frequencies followed by a linear part at the lower frequency end. The semicircle in the high-frequency region represents the migration of the lithium ions at the electrode/electrolyte interface. The low-frequency region of the straight line is attributed to the diffusion of the lithium ions into the bulk of the electrode material, the so-called Warburg diffusion. The impedance is smaller with a smaller radius, and the slope decreasing. Fig. 6(b) shows that the radius and the slope of the EIS curve of LTO-Al/Mn-CQDs is the smallest of all samples. The change is due to the abundant micro-pores, which are provided by the CQDs; it increases the number of transmission channel and the active storage sites of Li+, thus reducing the impedance of the material.
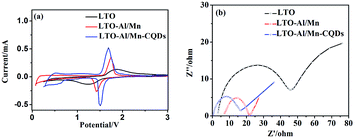 | ||
| Fig. 6 (a) CV curves of LTO, LTO-Al/Mn and LTO-Al/Mn-CQDs; (b) EIS curves of LTO, LTO-Al/Mn and LTO-Al/Mn-CQDs. | ||
Conclusions
In this paper, the low-cost and environmentally friendly CQDs were used to synthesize LTO-Al/Mn-CQDs by using a solvothermal method with a surfactant. Al3+ and Mn4+ were successfully substituted for Ti located at (16d) sites in the LTO and the composite was finally obtained. The specific capacity and the speed of charge/discharge have been greatly improved. The obvious diminution of the impedance of the samples can greatly improve the speed of charge/discharge processes. It was proven that binary doping and composite can effectively improve the properties of materials.Conflicts of interest
There are no conflicts to declare.Acknowledgements
This work was financially supported by the project of basic research for application from Qinghai Science & Technology Department (2017-ZJ-794); the third batch support project of innovation and entrepreneurship training by Qinghai University (2018-FC-5) and the special project of transformation of science & technology achievements from Qinghai Science & Technology Department (2017-GX-106).Notes and references
- D. Li, X. Zhang, X. Miao, Y. Liu, S. Chen, Y. Chen, W. Wang and Y. Zhang, Solid-state synthesized Li4Ti5O12 for ultrafast lithium ion storage enabled by carbon-coating induced particle size tailoring, J. Alloys Compd., 2019, 797, 1258–1267 CrossRef CAS.
- M. Uceda, J. G. Zhou and J. Wang, et al., Highly conductive NMP-free carbon-coated nano-lithium titanate/carbon composite electrodes via SBR-assisted electrophoretic deposition, Electrochim. Acta, 2019, 299, 107–115 CrossRef CAS.
- S. E. Smirnov, V. A. Zhorin, M. R. Kiselev, S. S. Smirnov and N. A. Yashtulov, Synthesis and Electrochemical Properties of Lithium Titanate, Inorg. Mater. Appl. Res., 2018, 9(5), 803–806 CrossRef.
- G. Lu, J. Liu, W. Huang, X. Wang and F. Wang, Boosting the electrochemical performance of Li4Ti5O12 through nitrogen-doped carbon coating, Appl. Organomet. Chem., 2019, 33, e4957 CrossRef.
- B. L. Yan, W. W. Meng and Y. J. Xu, Towards ultrafast lithium-ion batteries: A novel atomic layer deposition-seeded preparation of Li4Ti5O12-TiN-TiC anodes, J. Alloys Compd., 2018, 763, 867–874 CrossRef CAS.
- J. Wang, Y. Li and X. Zhang, et al., Study on sucrose modification of anode material Li4Ti5O12 for Lithium-ion batteries, Results Phys., 2019, 13, 102053 CrossRef.
- L. Wang, C. Tang and K. J. Takeuchi, et al., Synthesis and Characterization of Li4Ti5O12 Anode Materials with Enhanced High-Rate Performance in Lithium-Ion Batteries, MRS Adv., 2018, 3(11), 575–580 CrossRef CAS.
- F. P. Li, W. Wei and H. Wang, et al., Crystallized lithium titanate nanosheets prepared via spark plasma sintering for ultra-high rate lithium ion batteries, J. Mater. Chem. A, 2019, 7, 455–460 RSC.
- H. Luchi, T. Horikawa and K. Sotowa, Synthesis and electrochemical performance of a nanocrystalline Li4Ti5O12/C composite for lithium-ion batteries prepared using resorcinol–formaldehyde resins, Electrochim. Acta, 2019, 295, 540–549 CrossRef.
- Y. Liu, X. D. Yan, B. Q. Xu and J. L. Lan, et al., Li4Ti5O12 nanosheets assembled in tubular architecture for lithium storage, Chem. Eng. J., 2019, 361(1), 1371–1380 CrossRef CAS.
- X. Li, Y. Tang, J. H. Song, M. S. Wang and Y. Huang, et al., Self-supporting lithium titanate nanorod/carbon nanotube/reduced graphene oxide flexible electrode for high performance hybrid lithium-ion capacitor, J. Alloys Compd., 2019, 790(25), 1157–1166 CrossRef CAS.
- M. Uceda, J. Zhou, J. Wang, R. Gauvin and G. Demopoulos, Highly conductive NMP-free carbon-coated nano-lithium titanate/carbon composite electrodes via SBR-assisted electrophoretic deposition, Electrochim. Acta, 2019, 299, 107–115 CrossRef CAS.
- Z. B. Fu, L. H. Chen, L. Wan, F. Wang, J. Du, X. Yang and Y. Ding, Facile synthesis of N-doped carbon-coated Li4Ti5O12anode for application in high-rate lithium ion batteries, Ionics, 2018, 24(6), 1579–1586 CrossRef CAS.
- Y. Xiang, P. Zhao and Z. Jin, et al., Three-Dimensional and Mesopore-Oriented Graphene Conductive Framework Anchored with Nano-Li4Ti5O12 Particles as an Ultrahigh Rate Anode for Lithium-Ion Batteries, ACS Appl. Mater. Interfaces, 2018, 10, 42258–42267 CrossRef CAS.
- X. Ji, Q. Lu, E. Guo and D. Li, et al., Bamboo-Shaped Zn2+-Doped Li4Ti5O12 Nanofibers: One-Step Controllable Synthesis and High-Performance Lithium-Ion Batteries, J. Electrochem. Soc., 2018, 165, A534–A541 CrossRef CAS.
- S. Luo, P. Zhang and T. Yuan, et al., Zr-doped Li4Ti5O12 anode materials with high specific capacity for lithium-ion batteries, J. Mater. Chem. A, 2018, 32, 15755–15761 RSC.
- W. W. Meng, B. L. Yan and Y. J. Xu, A facile electrochemical modification route in molten salt for Ti3+ self-doped spinel lithium titanate, Electrochim. Acta, 2018, 279(20), 128–135 CrossRef CAS.
- Y. X. Liu, M. G. Zhao, H. Xu and J. Chen, Fabrication of continuous conductive network for Li4Ti5O12 anode by Cu-doping and graphene wrapping to boost lithium storage, J. Alloys Compd., 2019, 780, 1–7 CrossRef CAS.
- D. L. Qian, Y. J. Gu and Y. B. Chen, et al., Ultra-high specific capacity of Cr3+-doped Li4Ti5O12 at 1.55 V as anode material for lithium-ion batteries, Mater. Lett., 2019, 238(1), 102–106 CrossRef CAS.
- M. Javed, A. Saqib, A. Rehman, B. Ali and M. Faizan, et al., Carbon quantum dots from glucose oxidation as a highly competent anode material for lithium and sodium-ion batteries, Electrochim. Acta, 2019, 297, 250–257 CrossRef CAS.
- P. Wu, Y. Xu and J. Zhan, et al., The Research Development of Quantum Dots in Electrochemical Energy Storage, Small, 2018, 14(42), 1801479 CrossRef.
- V. D. Nithya and R. Kalai selvan, et al., Molten salt synthesis and characterization of Li4Ti5−xMnxO12 (x = 0.0, 0.05 and 0.1) as anodes for Li-ion batteries, Appl. Surf. Sci., 2012, 261, 515–519 CrossRef CAS.
- N. M. Ncube, W. T. Mhlongo, R. I. McCrindle and H. Zheng, The electrochemical effect of Al-doping on Li4Ti5O12 as anode material for lithium-ion batteries, Mater. Today, 2018, 5, 10592–10601 CAS.
- D. Kong, W. Ren, Y. Luo, Y. Yang and C. Cheng, Scalable synthesis of graphene-wrapped Li4Ti5O12 dandelion-like microspheres for lithium-ion batteries with excellent rate capability and long-cycle life, J. Mater. Chem. A, 2014, 2, 20221–20230 RSC.
| This journal is © The Royal Society of Chemistry 2019 |

