 Open Access Article
Manganese–cerium mixed oxides supported on rice husk based activated carbon with high sulfur tolerance for low-temperature selective catalytic reduction of nitrogen oxides with ammonia†
Yun Shu *,
Fan Zhang and
Hongchang Wang
State Key Laboratory of Environmental Criteria and Risk Assessment, Chinese Research Academy of Environmental Sciences, Beijing 100012, China. E-mail: shuyun@craes.org.cn; Tel: +86 10 84934516
First published on 5th August 2019
Abstract
A rice husk-derived activated carbon supported manganese–cerium mixed oxide catalyst (Mn–Ce/RAC) was prepared by an impregnation method and tested for the selective catalytic reduction of nitrogen oxides with ammonia (NH3-SCR). 5 wt% Mn–Ce/RAC catalyst showed the highest activity, yielding nearly 100% NOx conversion and N2 selectivity at 240 °C at a space velocity of 30![[thin space (1/6-em)]](https://www.rsc.org/images/entities/char_2009.gif) 000 h−1. Compared with commercial activated carbon supported manganese–cerium mixed oxide catalyst (Mn–Ce/SAC), a higher SCR performance with good SO2 tolerance could be observed in the tested temperature range over the Mn–Ce/RAC catalyst. The characterization results revealed that the Mn–Ce/RAC catalyst had a higher Mn4+/Mn3+ ratio, amount of chemisorbed oxygen and more Brønsted acid sites than the Mn–Ce/SAC catalyst. The XRD analysis indicated that Mn–Ce oxides were highly dispersed on the RAC support. These properties of Mn–Ce/RAC assisted the SCR reaction. Moreover, in situ DRIFTS results demonstrated that sulfate species formation on Mn–Ce/RAC was much less in the presence of SO2 than that of Mn–Ce/SAC, which might be ascribed to the reduced alkalinity of the catalyst by the presence of SiO2 in RAC.
000 h−1. Compared with commercial activated carbon supported manganese–cerium mixed oxide catalyst (Mn–Ce/SAC), a higher SCR performance with good SO2 tolerance could be observed in the tested temperature range over the Mn–Ce/RAC catalyst. The characterization results revealed that the Mn–Ce/RAC catalyst had a higher Mn4+/Mn3+ ratio, amount of chemisorbed oxygen and more Brønsted acid sites than the Mn–Ce/SAC catalyst. The XRD analysis indicated that Mn–Ce oxides were highly dispersed on the RAC support. These properties of Mn–Ce/RAC assisted the SCR reaction. Moreover, in situ DRIFTS results demonstrated that sulfate species formation on Mn–Ce/RAC was much less in the presence of SO2 than that of Mn–Ce/SAC, which might be ascribed to the reduced alkalinity of the catalyst by the presence of SiO2 in RAC.
Introduction
Nitrogen oxides (NOx) emitted from power plants and diesel engines are major air pollutants, which can result in acid rain, photochemical smog, and ozone destruction. Selective catalytic reduction (SCR) with NH3 is the most widely used technology for post-NOx removal, and V2O5–WO3(MoO3)/TiO2 has been commonly used with high catalytic activity at 300–400 °C.1–3 However, several shortcomings of V2O5-based catalysts still need to be addressed, including the toxicity of vanadium, SO2 oxidation to SO3, and the poor low-temperature SCR activity. Therefore, it is extremely desirable to develop environment-friendly non-vanadium-based catalysts with high catalytic activity, and high SO2-tolerance within low-temperature regions.On the basis of the good low-temperature activity and their inherent environmentally benign characters, Mn-based catalysts have been widely developed for SCR of NO with NH3.4–6 Unfortunately, Mn-based catalysts are very sensitive to the presence of SO2 in the feed gas, which can induce a severe deactivation.7,8 Based on its high oxygen storage capacity and unique redox properties, ceria has been investigated extensively, which is usually introduced as a promoter for enhancing SO2 resistance of Mn-based catalysts due to the interaction between MnOx and CeOx, leading to the inhibition of formation of ammonium sulfates and MnSO4 on the catalyst surface.9–14 Fan et al.13 reported that a strong synergistic effect existed in Mn–Ce/CeAPSO-34 catalyst, which showed outstanding SO2 tolerance and H2O resistance. Jin et al.14 studied the role of ceria in the improved resistance for a Ce-modified Mn/TiO2 catalyst. In their investigation, the introduction of Ce lessened the sulfation of the main active phase (MnOx) during low-temperature SCR processes in the presence of SO2. Nevertheless, it is still necessary to further improve the resistance of SO2 for Mn–Ce binary metal oxide catalysts.
Generally, supports play an important role in SCR reaction. Proper supports not only can provide a huge surface to disperse the active components and prevent the formation of large crystalline particles but can also affect the sulfur tolerance. Carbon materials (i.e., activated carbon (AC),15 activated coke16 and carbon fiber17) are widely used as supports for NH3-SCR reaction and exhibit a high NOx removal efficiency at low temperatures (100–250 °C). Zhu et al. reported that activated carbon supported vanadium oxide catalyst showed high activity in presence of SO2 at 180–250 °C due to formation of SO42−.15,18 In addition, SiO2 was proposed to be a structural promoter to enhance the SO2 resistance of catalyst.19–21 Liu et al.19 observed that the addition of SiO2 improved SCR performance of Ce/TiO2 catalyst. They reported that the introduction of SiO2 could weaken the alkalinity over the surface of Ce/TiO2–SiO2 catalyst, which resulted in sulfate not easily accumulating on the surface of the Ce/TiO2–SiO2 in comparison with the Ce/TiO2. From the research by Kobayashi et al.,20 the SO2 tolerance was found to be more excellent over vanadia loaded on TiO2–SiO2 than over that on pure TiO2, which was ascribed to the increased acidity of the former. However, it should be noted that the SiO2 precursors usually used were commercially made alkoxysilane compounds such as tetraethylorthosilicate, colloidal silica and tetramethylorthosilicate. Nakashima et al.22 reported that acute exposure to tetraethylorthosilicate can lead to death. Thus, there is a need to find a safer and less expensive silica source.
Rice husk is a major agriculture by-product in several parts of Asia, mainly in China and India. This biomass waste possesses unique properties, such as high SiO2 content, high porosity and large external surface area.23 In addition, biomass has proven to be a promising type of raw material for producing activated carbon with high adsorption capacity.24,25 These properties make the rice husk an idea biomass waste for use as an alternative silica source, a catalyst or a catalyst support for pollutant removal. Inspired by those mentioned points, it is speculated that rice husk might be a good option to be used as precursor for producing activated carbon, which could be used as supports for SCR processes and exhibit a good SO2 tolerance at low temperatures.
In this paper, activated carbon was prepared from rice husk and subsequently impregnated with MnOx and CeOx for SCR of NO with NH3. The attempt was to develop low-temperature deNOx catalyst having good SO2 tolerance. For comparison purposes, the catalytic activity of commercial activated carbon catalyst with the same active composition was investigated under the same working conditions.
Experimental
The rice husk of the most widely grown variety of rice in China was chosen for this study. After receiving, it was thoroughly washed to remove impurities and then dried at 110 °C for 24 h. After drying, the sample was cut in uniform lengths of ≤5 mm. The proximate and elemental analysis of raw rice husk was in Table S1 in ESI.† It could be found that the raw sample showed a higher volatile and low N and S content, and the heating value was about 15 MJ kg−1. It was an ideal renewable energy resource, with minor environmental pollution.Chemically activated carbon
A known mass of rice husk was immersed in 100 ml of activating agent which comprised of H3PO4 and H2O. The mixture was continuously stirred for 2 h, and then it was oven dried at 120 °C for 48 h. The activation of the mixture was performed in a fixed bed reactor. The reactor was heated to 800 °C at a heating rate of 5 °C min−1 and maintained for 2 h in N2 (200 ml min−1). Then, the sample was cooled down to room temperature under an N2 atmosphere. The resulting activated carbon sample was washed with NaOH solution, followed by distilled water until the wash water reached a pH of 6–7 to remove residual PO43−. The final activated carbon sample was dried and sieved to obtain a particle size range of 40–60 mesh.Catalyst
The chemically activated carbon was supported with Mn and Ce using impregnation methods, where Mn and Ce nitrates (Mn/Ce molar ratio, 2![[thin space (1/6-em)]](https://www.rsc.org/images/entities/char_2009.gif) :
:![[thin space (1/6-em)]](https://www.rsc.org/images/entities/char_2009.gif) 1) were dissolved in deionized water, and certain amount of the chemically activated carbon was added. The mixture of metal nitrates and carbon was heated and continuously stirred for 2 h. Then, the sample was dried for 12 h at 110 °C in a drying oven. After drying, the sample was calcined for 5 h at 500 °C in tubular furnace with heating rate of 10 °C min−1 under N2 atmosphere. Finally, the sample was cooled down to room temperature with protection of N2. Mn–Ce/activated carbon (with commercial activated carbon as the support) was also prepared through the same method for comparison. The commercial activated carbon made from sawdust was purchased from Sinopharm Chemical Reagent limited corporation. The resulting catalyst is denoted as Mn–Ce/XAC (X represents the initial raw material for the activated carbon preparation, X = R and S). For example, Mn–Ce/RAC and Mn–Ce/SAC indicate the rice husk-based activated carbon supported Mn–Ce catalyst and the sawdust-based activated carbon supported Mn–Ce catalyst, respectively.
1) were dissolved in deionized water, and certain amount of the chemically activated carbon was added. The mixture of metal nitrates and carbon was heated and continuously stirred for 2 h. Then, the sample was dried for 12 h at 110 °C in a drying oven. After drying, the sample was calcined for 5 h at 500 °C in tubular furnace with heating rate of 10 °C min−1 under N2 atmosphere. Finally, the sample was cooled down to room temperature with protection of N2. Mn–Ce/activated carbon (with commercial activated carbon as the support) was also prepared through the same method for comparison. The commercial activated carbon made from sawdust was purchased from Sinopharm Chemical Reagent limited corporation. The resulting catalyst is denoted as Mn–Ce/XAC (X represents the initial raw material for the activated carbon preparation, X = R and S). For example, Mn–Ce/RAC and Mn–Ce/SAC indicate the rice husk-based activated carbon supported Mn–Ce catalyst and the sawdust-based activated carbon supported Mn–Ce catalyst, respectively.
SCR activity measurements
NH3-SCR activity measurements were carried out in a fixed-bed quartz flow reactor (i.d. 9 mm) containing 0.5 g of catalyst. The reactor was electrically heated, which was described in detail in our previous study.26 The typical composition of the reactant gas was: 1000 ppm NO, 1000 ppm NH3, 3 vol% O2, 200 ppm SO2 (when needed), and N2 as the balance gas. The total flow rate was 500 ml min−1 (refers to 1 atm and 298 K) which corresponded to a gas hourly space velocity (GHSV) of 30![[thin space (1/6-em)]](https://www.rsc.org/images/entities/char_2009.gif) 000 h−1. Before entering the reactor, the reactant gases were mixed in a mixing tubing, but NH3 was fed directly into the reactor by passing the mixing tubing to avoid possible reaction between SO2 and NH3 before the catalyst bed. Water vapor was generated by passing N2 through a gas-wash bottle containing deionized water. The tubings of the reactor system were heated to prevent the formation and deposition of ammonium sulfate/bisulfate and ammonium nitrate. The NO, NO2, NH3, SO2 and N2O concentrations were measured online with a Fourier transform infrared (FTIR) analyzer system (GASMET DX-4000) produced by Gasmet Technologies, Inc. in Finland. The O2 concentrations were measured via an electrochemical gas analyser (Testo 340). The reaction system was kept for 1 h at each reaction temperature to reach a steady state before the analysis of the product was performed. The NOx conversion and N2 selectivity were calculated as follows:
000 h−1. Before entering the reactor, the reactant gases were mixed in a mixing tubing, but NH3 was fed directly into the reactor by passing the mixing tubing to avoid possible reaction between SO2 and NH3 before the catalyst bed. Water vapor was generated by passing N2 through a gas-wash bottle containing deionized water. The tubings of the reactor system were heated to prevent the formation and deposition of ammonium sulfate/bisulfate and ammonium nitrate. The NO, NO2, NH3, SO2 and N2O concentrations were measured online with a Fourier transform infrared (FTIR) analyzer system (GASMET DX-4000) produced by Gasmet Technologies, Inc. in Finland. The O2 concentrations were measured via an electrochemical gas analyser (Testo 340). The reaction system was kept for 1 h at each reaction temperature to reach a steady state before the analysis of the product was performed. The NOx conversion and N2 selectivity were calculated as follows:where [NOx] = [NO] + [NO2], [NOx]in and [NOx]out were the concentrations of NOx at the inlet and outlet of the tube, respectively. In order to confirm that the decrease of NOx was not caused by the adsorption of NOx, at the beginning of each experiment, the catalyst was purged with the reactant gas until there was no difference between the inlet and the outlet gas.
Catalyst characterization
The specific surface areas of the catalysts were measured by nitrogen adsorption using the Brunauer–Emmett–Teller (BET) method (Quadrasorb SI). Powder X-ray diffraction (XRD) measurements were carried out on a Rigaku D/MAX-2400 X-ray diffractometer with Cu Kα radiation. X-ray photoelectron spectroscopy (XPS) was implemented on a surface analysis system (Thermal ESCALAB 250) using Al Kα radiation. The C 1s line at 284.6 eV was considered as a reference for the binding energy calibration. The peak fitting was carried out using a XPSPEAK41 processing program. Temperature-programmed reduction (H2-TPR) was performed on a ChemBET PULSAR TPR/TPD instrument. Prior to TPR experiments, the catalysts were pretreated at 400 °C for 2 h under helium flow, then cooled down to room temperature. Finally, the reactor temperature was raised to 700 °C at a constant heating rate of 10 °C min−1 in a flow of H2 (5 vol%)/He. Temperature-programmed desorption (TPD) experiments of NH3 and SO2 were performed on the same ChemBET PULSAR TPR/TPD instrument. The experiment consisted of four stages: (i) degasification of the sample in He at 400 °C for 2 h, (ii) adsorption of NH3 (300 ppm SO2 + 3% O2) at room temperature for 1 h, (iii) isothermal desorption under He until no NH3 (SO2) was detected, and (iv) temperature-programmed desorption under He at 10 °C min−1 to 500 °C or 800 °C. In situ diffuse reflectance infrared Fourier transform spectroscopy (in situ DRIFTS) was performed on a FTIR spectrometer (Bruker Vertex 70) equipped with a high sensitivity MCT detector cooled by liquid N2. An approximately 12 mg sample was finely ground and pressed into a self-supported wafer. Mass flow controllers and a sample temperature controller were used to simulate the real reaction conditions. Prior to each experiment, the wafer was heated to 350 °C in N2 (99.999%) for 1 h and then cooled down to the desired reaction temperature. The background spectrum was collected in flowing N2 and automatically subtracted from the sample spectrum. The reaction conditions were controlled as follows: 500 ml min−1 total flow rate, 500 ppm NO, 500 ppm NH3, 3% O2, (100 ppm SO2 when used) and N2 balance. All spectra were recorded by accumulating 100 scans with a resolution of 4 cm−1.Results and discussion
Effect of the loading amounts of Mn–Ce on SCR activity
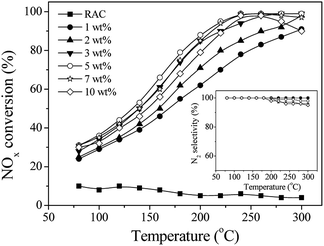
Fig. 1 displays NOx conversion and N2 selectivity at various temperatures for the Mn–Ce/RAC-catalyzed NH3-SCR reaction with varying Mn–Ce loadings. The SCR activity of the RAC were quite low in the whole temperature range, with NOx conversions less than 9%. After Mn–Ce oxide species were loaded onto the RAC, the NOx conversion of Mn–Ce/RAC was greater than 80% at 240 °C. It demonstrated that Mn–Ce based catalyst could exhibited high SCR activity at relatively low temperature range as the literatures reported.27 As the Mn–Ce loading increased from 1 wt% to 5 wt%, the NOx conversion improved gradually. At a Mn–Ce loading of 5 wt%, for example, the NOx conversion was 99.4% at 240 °C. Further increase of the Mn–Ce loading from 5 wt% to 10 wt% led to certain decline in NOx conversion at both low and high temperatures, which might be ascribed to aggregation of active component on the surface of RAC.27,28 All of the catalysts exhibited high N2 selectivity (>95%) across tested temperature ranges (as shown in inset of Fig. 1). The formation of N2O was less than 5 ppm. Since the 5 wt% Mn–Ce/RAC catalyst showed the highest SCR activity, all of the Mn–Ce/RAC catalysts that appeared below had a Mn–Ce loading of 5 wt%.Comparison with Mn–Ce/SAC catalyst
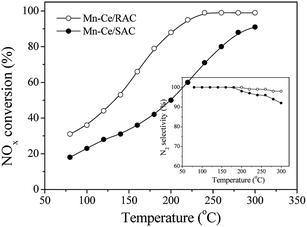
In order to test the effect of the support, the NOx conversion and N2 selectivity over Mn–Ce/RAC and Mn–Ce/SAC catalysts were compared, and the results are shown in Fig. 2. The active component loading and the experimental conditions were the same. The Mn–Ce/RAC catalyst showed a higher SCR activity in the whole temperature range than Mn–Ce/SAC, together with much better N2 selectivity. It indicated that the activity of Mn–Ce/RAC catalyst was significantly improved in comparison with Mn–Ce/SAC catalyst by taking the RAC as support.Effects of SO2 and H2O
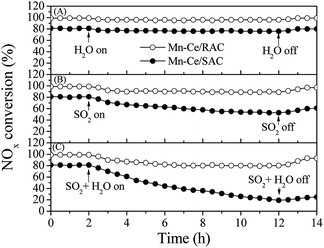
The emissions of SO2 and H2O are unavoidable in exhaust and flue gases, and the investigation of the impact of SO2 and H2O on the SCR activity of catalysts is therefore important. Fig. 3A shows the SCR activity over the Mn–Ce/RAC and Mn–Ce/SAC catalysts in the presence of 10 vol% H2O at 240 °C. When the steam was added to the reaction system, the NOx conversions of the two catalysts were little changed within 10 h. This suggested that individual H2O in the feed gas at 240 °C had nearly no influence on the SCR activity of Mn–Ce/RAC and Mn–Ce/SAC catalysts.Fig. 3B depicts the SO2 tolerance tests of the catalysts in the presence of 300 ppm SO2 at 240 °C. The NOx conversion over Mn–Ce/RAC decreased slightly after SO2 was added to the reaction gas, and it then reached a steady state. After switching SO2 off, the activity was restored. In contrast, in the case of Mn–Ce/SAC, the introduction of SO2 induced a dramatic drop from 80% to 63% after 10 h, and the NOx conversion of Mn–Ce/SAC only returned to 70%, far from the initial level. These results demonstrated that the Mn–Ce/RAC catalyst presented advantages in SO2 tolerance over the Mn–Ce/SAC catalyst. According to literatures,8,18 the deactivation of the catalyst caused by SO2 was related with the formation of (NH4)2SO4 or NH4HSO4, which deposited on the surface of catalyst and blocked the partial active sites.
The combined impact of SO2 and H2O on SCR activity were also investigated (Fig. 3C). The introduction of SO2 and H2O induced a 18% decrease in the NOx conversion over Mn–Ce/RAC. But the NOx conversion gradually recovered to 93% after shutting off the supply of SO2 and H2O. However, the conversion of NOx on Mn–Ce/SAC decreased quickly from 80% to 35% and barely recovered even though SO2 + H2O was eliminated. It indicated that there was a synergistic inhibition effect between SO2 and H2O in the SCR reaction. When SO2 and H2O were added simultaneously, water would make the formation of the ammonium sulfate species more rapid, resulting in a dramatic decrease in NOx conversion.29 It could be concluded from the above results that Mn–Ce/RAC were highly sulfur-tolerant and water-resistant, and RAC presented a positive role in the sulfur and water tolerance of the catalyst.
Characterization of supports and catalysts
| Sample | BET surface area (m2 g−1) | Total pore volume (ml g−1) | Average pore diameter (nm) |
|---|---|---|---|
| RAC | 291.6 | 0.18 | 2.79 |
| Mn–Ce/RAC | 249.5 | 0.13 | 3.87 |
| SAC | 382.9 | 0.24 | 2.14 |
| Mn–Ce/SAC | 265.8 | 0.14 | 2.51 |
| Catalyst | Surface atomic content (%) | Mn4+/Mn3+ | Ce3+/(Ce3+ + Ce4+) (%) | Oα/(Oα + Oβ) (%) | |||
|---|---|---|---|---|---|---|---|
| Mn | Ce | O | Si | ||||
| Mn–Ce/RAC | 11.2 | 4.2 | 48.5 | 5.1 | 3.35 | 40.5 | 48.5 |
| Mn–Ce/SAC | 8.7 | 3.8 | 44.2 | 0.9 | 2.07 | 20.9 | 32.6 |
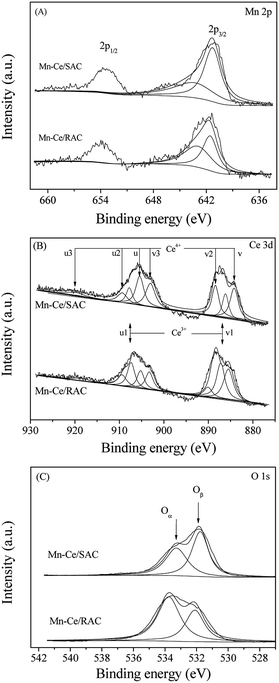
In Fig. 5A, two main peaks of Mn 2p3/2 and Mn 2p1/2 were observed in the binding energy range from 636 eV to 660 eV. The asymmetric Mn 2p3/2 peak confirmed the existence of mixed valence of manganese states. Thus, the Mn oxide states were further analyzed by deconvolution and curve fitting procedures. The binding energy for Mn4+ is approximately 643.1 eV, whereas the binding energy for Mn3+ is approximately 641.7 eV.37,38 As observed in Table 2, the Mn4+/Mn3+ ratio for Mn–Ce/RAC was higher than Mn–Ce/SAC. This suggested a higher average valence state of Mn ions on the surface of Mn–Ce/RAC than that on Mn–Ce/SAC. It is well known that Mn4+ species is more active than Mn3+ species, and the Mn4+ can enhance the NO to NO2 oxidation and as a result of this promoting the SCR reaction through the “fast SCR” pathway. Therefore, Mn–Ce/RAC exhibited higher NOx conversion than Mn–Ce/SAC, as shown in Fig. 2.
The Ce 3d XPS spectra of Mn–Ce/RAC and Mn–Ce/SAC catalysts (Fig. 5B) were fitted into two bands (u and v). The bands labeled u1 and v1 represent the 3d10 4f1 initial electronic state, corresponding to Ce3+, whereas the peaks labeled u, u2, u3, v, v2 and v3 represent the 3d10 4f0 state of Ce4+ ions.39 The intensities of Ce3+ characteristic peaks over Mn–Ce/RAC were more intense than those over Mn–Ce/SAC. The Ce3+ ratio, calculated by Ce3+/(Ce3+ + Ce4+), of Mn–Ce/RAC (40.5%) was higher than that of Mn–Ce/SAC (20.9%), as listed in Table 2. It indicated that Ce was in a partially reduced state on the surface of the Mn–Ce/RAC catalyst, which might be attributed to the presence of SiO2 in RAC.19 Some researchers have reported that the presence of Ce3+ could induce charge imbalance, more vacancies and unsaturated chemical bonds on the catalyst surface, and thus lead to the increase of surface chemisorbed oxygen.40,41
Fig. 5C reveals the fitted O 1s peaks for lattice oxygen O2− at 529.5–529.8 eV (denoted as Oβ) and chemisorbed oxygen at 531.0–531.4 eV (denoted as Oα), such as O22− and O− belonging to defect-oxide or hydroxyl-like group.42 As shown in Table 2, the Oα of Mn–Ce/RAC (48.5%) calculated by Oα/(Oα + Oβ) was much higher than that of Mn–Ce/SAC (32.6%). Surface chemisorbed oxygen (Oα) has been reported to be more active than lattice oxygen (Oβ) due to its higher mobility and plays an important role in oxidation reactions.43 Therefore, the higher Oα on Mn–Ce/RAC was beneficial for the NO oxidation to NO2 in the SCR reaction, and thereby facilitated the “fast SCR” reaction and enhanced deNOx efficiency. On the other hand, a larger amount of surface hydroxyl groups could act as Brønsted acid sites to enhance the NH3 adsorption.2,3 The enhancement of NH3 adsorption over the Mn–Ce/RAC catalyst would be discussed later.
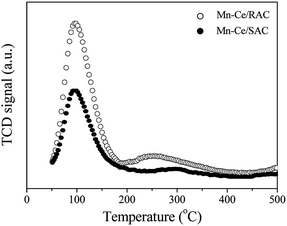
The NH3-TPD profiles of the Mn–Ce/RAC and Mn–Ce/SAC catalysts are shown in Fig. 7. The desorption peaks of these two catalysts appeared primarily in the temperature range of 50–150 °C (weak acid sites) and 220–360 °C (medium acid sites), respectively.45 It was found that the intensities of desorption peaks (weak and medium acid sites) on the surface of the Mn–Ce/RAC catalyst were obviously higher than those on the Mn–Ce/SAC catalyst, especially for the desorption peak belonging to weak acid sites. This result implied that the Mn–Ce/RAC catalyst had more acidic sites than the Mn–Ce/SAC catalyst. Many research showed that the surface acidity played a critical role in SCR reaction.4–6 Consequently, the increased acidic sites might represent one of the most important reasons for the higher catalytic activity of the Mn–Ce/RAC catalyst than that of the Mn–Ce/SAC catalyst.
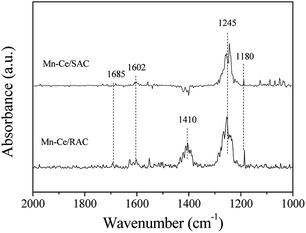
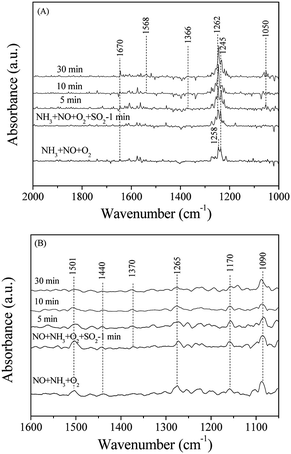
To understand deactivation mechanism of Mn–Ce/RAC and Mn–Ce/SAC by SO2 for the NH3-SCR, the DRIFTS spectra of catalysts in a flow of NH3 + NO + O2 before and after the addition of 100 ppm SO2 at 240 °C were recorded. Fig. 10A shows the DRIFTS spectra of Mn–Ce/SAC catalyst. When a mixture of NH3, NO, O2 and N2 were flowed over the catalyst for 30 min, the bands ascribed to ionic NH4+ (1670 cm−1) and coordinated NH3 (1245 cm−1) showed up.48,49 The band at 1258 cm−1 might be attributed to nitrate species.52 After SO2 was flowed for 5 min, the intensity of the band at 1258 cm−1 due to nitrate species increased obviously, and its position moved to high wavenumber at 1262 cm−1. According to the reported literature,53 we could assign the bands at 1262 (overlap band) and 1366 cm−1 to the deposited sulfate species. The band at 1050 cm−1 might be attributed to the perturbation of sulfate species (vs S–O) through reaction with NH3 to form ammonium sulfate.50 Moreover, HSO4− (1568 cm−1)54 was also found to increase with SO2 exposure time verifying the formation of NH4HSO4. These results suggested that the formation of (NH4)2SO4 and NH4HSO4 should be responsible for the deactivated observed for the Mn–Ce/SAC catalyst (as shown in Fig. 3), which was in agreement with a previous report.15,18 From Fig. 10B, when the SCR gases were directed into the reactor for 30 min, the adsorption peaks of NH4+ (1440 cm−1) and coordinated NH3 (1265 and 1170 cm−1) appeared on the surface of the Mn–Ce/RAC catalyst. Anionic nitrosyl NO− species have been observed by some researchers giving rise to absorption in the region of 1200–1000 cm−1.55,56 So the band at 1090 cm−1 could be assigned to anionic nitrosyl NO− species. Additional adsorbed species was also found, namely cis-N2O22− (1501 cm−1).57 After the addition of SO2, no obvious change was observed on Mn–Ce/RAC, except for that a weak adsorption peak linked to sulfate species (1370 cm−1) was detected after 5 min. These results demonstrated that the Mn–Ce/SAC catalyst exhibited significant adsorption of SO2 which leads to deactivation caused by (NH4)2SO4 and NH4HSO4 formation on the surface of the catalyst. Conversely, the Mn–Ce/RAC catalyst resulted in very minor formation of sulfate species after SO2 exposure, demonstrating an improved SO2 resistance of the catalyst. This was consistent with the Fourier transform infrared spectroscopy (FT-IR) results (Fig. S3 in ESI†) that there was little ammonium-sulfate salts deposited on the surface of the Mn–Ce/RAC catalyst compared to that of the Mn–Ce/SAC catalyst during the pretreatment with a flow of NO–NH3–O2–SO2–H2O.
Conclusions
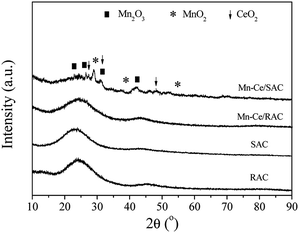
This work has evaluated rice husk-derived activated carbon impregnated with the Mn–Ce as a potential catalyst in the NH3-SCR. Mn–Ce loading enhanced the SCR performance of RAC, and 5 wt% was the optimum mass ratio for the Mn–Ce/RAC catalyst. In comparison with the Mn–Ce/SAC, the Mn–Ce/RAC had a high SCR performance and a good tolerance to SO2. The XRD analysis indicated that Mn–Ce was more dispersed on the surface of RAC support than SAC support. The high Mn4+/Mn3+ ratios, chemisorbed oxygen content and more Brønsted acid sites as well as the enhanced redox activity of the Mn–Ce/RAC catalyst improved its NH3-SCR activity. In situ DRIFTS results demonstrated that sulfate formation was suppressed on the surface of the RAC support, which might be the most significant reason that Mn–Ce/RAC maintained a high SCR activity in the presence of SO2. This study demonstrated that the rice husk might be a potential material for use as a low temperature SCR catalytic support instead of the commercial activated carbon.Conflicts of interest
There are no conflicts to declare.Acknowledgements
This work was supported by the National Key Research and Development Program of China (2017YFC0213000) and the National Natural Science Foundation of China (No. 21507119).References
- L. J. Alemany, F. Berti, G. Busca and G. Ramis, et al., Appl. Catal., B, 1996, 10, 299–311 CrossRef CAS.
- G. Busca, L. Lietti, G. Ramis and F. Berti, Appl. Catal., B, 1998, 18, 1–36 CrossRef CAS.
- M. Kobayashi and K. Miyoshi, Appl. Catal., B, 2007, 72, 253–261 CrossRef CAS.
- X. L. Tang, J. M. Hao, W. G. Xu and J. H. Li, Catal. Commun., 2007, 8, 329–334 CrossRef CAS.
- K. J. Lee, P. A. Kumar and M. S. Maqbool, et al., Appl. Catal., B, 2013, 142, 705–717 CrossRef.
- W. Tian, H. Yang, X. Fan and X. Zhang, J. Hazard. Mater., 2011, 188, 105–109 CrossRef CAS PubMed.
- W. S. Kijlstra, M. Biervliet, E. K. Poels and A. Bliek, Appl. Catal., B, 1998, 16, 327–337 CrossRef.
- J. A. Loiland and R. F. Lobo, J. Catal., 2014, 311, 412–423 CrossRef CAS.
- G. Qi and R. T. Yang, Chem. Commun., 2003, 7, 848–849 RSC.
- Z. Liu, Y. Yi, S. Zhang, T. Zhu, J. Zhu and J. Wang, Catal. Today, 2013, 216, 76–81 CrossRef CAS.
- Y. Wei, Y. Sun, W. Su and J. Liu, RSC Adv., 2015, 5, 26231–26235 RSC.
- X. Chen, P. Wang and P. Fang, et al., Fuel Process. Technol., 2017, 167, 221–228 CrossRef CAS.
- Y. Fan, W. Ling and B. Huang, et al., J. Ind. Eng. Chem., 2017, 56, 108–119 CrossRef CAS.
- R. Jin, Y. Liu and Y. Wang, et al., Appl. Catal., B, 2014, 148, 582–588 CrossRef.
- Z. P. Zhu, Z. Y. Liu, S. Liu and H. X. Niu, Appl. Catal., B, 2001, 30, 267–276 CrossRef CAS.
- P. Li, Q. Liu and Z. Liu, Chem. Eng. J., 2012, 181, 169–173 CrossRef.
- P. Lu, C. Li, G. Zeng, L. He, D. Peng, H. Cui, S. Li and Y. Zhai, Appl. Catal., B, 2010, 96, 157–161 CrossRef CAS.
- Z. P. Zhu, H. X. Niu, Z. Y. Liu and S. Liu, J. Catal., 2000, 195, 268–278 CrossRef CAS.
- C. Liu, L. Chen, J. H. Li and J. M. Hao, Environ. Sci. Technol., 2012, 46, 6182–6189 CrossRef CAS PubMed.
- M. Kobayashi, R. Kuma, S. Masaki and N. Sugishima, Appl. Catal., B, 2005, 60, 173–179 CrossRef CAS.
- Z. Liu, J. Tabora and R. Davis, J. Catal., 1994, 149, 117–126 CrossRef CAS.
- H. Nakashima, K. Omae, T. Takebayashi, C. Ishizuka and T. Uemura, J. Occup. Health, 1998, 40, 270–275 CrossRef CAS.
- N. Soltani, A. Bahrami, M. I. Pech-Canul and L. A. Gonzàlez, Chem. Eng. J., 2015, 264, 899–935 CrossRef CAS.
- T. C. Chandra, M. M. Mirna, Y. Sudaryanto and S. Ismadji, Chem. Eng. J., 2007, 127, 121–129 CrossRef CAS.
- K. Nuithitikul, S. Srikhun and S. Hirunpraditkoon, Bioresour. Technol., 2010, 207, 426–429 CrossRef PubMed.
- Y. Shu, H. Wang, J. Zhu and F. Zhang, Chem. Res. Chin. Univ., 2014, 30, 1005–1010 CrossRef CAS.
- W. Xu, Y. Yu, C. Zhang and H. He, Catal. Commun., 2008, 3, 1453–1457 CrossRef.
- B. Huang, R. Huang, D. Jin and D. Ye, Catal. Today, 2007, 126, 279–283 CrossRef CAS.
- R. Gao, D. Zhang, X. Liu, L. Shi, P. Maitarad and H. Li, Catal. Sci. Technol., 2013, 3, 191–199 RSC.
- D. K. Pappas, T. Boningari, P. Boolchand and P. G. Smirniotis, J. Catal., 2016, 334, 1–13 CrossRef CAS.
- Q. Yan, Y. Nie, R. Yang, Y. Cui and Q. Wang, Appl. Catal., A, 2017, 538, 37–50 CrossRef CAS.
- J. Muñiz, G. Marbán and A. B. Fuertes, Appl. Catal., B, 2000, 27, 27–36 CrossRef.
- Y. Liao, L. Jia, R. Chen, M. Sakuraib and H. Kameyamab, Appl. Catal., A, 2016, 522, 32–39 CrossRef CAS.
- Y. Xue, Y. Guo, Z. Zhang and G. Lu, et al., Appl. Surf. Sci., 2008, 255, 2591–2595 CrossRef CAS.
- N. Apostolescu, B. Geiger and K. Hizbullah, et al., Appl. Catal., B, 2006, 62, 104–114 CrossRef CAS.
- T. Pınar and Y. Sevil, Asia-Pac. J. Chem. Eng., 2019, 14, 2262–2276 CrossRef.
- D. A. Pena, B. S. Uphade and P. G. Smirniotis, J. Catal., 2004, 221, 421–431 CrossRef CAS.
- P. R. Ettireddy, N. Ettireddy, S. Mamedov, P. Boolchand and P. G. Smirniotis, Appl. Catal., B, 2007, 76, 123–134 CrossRef CAS.
- M. Romeo, K. Bak, J. E. Fallah, F. L. Normand and L. Hilaire, Surf. Interface Anal., 1993, 20, 508–512 CrossRef CAS.
- B. Reddy, M. Khan, A. Yamada, Y. Kobayashi and T. Loridant, J. Phys. Chem. B, 2003, 107, 5162–5167 CrossRef CAS.
- S. Yang, X. Zhu, W. P. Jiang, Z. P. Chen and Z. X. Wang, Appl. Surf. Sci., 2006, 252, 8499–8505 CrossRef CAS.
- J. C. Dupin, D. Gonbeau, P. Vinatier and A. Levasseur, Phys. Chem. Chem. Phys., 2000, 2, 1319–1324 RSC.
- J. Fang, X. Bi, D. Si, Z. Jiang and W. Huang, Appl. Surf. Sci., 2007, 253, 8952–8961 CrossRef CAS.
- P. Li, Y. Xin, Q. Li, Z. Wang, Z. Zhang and L. Zheng, Environ. Sci. Technol., 2012, 46, 9600–9605 CrossRef CAS PubMed.
- V. Vishwanathan, J. Ki-Won, K. Jae-Woo and R. Hyun-Seog, Appl. Catal., A, 2004, 276, 251–255 CrossRef CAS.
- J. H. Li, Y. Q. Zhu, R. Ke and J. M. Hao, Appl. Catal., B, 2008, 208, 202–213 CrossRef.
- Y. X. Chen, Y. Jiang, W. Z. Li, R. C. Jin, S. Z. Tang and W. B. Hu, Catal. Today, 1999, 50, 39–47 CrossRef CAS.
- Z. B. Wu, B. Q. Jiang, Y. Liu, H. Q. Wang and R. B. Jin, Environ. Sci. Technol., 2007, 41, 5812–5817 CrossRef CAS PubMed.
- G. Ramis, Y. Li, G. Busca, M. Turco, E. Kotur and R. J. Willey, J. Catal., 1995, 157, 523–535 CrossRef CAS.
- Z. Tao, Q. Feng and H. Chang, Catal. Commun., 2017, 100, 117–120 CrossRef.
- P. Yue, L. Cai and Z. Xue, Appl. Catal., B, 2013, 140, 276–282 Search PubMed.
- G. Qi, R. T. Yang and R. Chang, Appl. Catal., B, 2004, 51, 93–106 CrossRef CAS.
- B. Q. Jiang, Z. B. Wu, Y. Liu, S. C. Lee and W. K. Ho, J. Phys. Chem. C, 2010, 114, 4961–4966 CrossRef CAS.
- S. M. Muhammad, K. P. Anil and P. H. Heon, Appl. Catal., B, 2014, 152, 28–37 Search PubMed.
- J. Liam, Y. Qing and L. Wan, Appl. Catal., B, 2017, 206, 203–215 CrossRef.
- K. Hadjiivanov and H. Knözinger, Phys. Chem. Chem. Phys., 2000, 2, 2803–2806 RSC.
- M. Kantcheva, J. Catal., 2001, 204, 479–494 CrossRef CAS.
Footnote |
| † Electronic supplementary information (ESI) available: Characteristics of raw biomasses, Raman spectra of different samples, Si 2p XPS spectra of Mn–Ce/RAC and Mn–Ce/SAC catalysts and FT-IR spectra of Mn–Ce/RAC and Mn–Ce/SAC catalysts before and after pretreatment with a flow of 800 ppm NO-800 ppm NH3-3% O2-300 ppm SO2-10 vol% H2O are shown. See DOI: 10.1039/c9ra03937f |
| This journal is © The Royal Society of Chemistry 2019 |


