 Open Access Article
A bio-inspired strategy for the synthesis of zinc oxide nanoparticles (ZnO NPs) using the cell extract of cyanobacterium Nostoc sp. EA03: from biological function to toxicity evaluation
Mojgan Ebadia,
Mohammad Reza Zolfagharia,
Seyyed Soheil Aghaeia,
Mohsen Zargara,
Morvarid Shafieib,
Hossein Shahbani Zahiric and
Kambiz Akbari Noghabi *c
*c
aDepartment of Microbiology, Islamic Azad University, Qom Branch, Qom, Iran
bMicrobiology Research Center (MRC), Pasteur Institute of Iran, Tehran, Iran
cDepartment of Energy & Environmental Biotechnology, National Institute of Genetic Engineering and Biotechnology (NIGEB), P. O. Box 14155-6343, Tehran, Iran. E-mail: Akbari@nigeb.ac.ir; Fax: +98-21-44787399; Tel: +98-21-44787352
First published on 29th July 2019
Abstract
Cyanobacteria, as one of the largest groups of phototrophic bacteria, have a high potential as an excellent source of fine chemicals and bioactive compounds, including lipid-like compounds, amino acid derivatives, proteins, and pigments. This study aimed to synthesize ZnO nanoparticles using the cell extract of the cyanobacterium Nostoc sp. EA03 (CEN-ZnO NPs) through a rapid and eco-friendly approach. The biosynthesized nanoparticles, CEN-ZnO NPs, were characterized by UV-Vis spectroscopy, X-ray diffraction (XRD), zeta potential measurement, differential scanning calorimetry (DSC)/thermogravimetric analysis (TGA), FTIR, SEM, TEM, and EDX spectroscopy. The UV-Vis spectrum showed an absorption peak at 370 nm. The star-shaped CEN-ZnO NPs, as observed in the TEM and SEM images, had an average diameter of 50–80 nm. MIC and MBC values for E. coli, P. aeruginosa and S. aureus, were determined to be, respectively, 2000, 2000, and 64 μg ml−1, and 2500, 2500 and 128 μg ml−1. Further analysis through confocal laser scanning microscopy (CLSM) provided the observable confirmation that the CEN-ZnO NPs stunted the bacterial growth, preventing the formation of exopolysaccharides. The AFM analysis of surface topography of bacterial biofilm samples treated with CEN-ZnO NPs showed a rugged topography in some parts of the biofilm surface, indicating the destruction of biofilms. In contrast, in the untreated control samples, the structured biofilms were flat and prominent. MTT assay indicated that CEN-ZnO NPs had less cytotoxicity on the MRC-5 lung fibroblast cells compared with the cancerous treated A549 cells. As the concentration of the CEN-ZnO NPs increased, the amount of ROS produced in the tested bacterial strains also increased. Analyzing the data obtained from flow cytometry showed that the higher concentrations of CEN-ZnO NPs lead to a reduction in the viability of P. aeruginosa PAO1, E. coli and S. aureus. The biosynthesized ZnO nanoparticles using Nostoc cell extracts exhibited different attributes, inspiring enough to be considered for further investigation.
1. Introduction
Nanoparticles (NPs) are particles with one dimension ranging from 1 to 100 nanometers. They exhibit an enhanced catalytic reactivity, thermal conductivity, non-linear optical performance, and chemical steadiness owing to their large surface area to volume ratio.1 Nano materials are known as the miracles of modern medicine.2 Metallic nanoparticles have different physical and chemical properties due to their wide surface ratio, while their bulk forms may not have these features.3 The synthesis of nanoparticles (NPs) using plant extracts, bacteria, fungi, algae, etc., recognized as green technology, is the biocompatible, cost-effective and safe approach.4 The use of green and eco-friendly approaches for the synthesis of NPs has allowed them to develop for use in food, space, consumer healthcare, and the cosmetic industry. It has also vastly improved our understanding of their role in the control of disease and healthcare-associated infections in recent years.5 Various types of inorganic metal oxides have been synthesized and used in recent studies like TiO2, CuO, and ZnO. Of all these metal oxides, ZnO NPs is of greatest interest, because their production is not expensive and easy to prepare safely. Zinc oxide (ZnO) is an n-type semiconducting metal oxide and has attracted significant attention in the past three years due to its wide range of applicability in the field of electronics, optics, and biomedical systems. US FDA has enlisted ZnO as GRAS (generally recognized as safe) metal oxide.6,7The presence of bioactive compounds in plants, algae, and microorganisms has made them a good candidate for the synthesis of nanoparticles (NPs).8 Cyanobacteria as a group of ancient and abundant microorganisms with prokaryotic cell structures have the capability of carbon dioxide-dependent photosynthesis.9 Among microorganisms, cyanobacteria are of great interest in NP synthesis, as they are a potential source of novel metabolites that have great importance from a biotechnological and industrial point of view.9 It has shown that they can utilize as a good source with biological features for the synthesis of gold (Au), silver (Ag), platinum (Pt), and palladium (Pd) nanoparticles.10 The genus Nostoc is a valuable source of a wide spectrum of secondary metabolites, such as antioxidant enzymes, phycobiliproteins, vitamins, and phenolic compounds that have many uses as anticancer, anti-HIV, antimalarial, antifungal, and/or antimicrobial drugs11–13. Nostoc cell extract with a rich source of materials such as amino functional group, carboxyl, and hydroxyl, can be used as a metal oxide reducing and capping agents for NPs biosynthesis.14 Here, the green synthesis of zinc oxide nanoparticles was achieved using the cell extract of an indigenous cyanobacterial strain, Nostoc sp. EA03, in the first study of its kind. In this regard, the present study attempted to address the issues listed below: (1) isolation and characterization of a local cyanobacterial strain, (2) preparation of the cell extracts of selected cyanobacterial strain, Nostoc sp. EA03, (3) synthesis of ZnO NPs using the cell extract of Nostoc sp. EA03, (4) characterization of the CEN-ZnO NPs, (5) assessment of the antibacterial, anti-biofilm and antifungal activities of different concentrations of CEN-ZnO NPs against three important clinical bacterial isolates including E. coli 25922, P. aeruginosa PAO1, and S. aureus 25923, (6) in vitro analysis of cytotoxic effect of CEN-ZnO NPs on human lung fibroblast cells MRC-5 and the cancerous human lung alveolar epithelial cells A549, (7) the measurement of reactive oxygen species (ROS) levels in tested bacterial cells after exposure to different concentrations of CEN-ZnO.
2. Materials and methods
2.1. Materials and strains
Zinc acetate dehydrate (≥98% Zn (CH3COO)2·2H2O) and sodium hydroxide (≥98% NaOH) were purchased from Sigma-Aldrich, Australia. The clinical bacterial strains including E. coli ATCC 25922, P. aeruginosa PAO1, and S. aureus ATCC 25923 have received donations from Pasteur Institute of Iran.2.2. Sampling, isolation, and molecular identification of cyanobacterial strain
To isolate the cyanobacterial strain, sampling was carried out independently from the aquatic environments including lakes, rivers in Alborz province (Iran). The samples were quickly transferred to the laboratory in suitable conditions. Detail regarding isolation and identification of the cyanobacterial strain was performed as described earlier.15–182.3. Biomass collection
The selected cyanobacterial strain was grown in laboratory condition in 2000 ml Erlenmeyer flasks containing 400 ml BG11 medium and stirred daily, with continuous illumination (a light intensity of 2000–3000 1×), at a temperature of 28 °C and 65% humidity for 10–12 days to collect the bacterial biomass. The cyanobacterial cells were collected in the late logarithmic phase by centrifugation at 5000 rpm/15 min and then washed two times with deionized water until all the medium debris removed. The collected biomass was used to obtain the cell extracts.2.4. Preparation of cyanobacterial cell extracts
The biomass was collected and dried in the oven at 45 °C (to reach a constant weight) for 12 hours. In the next step, the dried biomass was crushed by a sterile mortar until it was smooth and uniform. The biomass powder was stored in a vial at 4 °C for further use. To obtain the cell extract, 1 g of dried biomass was dissolved in 50 ml of deionized water using a stirrer at 60 °C for 15 min. The solution was filtered through Whatman no. 41 filter paper and the bacterial cell extract was obtained. The cell extract was kept at 4 °C for the subsequent steps.2.5. Gas chromatography-mass spectroscopy (GC-MS) analysis
The GC-MS analysis of the cyanobacterial cell extract was performed using a Scion 436-GC Bruker system and Gas chromatograph interfaced to a mass spectrometer (GC-MS) equipped with a BR-5MS (5% diphenyl/95% dimethyl polysiloxane) column, 30 m × 0.25 mm ID × 0.25 μm df. The defined conditions for GC-MS detection was carried out as described earlier.192.6. Synthesis of CEN-ZnO NPs and optimization
For the synthesis of CEN-ZnO NPs, 1000 μl of cell extract was added drop by drop to 50 ml zinc acetate dehydrate (Zn (CH3COO)2·2H2O, 0.02 M) through constant stirring using a magnetic stirrer. After 10 min of stirring, 0.1 M NaOH was added drop-wise to the constantly stirred solution until a faded white solution appeared (the color of the reaction mixture changes from green to white). The resultant faded white solution was maintained under vigorous stirring for 2 h followed by centrifugation at 5000 rpm/15 min. The pellets were then washed with Milli-Q water three times and dried in a vacuum oven at 60 °C for 12 h. To optimize the synthesis of CEN-ZnO NPs, a set of experiments was designed at different pH ranges and different concentrations of cell extract, separately. The pH of the reaction mixture was adjusted in the range of 7–9 by adding 0.1 M NaOH, and different concentrations of the cell extract (1000–3000 μl) were used in the reaction mixture. The dried powder material was kept in an airtight microtube at room temperature for subsequent analysis.2.7. Characterization of the synthesized CEN-ZnO NPs
![[thin space (1/6-em)]](https://www.rsc.org/images/entities/char_2009.gif) cos
cos![[thin space (1/6-em)]](https://www.rsc.org/images/entities/char_2009.gif) θ. Here, D is the crystalline domain diameter of ZnO NPs, λ is the wavelength of the X-ray source used (1.541 Å), and B is the full width at half maximum of the diffraction peak.
θ. Here, D is the crystalline domain diameter of ZnO NPs, λ is the wavelength of the X-ray source used (1.541 Å), and B is the full width at half maximum of the diffraction peak.2.8. Evaluation of antibacterial activity of biosynthesized CEN-ZnO NPs (MIC and MBC values)
Three clinical bacterial strains were cultivated in Blood agar and Mueller–Hinton broth (MHB) and stored at −70 °C in 30% glycerol. The MIC values were evaluated by the broth microdilution method as recommended by CLSI.20 The MIC of CEN-ZnO NPs was determined against Gram-positive (S. aureus ATCC 25923) and Gram-negative bacteria (P. aeruginosa PAO1 and E. coli 25922) by 96-well microtiter assay. Briefly, 100 μl of Mueller–Hinton broth with CEN-ZnO NPs at different concentrations (i.e., 4, 8, 16, 32, 64, 128, 256, 512, 1000, and 2500 μg ml−1) was added. Then, 5 μl of microbial suspension (1 × 10⁸ CFU ml−1) was added to each well. The plates were incubated at 37 °C for 24 h. Positive and negative controls were included as well. Following incubation, the MIC values were listed for each bacterial strain. The minimum concentration of samples that showed no visible growth was defined as MIC. Aliquots of 100 μl from all tubes with no visible bacterial growth were seeded on MHA plates without CEN-ZnO NPs. The lowest concentration of samples that killed all the initial bacterial inoculum was defined as MBC.2.9. Biofilm formation
In this experiment, a flat-bottomed 96-well cell culture microtiter plate was used. Bacterial inoculum concentrations were used to form biofilm by P. aeruginosa PAO1, E. coli 25922, and S. aureus 25923. Using 24 hours bacterial culture, the suspension was adjusted to McFarland standard 0.5 (1 × 10⁸ CFU ml−1) in TSB supplemented with 0.2% glucose. Hundred microliters of each suspension were inoculated into each well. The test was performed using two replicates for each inoculum concentration. The microplates were incubated at 37 °C for 20 h.2.10. Assessment of bacterial viability by flow cytometry
The bacterial cells including P. aeruginosa PAO1, E. coli ATCC 25922, and S. aureus ATCC 25923 were selected to determine the cell viability and internalization after exposure to the biosynthesized CEN-ZnO NPs by flow cytometry. Briefly, for cell viability assessment, afresh grown suspensions of the bacterial strains (1 × 10⁸ CFU ml−1) were treated with increasing concentrations of CEN-ZnO NPs (500, 1500, and 2500 μg ml−1 for E. coli and P. aeruginosa and 16, 32, and 64 μg ml−1 for S. aureus) at 37 °C under shaking condition (110 rpm) in a shaker incubator for 20 h. The bacterial viability was assessed using a flow cytometer BD FACS Calibur (BD Biosciences, San Jose, CA, USA) equipped with an argon laser device (excitation at 488 nm, emission 530 nm), and the flow cytometric graphs drawn with the FLOWJO 10.4.2 software that was made available on https://www.flowjo.com/solutions/. For laser calibration purpose and gating selection, unstained and single-stained FDA or PI bacteria were also assessed. The setup procedure for flow cytometry analysis was designed as described elsewhere follows: a fluorescein diacetate (FDA) (Sigma Chemicals F7378) stock solution was prepared by dissolving 10 mg FDA in 10 ml acetone and stored in the dark at −20 °C until further use. A working solution was prepared by mixing 10 μl of stock solution with 2.5 ml of distilled water (this solution is stable for only 20 min and should, therefore, be prepared freshly). The working solution was added to each reaction and kept at room temperature for 15 min in dark condition. Unstained samples were used for light scatter gating, and the control was the sample without CEN-ZnO NP treatment.2.11. Cell culture and cytotoxicity assay (in vitro)
The human lung fibroblast cell line MRC-5 and the cancerous human lung alveolar epithelial cell line A549 were kindly provided by the cell bank of Pasture Institute of Iran and used as in vitro models of normal and cancerous lung cell lines, respectively. They were grown in RPMI/DMEM culture medium, respectively, containing 10% fetal bovine serum in a 5% CO2 atmosphere and a relative humidity of 90% at 37 °C. The cultured cells were treated with different concentrations of ZnO NPs (10, 50, 100, and 200 μg ml−1). The viability of the cells treated with CEN-ZnO NPs was examined by the MTT test. The percentage of cell viability was assessed using the MTT assay using the following protocol. In brief, the cells (1 × 10⁴) were seeded in 96-well culture plates and allowed to adhere for 24 h under a high-humidity environment with 5% CO2 and 95% O2 atmosphere at 37 °C. The cells were then exposed to various concentrations (10–200 μg ml−1) of CEN-ZnO NPs for 24 h. After exposure, 10 μl of MTT stock solution (5 mg MTT in 1 ml 1× PBS) was added and the plate incubated for 4 h at 37 °C. Afterward, the solution was removed, and isopropanol added to the cells to create purple crystal formazan. To better dissolve the MTT sediment, the plate was placed on a shaker for 15 minutes. Then, the concentration of the dissolved material in isopropanol was calculated using an ELISA reader (STAT FAX 2100, USA) at a wavelength of 545 nm. The wells with more cells have higher optical density (OD) than the well with lesser cells. Therefore, the following equation was used to determine the wells with more cells and compared with the control sample.| Viability% = 100 − toxicity% |
2.12. ROS level analysis
The ROS level was assayed by a fluorimetric assay using 2′,7′-dichlorofluorescin diacetate (DCFHDA; Sigma). The bacterial cells were treated with different concentrations of CEN-ZnO NPs (500, 1000, 1500, and 2500 μg ml−1 for E. coli and P. aeruginosa and 8, 16, 32, and 64 μg ml−1 for S. aureus) and incubated with DCFH-DA (10 mM) for 30–60 min at 37 °C and then centrifuged at 4000 rpm. Subsequently, the cells were washed with PBS. The conversion of DCFH to dichlorofluorescein (DCF) was monitored using a fluorescence spectrophotometer with excitation and emission wavelengths at 480 and 520 nm, respectively.3. Results
3.1. Identification of the selected cyanobacterial isolate
Light microscopy and SEM revealed the isolation, purity, and morphology of the cyanobacterial strain. The selected cyanobacterial isolate forms filamentous structures and is straight or curved to some extent. Molecular analysis of 16S rRNA gene sequences of the strains disclosed that the selected cyanobacterial isolate belongs to the genus of Nostoc. The cyanobacterial strain was identified and tentatively designated as Nostoc sp. EA03 and the sequence (1260 bp) deposited in GeneBank through the accession number of KY947487.1 (Fig. 1a–c).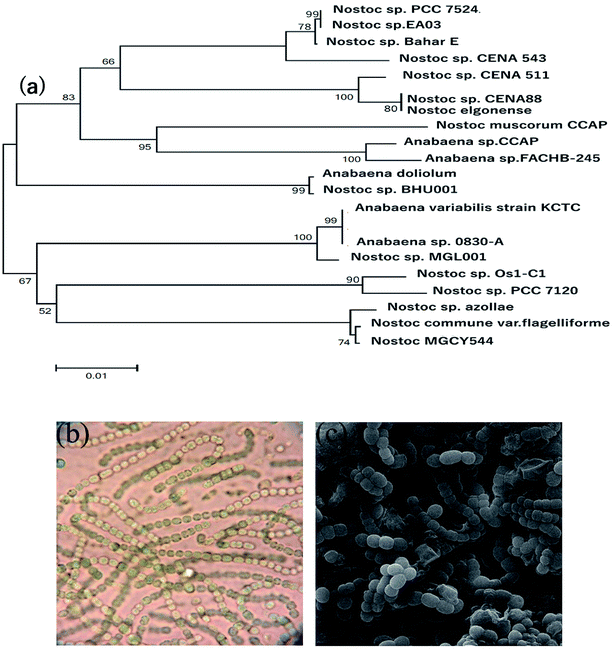 | ||
| Fig. 1 (a) Phylogenetic tree of the strains Nostoc sp. EA03, (b) illustration of the light microscope, (c) scanning electron microscopy (SEM) image of Nostoc sp. EA03. | ||
3.2. GC-MS analysis of cyanobacterial cell extract
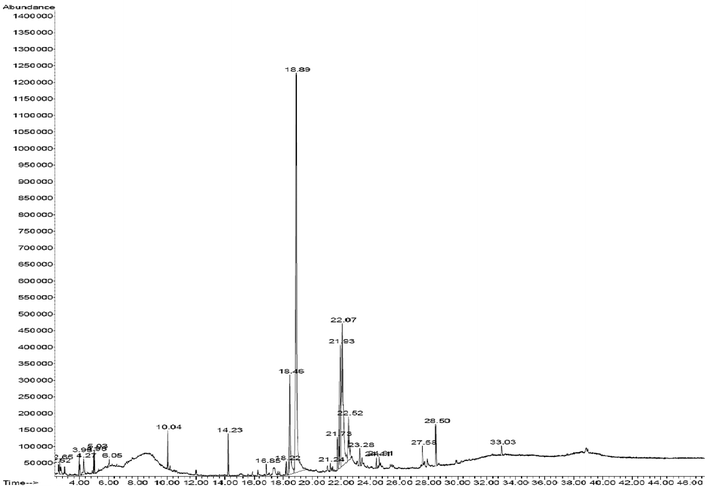
GC-MS chromatogram of methanolic extract of Nostoc sp. EA03 along with their retention time (RT) is shown in Table 1. The major components present in the methanol extract of Nostoc sp. EA03 along with the molecular formula, molecular weight, and peak area are presented in Table 1 and Fig. 2. The GC-MS chromatogram of methanolic extract of Nostoc sp. EA03 cell extract showed the presence of several active principle compounds. Fifteen compounds were identified in the methanolic extract of Nostoc sp. EA03 cells. The main compounds were n-hexadecanoic acid (39.76%), 9-octadecenoic acid (19.72%), octadecadienoic acid (8.67%), hexadecenoic acid (8.11%), octadecanoic acid (4.11%), benzenedicarboxylic acid (2.25%), heptadecane (2.07%), phytol (1.73%), hexadecane (0.77%), and triphenylphosphine oxide (1.21%). Therefore, fatty acids, palmitic acid, and phytol could be the likely candidates elaborated in the capping ZnO at the nanoscale, besides proteins and other ancillary phytochemicals, which needs to be determined in further studies. The existence of algal metabolite hexadecanoic acid (palmitic acid), as a stable and abundant molecule in the cyanobacterial cell extract, can form a dense coating on the surface of the nanoparticles, enhancing its hydrophobic properties.| No | RT | Name of the compound (library NIST) | Peak area% | Molecular formula | Compound nature | Activity |
|---|---|---|---|---|---|---|
| 1 | 3.95 | Dodecanoyl chloride | 1.05 | C12H23CIO | Saturated fatty acid | No activity reported |
| 2 | 18.89 | n-Hexadecanoic acid | 39.76 | C16H32O2 | Palmitic acid | Antiandrogenic, antioxidant, |
| 3 | 10.04 | Butylated hydroxy toluene | 1.81 | C15H24O | Lipophilic | Antioxidant |
| 4 | 14.23 | Heptadecane | 2.07 | C17H36 | Alkane | Antioxidant |
| 5 | 18.46 | Hexadecenoic acid | 8.11 | C18H36O2 | Palmitic acid | Antibacterial |
| 6 | 21.73 | Phytol | 1.73 | C20H40O | Diterpene | Antimicrobial, anticancer, anti-inflammatory |
| 7 | 21.93 | 9,12-Octadecadienoic acid | 8.67 | C20H38O2 | Oleic acid | Anti-inflammatory, cancer preventive, flavor dermatitigenic |
| 8 | 22.07 | Octadecadienoic acid | 19.72 | CH3(CH2)16COOH | Saturated fatty acid | Anticancer |
| Oleic acid | ||||||
| 9 | 27.58 | Triphenylphosphine oxide | 1.21 | (C6H5)3PO | Organophosphorus | No activity reported |
| 10 | 28.50 | Benzendicarboxylic acid | 2.25 | C6H4(CO2H)2 | Phthalic acid | Antibacterial, antioxidant |
3.3. Biosynthesis of CEN-ZnO NPs and optimization
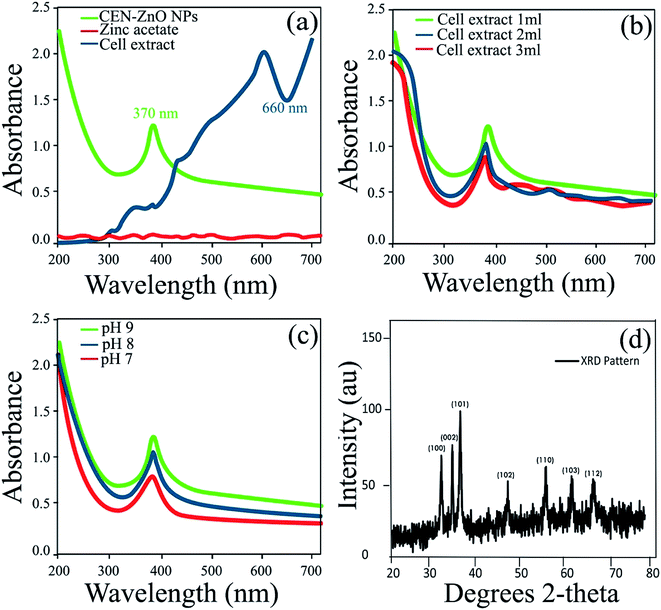
The cell extract of Nostoc sp. EA03 was added to an aqueous zinc acetate solution, resulting in a change in color from dark green to white (Fig. 3a–d). The UV-Vis absorption spectra of the biosynthesized CEN-ZnO NPs have shown in Fig. 4a. As illustrated, the surface plasmon resonance (SPR) band centered at 370 nm confirms the formation of ZnO NPs in the solution, whereas no absorption band was determined for zinc acetate and the cell extract at the same region. Similar to the result obtained in our study, Jayaseelan et al.25 observed a sharp peak in the 374 nm region as a result of ZnONPs synthesis using A. hydrophila biomass. Also, our results were completely consistent with a previous report by Singh et al.26 that a similar pattern of peaks obtained from the synthesized zinc oxide nanoparticles using cyanobacterium Anabaena strain L3. The effect of pH and cell extract concentration on the UV absorption pattern of CEN-ZnO NPs was also checked. The results showed different concentration of the characteristic band of ZnO NRs at 370 nm as a function of cell extract concentration without any change in the peak wavelength. The maximum production of CEN-ZnO NPs occurred when the final concentration of the cell extract in the reaction mixture was 1 μl (Fig. 4b). The same investigation on the effect of pH on the yield of CNE-ZnO NPs also showed that the maximum production of ZnO NPs occurred at pH 9, while other pH values showed lower production of CEN-ZnO NPs, as represented in Fig. 4c. Since the synthesis was carried out at room temperature (lack of high-temperature and alkaline requirements), this study appeared to be a significant method for eco-friendly synthesis of ZnO NPs. Based on the results, the amount of fatty acids, especially palmitic acid, is being present in more than the other metabolites in the cell extract. It is therefore suggested that the palmitic acid play an important role as a reducing agent during the green synthesis of the zinc oxide nanoparticles.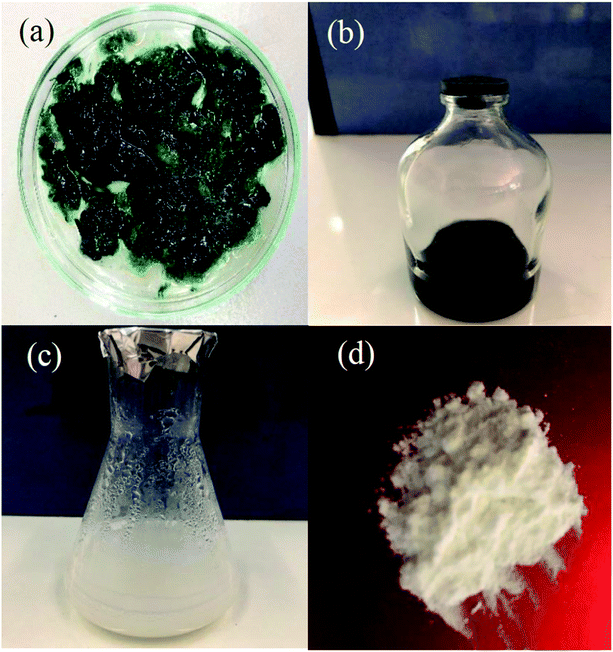 | ||
| Fig. 3 (a) The biomass of Nostoc sp. EA03; (b) purified cell extract; (c) CEN-ZnO NRs; (d) CEN-ZnO powder. | ||
3.4. Characterization of CEN-ZnO NPs
![[double bond, length as m-dash]](https://www.rsc.org/images/entities/char_e001.gif) O stretching) and 1550 cm−1 (amide II, C–N stretching and N–H deformation). The peak at 1386.49 cm−1 represents the N–O functional group. The high intensity band at ∼547.38 cm−1 is the result of the presence of the oxygen and zinc bands. A peak at 1651 cm−1 in the biosynthesized CEN-ZnO NPs, by Nostoc sp. EA03, is as a result of amide group that is characteristic of the protein. The peak in the region of 1206 cm−1 is due to the presence of the C–O functional group. The analysis of cyanobacterial cell extract showed an absorption peak at 1626.96 cm−1 that may correspond to free C
O stretching) and 1550 cm−1 (amide II, C–N stretching and N–H deformation). The peak at 1386.49 cm−1 represents the N–O functional group. The high intensity band at ∼547.38 cm−1 is the result of the presence of the oxygen and zinc bands. A peak at 1651 cm−1 in the biosynthesized CEN-ZnO NPs, by Nostoc sp. EA03, is as a result of amide group that is characteristic of the protein. The peak in the region of 1206 cm−1 is due to the presence of the C–O functional group. The analysis of cyanobacterial cell extract showed an absorption peak at 1626.96 cm−1 that may correspond to free C![[double bond, length as m-dash]](https://www.rsc.org/images/entities/char_e001.gif) O groups, while in CEN-ZnONPs, the absorption peak in the region of 1513 cm−1 resulted from the presence of carboxylate group (COO−). An absorption peak at the region of 2962.78 cm−1 indicates the presence of the –C–H stretches of the alkyl (methyl) group. For all doped and undoped ZnO samples the absorption peaks in the range of 400–700 cm−1 could be assigned to the ZnO stretching modes. The presence of absorption peaks in the region of 416.14 and 489.98 cm−1 in the CEN-ZnONPs sample represents the ZnO core, while this peak was not observed in cellular extracts and unalloyed ZnO. The absorption peak at 1626 cm−1 confirms the presence of C
O groups, while in CEN-ZnONPs, the absorption peak in the region of 1513 cm−1 resulted from the presence of carboxylate group (COO−). An absorption peak at the region of 2962.78 cm−1 indicates the presence of the –C–H stretches of the alkyl (methyl) group. For all doped and undoped ZnO samples the absorption peaks in the range of 400–700 cm−1 could be assigned to the ZnO stretching modes. The presence of absorption peaks in the region of 416.14 and 489.98 cm−1 in the CEN-ZnONPs sample represents the ZnO core, while this peak was not observed in cellular extracts and unalloyed ZnO. The absorption peak at 1626 cm−1 confirms the presence of C![[double bond, length as m-dash]](https://www.rsc.org/images/entities/char_e001.gif) O groups in the cell extract. The absorption peaks in the region 1352 cm−1 and 1044 cm−1 in the cell extract, respectively, indicates the presence of C
O groups in the cell extract. The absorption peaks in the region 1352 cm−1 and 1044 cm−1 in the cell extract, respectively, indicates the presence of C![[double bond, length as m-dash]](https://www.rsc.org/images/entities/char_e001.gif) C and C–O. An absorption peak at 1030 cm−1 in CEN-ZnONPs may correspond to the presence of C–O. The peak at 3257 cm−1 confirms the presence of the hydroxyl (O–H) groups. It can therefore be supposed that the nanoparticle is synthesized and stabilized by replacing the acids with methyl and hydroxyl groups.
C and C–O. An absorption peak at 1030 cm−1 in CEN-ZnONPs may correspond to the presence of C–O. The peak at 3257 cm−1 confirms the presence of the hydroxyl (O–H) groups. It can therefore be supposed that the nanoparticle is synthesized and stabilized by replacing the acids with methyl and hydroxyl groups.
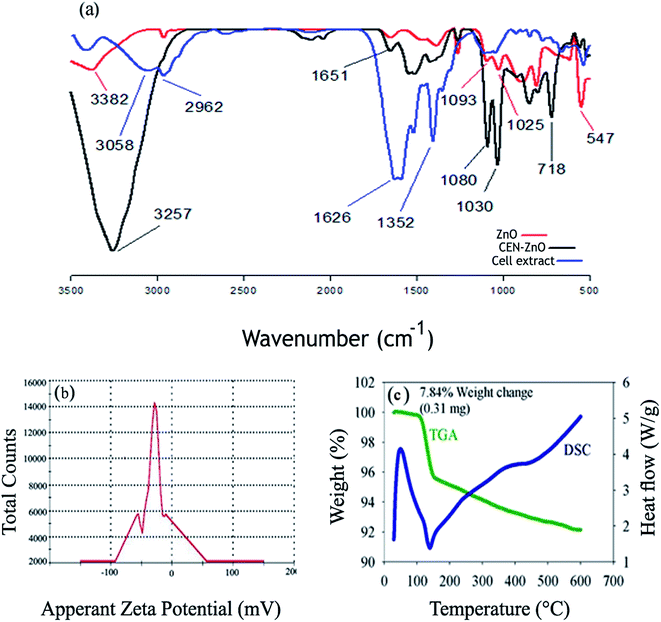 | ||
| Fig. 5 (a) FTIR profiles of ZnO, CEN-ZnO NPs and cyanobacterial cell extract. (b) Zeta potential distributions for CEN-ZnO NPs. (c) DSC/TGA thermogram profiles of the synthesized CEN-ZnO NPs. | ||
Having a negative zeta potential value of −29.7 suggests that the bioactive molecules play a role in the stability of nanoparticles for a long time (Fig. 5b). Fig. 5c shows the TGA/DSC curve of the biosynthesized zinc oxide nanoparticles using cyanobacterial cell extracts (CEN-ZnO NPs). As can be seen, the slope is initially constant and progresses horizontally, indicating that the material is pure and does not contain any impurities or moisture. The sample does not show any change in weight up to 120 °C, representing that it has an appropriate range. A gradual weight loss of 7.84% is likely due to a loss of moisture. The weight loss of the nanoparticles was about 0.31 mg. As the temperature increases, the mass of the sample decreases. The peak at 139.58 °C may be due to the evaporation of water absorbed by the surface of the product or the loss of volatile surface molecules absorbed on the surface of the zinc complex during the synthesis conditions, while the peak in the region of 220 °C shows the conversion of zinc to zinc oxide. The area from 419 °C onwards is allocated to the formation of nanoparticles and the deformation of organic matters (Fig. 5c).
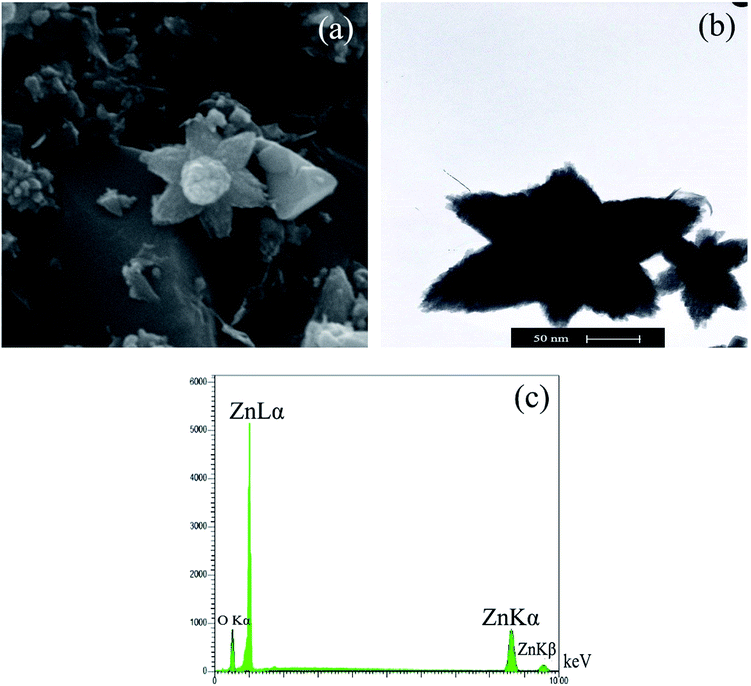
![[thin space (1/6-em)]](https://www.rsc.org/images/entities/char_2009.gif) 000× magnification and at an accelerating voltage of 20 kV, the particles were star-shaped with an average diameter of 60 nm. The TEM image further confirmed that the biosynthesized CEN-ZnO NPs have a star-like shape, small width-to-length ratio, with a mean diameter of around 50–80 nm (Fig. 6b). This is also close to the crystalline size of CEN-ZnO NPs as estimated by Scherer's formula as confirmed by the XRD results.
000× magnification and at an accelerating voltage of 20 kV, the particles were star-shaped with an average diameter of 60 nm. The TEM image further confirmed that the biosynthesized CEN-ZnO NPs have a star-like shape, small width-to-length ratio, with a mean diameter of around 50–80 nm (Fig. 6b). This is also close to the crystalline size of CEN-ZnO NPs as estimated by Scherer's formula as confirmed by the XRD results.
The chemical composition of the CEN-ZnO NPs was investigated by EDX analysis (Fig. 6c). The results of the EDX analysis of ZnO NPs show three emission peaks of metal zinc comprising 31.80% and one emission peak of oxygen comprising 63.20%. This observation clearly confirms the successful synthesis of pure CEN-ZnO NPs. Moreover, EDX results further confirm the presence of zinc in its oxide form, showing that the biosynthesis of ZnO NPs present as an efficient means of processing.
3.5. Determination of MIC and MBC, biofilm assay
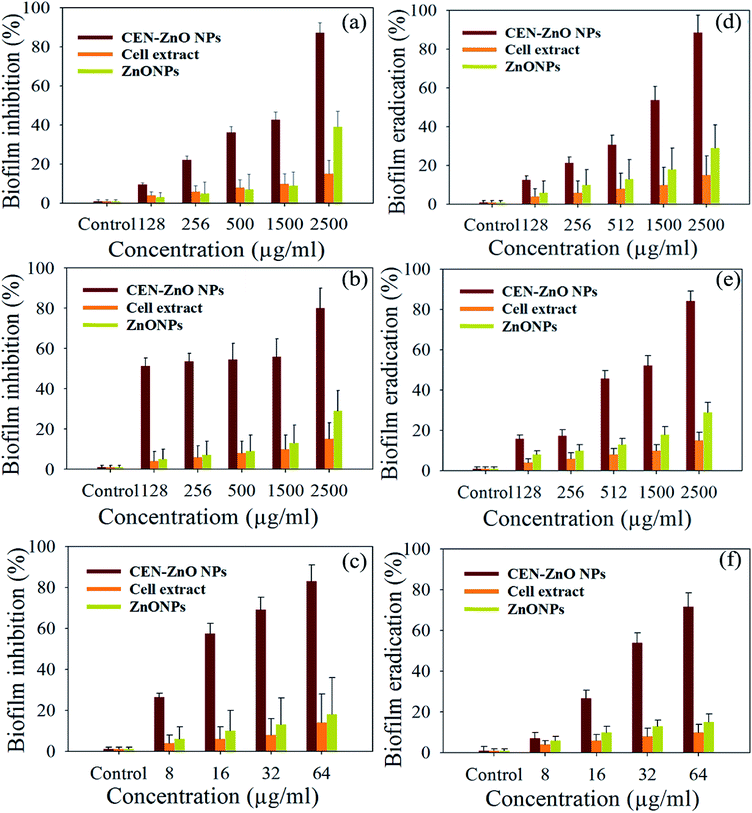
The MIC values of the biosynthesized CEN-ZnO NPs for E. coli ATCC 59222, S. aureus ATCC 59223, and P. aeruginosa PAO1 were 2000, 64, and 2000 μg ml−1, respectively, while the MBC values were 2500, 128, and 2500 μg ml−1, respectively (Table 2). The maximum MIC and MBC values were 2000 and 2500 μg ml−1 for E. coli and P. aeruginosa, respectively. The biofilm inhibition appeared with increasing concentrations of the biosynthesized CEN-ZnO NPs up to 2500 μg ml−1. The rate of biofilm inhibition for the biosynthesized CEN-ZnO NPs concentrations of 128, 256, 500, 1500, and 2500 μg ml−1 was 9.49%, 22.15%, 36.30%, 42.67%, and 87.30% in E. coli (Fig. 7a), and 51.32%, 53.53%, 54.42%, 55.75%, and 80% in P. aeruginosa (Fig. 7b). The rate of biofilm inhibition for S. aureus at concentrations of 8, 16, 32, and 64 μg ml−1 was 26.35%, 57.36%, 69.11%, and 82.86% (Fig. 7c).| Clinical strains | ZnONPs | CEN-ZnONPs | ||
|---|---|---|---|---|
| MIC (μg ml−1) | MBC (μg ml−1) | MIC (μg ml−1) | MBC (μg ml−1) | |
| E. coli ATCC 25922 | 6500 | 6600 | 2000 | 2500 |
| S. aureus ATCC 25923 | 3000 | 3500 | 64 | 128 |
| P. aeruginosa PAO1 | 6500 | 6700 | 2000 | 2500 |
3.6. Eradication of biofilm formation by CEN-ZnO NPs
The biofilm eradication showed that the CEN-ZnO NPs had no significant effect on 3 and 5 days old biofilms, whereas the biosynthesized CEN-ZnO NPs had a significant effect on one day old biofilms. The eradication activity of the NP treatment for P. aeruginosa was more pronounced compared to E. coli and S. aureus. The absorbance value of the biofilm dissolved in 33% (v/v) acetic acid in the microplate at 562 nm was used to evaluate quantitatively the amount of biofilm eradicated from the test material. The results showed that the activity of CEN-ZnO NPs was highest at the concentration of 2 mg ml−1, with an inhibition rate of 88.50% for P. aeruginosa (Fig. 7d), and 84.16% for E. coli (Fig. 7e). The inhibition rate for S. aureus, at a concentration of 64 μg ml−1, was 71.53% (Fig. 7f).3.7. Cell viability
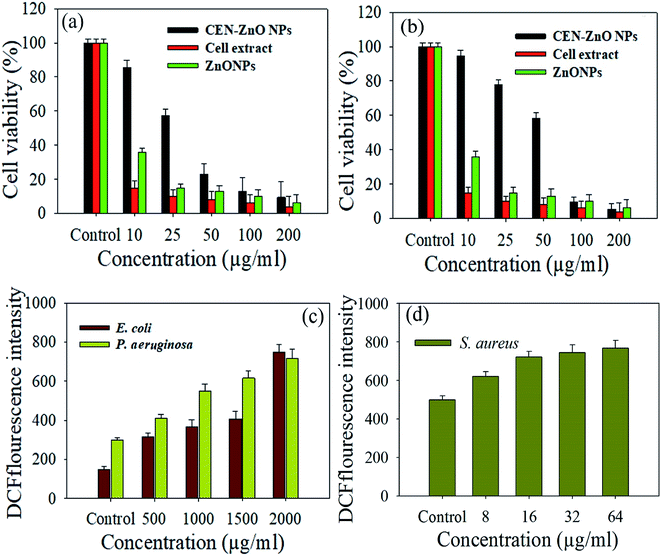
The potential cytotoxic behavior of green synthesized ZnO NPs using Nostoc sp. EA03 cell extract against the A549 and MRC-5 cell lines were examined. As shown in Fig. 8a and b, CEN-ZnO NPs do not have any significant effect on the proliferation of A549 and MRC-5 cells at low concentrations; however, when the concentration of CEN-ZnO NPs reached 100 μg ml−1, it resulted in a significant decrease in cell viability compared with the control subject. Based on the results, the initial concentration of 50 μg ml−1 can be considered as the threshold concentration, at which the toxicity is notably raised (P ≥ 0.05). However, there were less toxicity, and at a dosage of 50, 100, and 200 μg ml−1, the percentage of viable cells was 23% ± 06%, 13% ± 02%, and 9% ± 44%, respectively. The cell extract had no significant effects on the cell viability at 50, 100, and 200 μg ml−1 concentrations (Fig. 8a and b). At 50 μg ml−1 concentration, CEN-ZnO NPs eliminates 50% of the cancer cells (A549); this concentration kills less than 50% of the healthy cells (MRC-5). The obtained results showed that the CEN-ZnO NPs reduced the cell viability, and the extent of reduction was concentration/dose-dependent. As determined through the MTT assay, the A549 cell viability observed at 24 h was 85.7%, 57.36%, 23.06%, 13.02%, and 9.44% (Fig. 8a) in contrast, the MRC-5 cell viability observed at 24 h was 94.76%, 77.94%, 58.48%, 9.57%, and 5.44% (Fig. 8b) in response to treatment with 10, 25, 50, 100, and 200 μg ml−1 NPs, respectively (p < 0.05 for each).3.8. ROS assay
ROS production upon addition of the biosynthesized CEN-ZnO NPs was determined using the fluorescence dye, DCFH-DA, as an indicator for ROS measurement. In presence of 500–2500 μg ml−1 of CEN-ZnO NPs, ROS production was much greater and determined to be 316 ± 4, 368 ± 8, 407 ± 8, and 769 ± 6 in E. coli, 410 ± 3, 550 ± 4, 616 ± 2, and 786 ± 9 in P. aeruginosa. In presence of 500–2500 μg ml−1 of CEN-ZnO NPs, ROS production was much greater and determined to be 316 ± 4, 368 ± 8, 407 ± 8, and 769 ± 6 in E. coli, 410 ± 3, 550 ± 4, 616 ± 2, and 786 ± 9 in P. aeruginosa. In the case of S. aureus, CEN-ZnO NPs at a concentration of 8–64 μg ml−1, induced the ROS generation in cells up to 622 ± 1, 722 ± 66, 746 ± 9, and 768 ± 51, respectively. These results indicate a significant reduction in the population of viable bacterial cells. The P. aeruginosa and E. coli cultures showed a higher level of ROS production with increasing CEN-ZnO NPs concentrations, in comparison with that of S. aureus (Fig. 8c and d).3.9. Anti-biofilm activity of CEN-ZnO NPs by confocal laser scanning microscopy
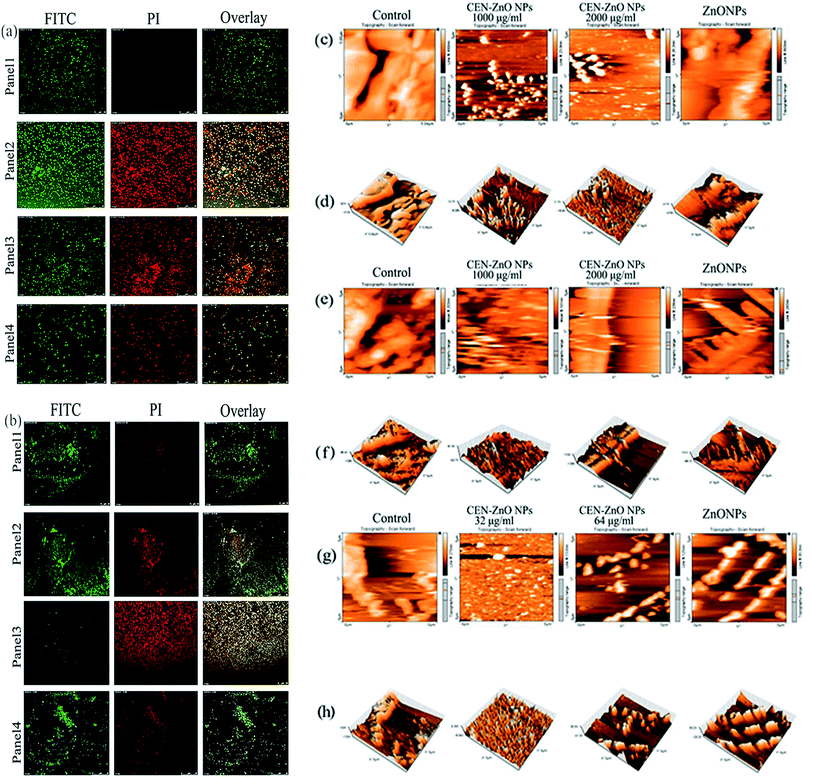
Confocal laser scanning microscopic (CLSM) analysis was performed to evaluate the biofilm formation by bacterial strains P. aeruginosa PAO1 (Fig. 9a), and S. aureus ATCC 25923 (Fig. 9b). To observe the bacterial biofilms, two dyes, PI and FITC, were used for staining. The microscopic images suggested the formation of biofilm on coverslip surfaces treated with CEN-ZnO NPs. However, most of the cells were dead (red fluorescence), and a small number of cells distinguished by staining with FITC dye (green fluorescence). The bacterial biofilms not treated with CEN-ZnO NPs, most of the bacterial cells surrounded in a network composed of an extracellular matrix (living cells). In the case of P. aeruginosa PAO1, the bacterial cells grown in the presence of 2500 μg ml−1 of CEN-ZnO NPs showed the absence of clumped cells and spread on the surface irregularly. When the CLSM images with red and green fluorescent intensity were placed on top of each other, yellow color appeared. The presence of dark areas among the biofilm might be due to the presence of water channels, heterogeneous matrix production, and all kind of exopolysaccharides inside the biofilms.24 The AFM analysis of surface topography of bacterial biofilm samples treated with CEN-ZnO NPs showed a rugged topography in some parts of the biofilm surface, indicating the destruction of biofilms. AFM 3D topographic images also confirmed the results obtained from the changes in surface topography (Fig. 9c–h). In contrast, in the untreated control samples, the structured biofilms was flat and prominent. Overall, CEN-ZnO NPs cause the destruction of the biofilm, as some parts of the biofilm surface seem to be protruding outward or sunken inwards.3.10. Flow cytometry analysis
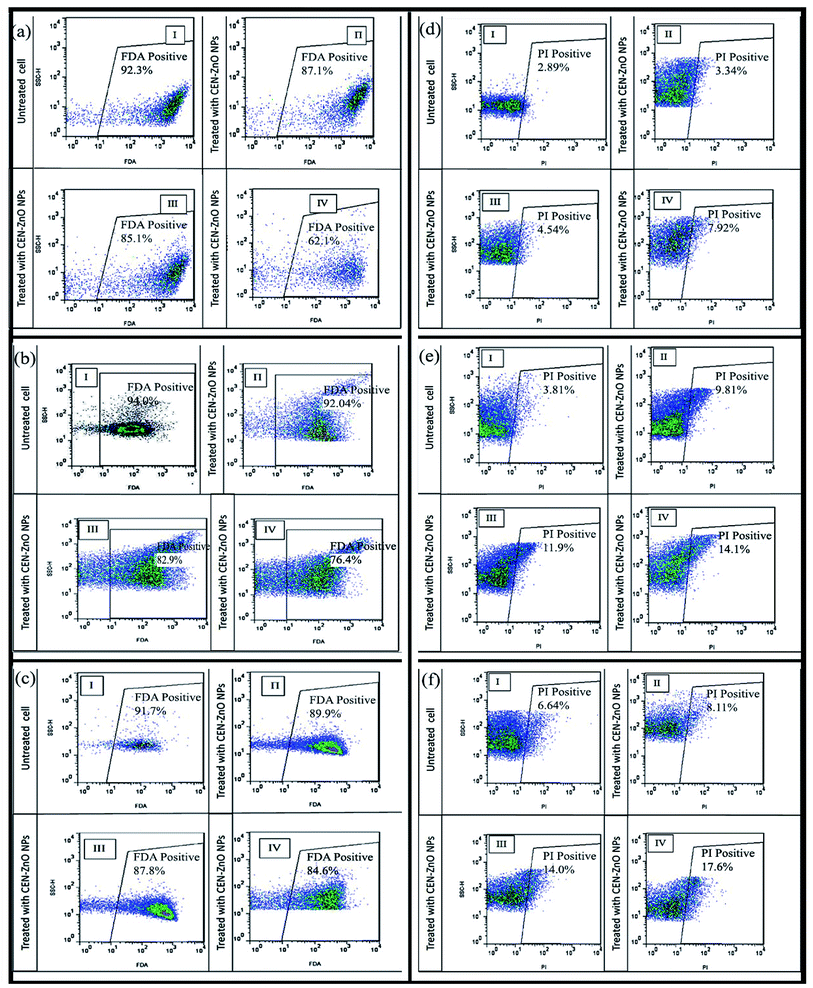
Data were collected and displayed in bi-dimensional FL1-H versus FL2-H cytograms. Fluorescence (FL1-H/FL2-H) was tested from bacterial cells inside gate LL (Fig. 10). As shown, P. aeruginosa PAO1 (Fig. 10a), E. coli ATCC 25922 (Fig. 10b), and S. aureus ATCC 25923 (Fig. 10c) exhibited a low sensitivity to CEN-ZnO NPs at concentration of 500 μg ml−1 of, and a slow decrease in cell viability (87.01%, 92.04%, and 89.9%, respectively). In fact, less than 10–12% of the bacteria were dead at this concentration. CEN-ZnO NPs at concentrations of 1500 μg ml−1 and 2500 μg ml−1, the cell viability of P. aeruginosa PAO1 was reduced by more than 20% and 38%, for E. coli by 17.9% and 23.6%, and for S. aureus at a concentration of 32 μg ml−1, 64 μg ml−1 by 13% and 16%, respectively. Higher concentrations of CEN-ZnO NPs resulted in an increase in cell debris formation and cell death.The bacterial cell stained with PI was measured to examine the internalization. The fluorescent emission of this dye was collected in the FL3 channel. The cell internalization of the control group was almost 2.89% for P. aeruginosa PAO1 and 6.64% for S. aureus, and 3.81% for E. coli (Fig. 10). As shown in (Fig. 10d–f), P. aeruginosa, E. coli, and S. aureus showed low sensitivity to CEN-ZnO NPs at concentration of 500 μg ml−1, with a gentle decrease in cell integrity (cell integrity: 3.34%, 9.81%, and 8.11%, respectively). At 1500 μg ml−1 and 2500 μg ml−1 concentrations, the cell integrity of P. aeruginosa PAO1 was 4.54% and 7.92% (Fig. 10d), for E. coli 11.9% and 14.1% (Fig. 10e), and for S. aureus at a concentration of 32 μg ml−1, 64 μg ml−1 was 14.9% and 17.6% (Fig. 10f), respectively.
4. Discussion
The biosynthesis of CEN-ZnO NPs was environmentally friendly and did not require high temperatures, high pressures, or harmful chemical compounds. The biosynthesized CEN-ZnO NPs had a higher antimicrobial activity in comparison with unalloyed ZnONPs and cyanobacterial cell extract. In a previous report, it was shown that ZnONPs has more toxic effects against Gram-positive bacteria (S. aureus) than Gram-negative bacteria (P. aeruginosa and E. coli).27 They concluded that the difference in the toxicity of nanoparticles might be due to differentiation of the bacterial cell membrane. The results also confirmed that P. aeruginosa and E. coli are identical in terms of their sensitivity to the equal dose of nanoparticles. The antimicrobial activity of the biosynthesized CEN-ZnO might be due to its star-like shape and its surface-to-volume ratio. In addition, the effectiveness of CEN-ZnO nanoparticles increases with increasing nanoparticle concentration. Adams et al.28 showed that by increasing the concentration of zinc oxide nanoparticles, the antibacterial effects of the nanoparticle against Bacillus subtilis and E. coli increases. In another study, Khursheed et al.29 reported that the antibacterial performance (MIC, MBC) of the biosynthesized zinc oxide nanoparticle using Aloe vera extract against Pseudomonas aeruginosa, E. coli (ESBL) and MRSA Staphylococcus aureus were 2200 μg ml−1, 2400 μg ml−1 and 2700 μg ml−1, respectively. However, as a result of our research, the biosynthesized CEN-ZnO were reported to have antibacterial activity against S. aureus at a lower dose of fewer than 64 μg ml−1. Concerning Pseudomonas aeruginosa, the result was in agreement with our study.29 The higher antibacterial effects of biosynthesized nanoparticles using Nostoc sp. EA03 is supposedly due to the existence of the bioactive compounds, making an advantage compared to the unalloyed zinc oxide particles. In addition, the antibacterial behavior of ZnONPs can possibly be attributed to the chemical interaction between hydrogen peroxide and membrane proteins or lipid bilayer of bacteria. The produced hydrogen peroxide gets through the bacterial cell membrane and destroys the bacterium.30 Rauf et al. Reported the ability of antibacterial activity of biomimetically synthesized ZnO nanoparticles against S. aureus to induce less-sensitive skin infections in experimental animals. They showed that the synthesized ZnONPs could effectively inhibit less susceptible Gram-positive and Gram-negative bacterial isolates. The synthesized ZnONPs also inhibited the biofilm synthesis of tested isolates in vitro and successfully treated the S. aureus-mediated experimental skin infection in BALB/c mice.31 The penetration of CEN-ZnO NPs into the bacterial cells (in line with the results obtained from flow cytometry analysis), increases intracellular accumulation of nanoparticles, thereby destroying bacterial cells.32 Malaikozhundan et al.33 tested the cytotoxic effects of Pp-ZnO NPs on MCF-7 breast cancer cells and found that single-treatment with Pp-ZnO at concentrations greater than 50 μg ml−1 reduces cell viability. The toxic effect of biosynthesized CEN-ZnO NPs on A549 lung cancer cells starts at 25 μg ml−1, has a more toxic effect than ZnONPs biosynthesized by P. pinnata seed extract. The biosynthesized CEN-ZnO NPs, at 50 μg, destroyed 77% of cancerous cells (A549) (i.e., 23% of cells were alive), whereas ∼59% of the cells were remained alive after treatment of the healthy lung cells (MRC-5) with a similar concentration. This means that CEN-ZnO NPs, in a similar concentration, eliminate cancerous cells twice as higher than healthy cells. Our results were almost close to those findings that showed a 50% reduction in human lung cancer cells A549 and breast cancer cells MCF-7 after treatment with ZnONPs at a concentration of 31.2 μg ml−1.34 Sharma et al. (2016) reported that zinc oxide in nanoscale dimensions damage DNA through lipid peroxidation and oxidative stress in human epidermal cells. They showed that the nanostructured materials can be used as a drug carrier, reducing the non-specific toxicity of strong anticancer drugs.35 Earlier studies have described that ZnONPs can reduce cell viability due to their potential for cancer treatment.36–38 Our findings indicated that the treatment of bacterial cells with CEN-ZnO NPs results in an elevated ROS production. The treatment of E. coli and P. aeruginosa with CEN-ZnO NPs showed higher ROS production compared to S. aureus, which could be explained by the different potentials that are used to change the polarity of the surface for both Gram-negative and Gram-positive bacteria.39,40 The production of ROS results in the disruption of the bacterial cell membrane, protein denaturation and damage to other macromolecules that ultimately cause cell death.36 In a previous report, Xia et al.41 compared the mechanism of toxicity of zinc oxide and cerium oxide nanoparticles based on their dissolution and oxidative stress features. They concluded that ZnO-induced toxicity in RAW 264.7 and BEAS-2B cell lines leads to the generation of reactive oxygen species (ROS), oxidant injury, excitation of inflammation, and cell death. In contrast, CeO (2) suppressed ROS production and induced cellular resistance to an exogenous source of oxidative stress. Guo et al.42 also investigated the role of oxidative stress in toxicity and possible contribution of mitochondria in the production of reactive oxygen species (ROS) upon exposure of retinal ganglion cells (RGC-5) to ZnO nanoparticles. They found that ZnO nanoparticles decrease the mitochondrial membrane potential, increase the production of ROS, leading to the RGC-5 cell damage and induction of the apoptosis/necrosis. Liu et al.43 investigated the cytotoxicity of two types of ZnO NPs of various sizes and indicate that the reactive oxygen species (ROS) played an essential role in ZnO NP-induced cytotoxicity, possibly due to the leaching of zinc ions from ZnO NPs. They showed that ZnO NPs induce toxic responses in the human neuroblastoma SHSY5Y cell line in a size-dependent manner, which might be related to their ion-shedding ability.The results obtained from flow cytometry analysis showed that the cell viability decreases with increase in CEN-ZnO NP concentration. Unlike the results obtained here, Bao et al.44 used PI dye to analyze the dead fractions of E. coli bacterial cells after treatment with 5 μg ml−1 and 10 μg ml−1 AgNPs and found that the PI-positive percentages of the bacterial cells were much higher than control groups. However, this increasing PI positive percentage is not correlated to the concentration of the AgNPs, and the highest positive ratio of the bacterial cells detected in the 5 μg ml−1 group.44 Accurate measurement of nanoparticle entering is important for measuring the physical and chemical properties of nanoparticle uptake into target cells. Also, by increasing the concentration of CEN-ZnO NPs at a fixed time, the penetration rate of nanoparticles into the cell wall of the bacteria increases. It can be speculated that Zn2+ ion release from zinc oxide may result in the transfer of Zn2+ ion into the cell wall, leading to bacteriostatic effects. For example, the interaction between the cell coating components and the Zn2+ ion (from ZnO), as reported before, was consistent with the results obtained in our research.45 The evidence obtained from confocal laser scanning microscopy (CLSM) analysis showed that while exopolysaccharides with green fluorescence were not detected, many dead cells were observable after treatment of biofilm samples with CEN-ZnO NPs. Since there are water channels (hole) to transport nutrients in biofilms, nanoparticles may penetrate directly through the exopolysaccharide layer.23 ZnO nanoparticles (ZNPs) are considered as promising inorganic nanoparticles for use in catalysis, sunscreens, cosmetics, coatings, pigments, and food additives. However, there are ever more concerns for scientists regarding their environmental threats. For example, Li et al.46 studied the uptake and depuration performance of nZnO and Zn ions in a freshwater cladoceran Daphnia magna. They found that the uptake of radio-synthesized nZnO by D. magna is related to nZnO concentration. The nZnO could enter the body of daphnids and reached the highest level within a short period of time, followed by a quick release. The depuration of nZnO was quick and controlled by nZnO dissolution. They finally suggested that both dissolved Zn and nanoparticles had better to be considered essential for studying the toxicology of nZnO. Rajput et al.47 investigated the possible threats caused by toxicity of various NPs on plants and microbial diversity. The exposure of soil to nanoparticles led to a decrease in soil microbial biomass and enzymatic activity, affecting microbial community composition including yeasts, bacteria, fungi, and biological diversity. They concluded that it is expected to divulge whether NPs could compromise crop yield, soil properties, soil organisms, and functional activities of soil.
5. Conclusion
The use of cyanobacteria has provided the basis for the development of green nanotechnology, thus reducing the production of unnecessary and impure chemical substances. The present study gives new insight into the use of cyanobacterial cell extracts, as a reducing and capping agent in the synthesis of zinc oxide nanoparticles. Our results showed that the biosynthesized zinc oxide nanoparticles have a favorable biological potential through antibacterial, anti-biofilm, and anticancer activities. The current study has also made significant findings concerning the capacity of the biosynthesized nanoparticles to destroy the lung cancer cell. The number of normal cells was approximately two-fold higher than that of cancer cells upon exposure to CEN-ZnO NPs, at a concentration of 50 μg ml−1. In addition to anti-cancer activity, the CEN-ZnO NPs was able to eliminate 24 hour-old biofilms, up to 80 to 90%, in tested bacterial strains.Altogether, zinc oxide nanoparticles synthesized using the cyanobacterium Nostoc sp. EA03 can be a good candidate for cancer treatment as well as a favorable alternative to common antibiotics for controlling microbial pathogens.
Conflicts of interest
There are no conflict to declare.Acknowledgements
This work was financially supported by National Institute of Genetic Engineering and Biotechnology (NIGEB), affiliated to Iran's Ministry of Science, Research & Technology.References
- S. Tabrez, J. Musarrat and A. A. Al Khedhairy, Countering drug resistance, infectious diseases, and sepsis using metal and metal oxides nanoparticles, Colloids Surf., B, 2016, 146, 70–83 CrossRef PubMed
.
- T. T. Sungkaworn, W. Nalakarn, P. Triampo, D. Tang, Y. Lenbury and P. Picha, The effects of TiO2 nanoparticles on tumor cell colonies: fractal dimension and morphological properties, Int. J. Biomed. Sci., 2007, 2, 62–67 Search PubMed
.
- I. O. Sosa, C. Noguez and R. G. Barrera, Optical properties of metal nanoparticles with arbitrary shapes, J. Phys. Chem. B, 2003, 107, 6269–6275 CrossRef CAS
.
- A. Pugazhendhi, R. Prabhu, K. Muruganantham, R. Shanmuganathan and S. Natarajan, Anticancer, antimicrobial and photocatalytic activities of green synthesized magnesium oxide nanoparticles (MgONPs) using aqueous extract of Sargassum wightii, J. Photochem. Photobiol. B Biol., 2019, 190, 86–97 CrossRef CAS PubMed
.
- S. Ahmed, A. Ahmad, B. L. Swami and S. Ikram, A review on plants extract mediated synthesis of silver nanoparticles for antimicrobial applications: a green expertise, J. Adv. Res., 2015, 7, 17–28 CrossRef PubMed
.
- G. Patrinoiu, J. M. Calderón-Moreno, C. M. Chifiriuc, C. Saviuc, R. Birjega and O. Carp, Tunable ZnO spheres with high anti-biofilm and antibacterial activity via a simple green hydrothermal route, J. Colloid Interface Sci., 2016, 462, 64–74 CrossRef CAS PubMed
.
- M. Shah, D. Fawcett, S. Sharma, S. K. Tripathy and G. E. Poinern, Green synthesis of metallic nanoparticles via biological entities, Materials, 2015, 8, 7278–7308 CrossRef CAS PubMed
.
- H. F. Khalid, B. Tehseen, Y. Sarwar, S. Z. Hussain, W. S. Khan, Z. A. Raza, S. Z. Bajwa, A. G. Kanaras, I. Hussain and A. Rehman, Biosurfactant coated silver and iron oxide nanoparticles with enhanced anti-biofilm and anti-adhesive properties, J. Hazard Mater., 2019, 364, 441–448 CrossRef CAS PubMed
.
- R. P. Rastogi and R. P. Sinah, Biotechnological and industrial significance of cyanobacterial secondary metabolites, Biotechnol. Adv., 2009, 27, 521–539 CrossRef CAS PubMed
.
- R. Brayner, H. Barberousse, M. Hemadi, C. Djedjat, C. Yéprémian, T. Coradin, J. Livage, F. Fiévet and A. Couté, Cyanobacteria as bioreactors for the synthesis of Au, Ag, Pd, and Pt nanoparticles via an enzyme-mediated route, J. Nanosci. Nanotechnol., 2007, 7(8), 2696–2708 CrossRef CAS PubMed
.
- K. Jiri, Coccoid and colonial cyanobacteria, Freshwater algae of North America, Ecology and Classification, 2003, pp. 59–116 Search PubMed
.
- I. Rago, C. R. Chandraiahgari, M. P. Bracciale, G. D. Bellis, E. Cestelli, M. C. Zanni, D. Sali, A. Broggi, C. Palleschi, M. Alessandra and D. S. Uccelletti, Zinc oxide microrods and nanorods: different antibacterial activity and their mode of action against Gram-positive bacteria, RSC Adv., 2014, 4, 56031–56040 RSC
.
- S. Gunalan, R. Sivaraj and V. Rajendran, Green synthesis of ZnO nanoparticles against bacterial and fungal pathogens, Prog. Nat. Sci.: Mater. Int., 2012, 22, 693–700 CrossRef
.
- F. M. Morsy, N. A. Nafady, M. H. Abd-Alla and D. A. El-Hady, Green synthesis of silver nanoparticles by water soluble fraction of the extracellular polysaccharides/matrix of the cyanobacterium Nostoc commune and its application as a potent fungal surface sterilizing agent of seed crops, Univers. J. Microbiol. Res., 2012, 2, 36–43 CrossRef
.
- K. Jiri, and J. R. Johansen, Fresh water Algae of North America, Ecology and classification, Academic Press: Elsvier Science (USA), 2003, pp. 135–235 Search PubMed
.
- E. Valerio, L. Chambel, S. Paulino, N. Faria, P. Pereira and R. Tenreiro, Molecular identification, typing and traceability of cyanobacteria from freshwater reservoirs, Microbiology, 2009, 155, 642–656 CrossRef CAS PubMed
.
- S. F. Altschul, W. Gish, W. Miller, E. W. Myers and D. J. Lipman, Basic local alignment search tool, J. Mol. Biol., 1990, 215, 403–410 CrossRef CAS PubMed
.
- N. Saitou and M. Nei, The neighbor-joining method: a new method for reconstructing phylogenetic trees, Mol. Biol. Evol., 1987, 4, 406–425 CAS
.
- Y. H. Diana and B. Parthipan, Compounds Identification from Hypersaline Oscillatoria Salina Using GC-MS analysis, Int. J. Res. Stud. Biosci., 2015, 3, 6–10 Search PubMed
.
- F. R. Kockerill et al., Clinical and Laboratory Standards Institute, Methods for dilution antimicrobial susceptibility tests for bacteria that grow aerobically, Approved Standard, 9th edn, 2012, vol. 29 Search PubMed
.
- P. Sabaeifard, A. Abdi-Ali, M. R. Soudi and R. Dinarvand, Optimization of tetrazolium salt assay for Pseudomonas aeruginosa biofilm using microtiter plate method, J. Microbiol. Methods, 2014, 105, 134–140 CrossRef CAS PubMed
.
- B. Pitts, M. A. Hamilton, N. Zelver and P. S. Stewart, A microtiter-plate screening method for biofilm disinfection and removal, J. Microbiol. Methods, 2003, 54, 269–276 CrossRef CAS PubMed
.
- J. A. Banas, K. R. Hazlett and J. E. Mazurkiewicz, An in vitro model for studying the contributions of the Streptococcus mutans glucan-binding protein-A to biofilm structure, Methods Enzymol., 2001, 337, 425–433 CAS
.
- M. A. Ansari, H. M. Khan, A. A. Khan, S. S. Cameotra and R. Pal, Antibiofilm efficacy of silver nanoparticles against biofilm of extended spectrum B-lactamase isolates of Escherichia coli and Klebsiella pneumoniae, Appl. Nanosci., 2014, 4, 859–868 CrossRef CAS
.
- C. Jayaseelan, A. A. Rahuman, A. V. Kirthi, S. Marimuthu, T. Santhoshkumar, A. Bagavan, K. Gaurav, L. Karthik and K. V. Rao, Novel microbial route to synthesize ZnO nanoparticles using Aeromonas hydrophila and their activity against photogenic bacteria and fungi, Spectrochim. Acta A Mol. Biomol. Spectrosc., 2012, 90, 78–84 CrossRef CAS PubMed
.
- G. Singh, P. K. Babele, A. Kumar, A. Srivastava, R. P. Sinha and M. B. Tyagi, Synthesis of ZnO nanoparticles using the cell extract of the cyanobacterium, Anabaena strain L31 and its conjugation with UV-B absorbing compound shinorine, J. Photochem. Photobiol., B, 2014, 138, 55–62 CrossRef CAS PubMed
.
- M. Premanathan, K. Karthikeyan, K. Jeyasubramanian and G. Manivannan, Selective toxicity of ZnO nanoparticles toward Gram-positive bacteria and cancer cells by apoptosis through lipid peroxidation, J. Nanomed. Nanotechnol., 2011, 7, 184–192 CrossRef CAS PubMed
.
- L. K. Adams, D. Y. Lyon and P. J. J. Alvarez, Comparative ecotoxicity of nanoscale TiO2, SiO2, and ZnO water suspensions, Water Res., 2006, 40, 3527–3532 CrossRef CAS PubMed
.
- A. Khursheed, D. Sourabh, A. Ameer, A. S. Quaiser, S. Mansour, A. Alkhedhairy and M. Javed, Aloe vera extract functionalized zinc oxide nanoparticles as nanoantibiotics against multi-drug resistant clinical bacterial isolate, J. Colloid Interface Sci., 2016, 472, 145–156 CrossRef PubMed
.
- L. Zhang, Y. Jiang, Y. Ding, M. Povey and D. York, Investigation into the antibactrial behaviour of suspension of zno nanoparticles (ZnO nanofluids), J. Nanoparticle Res., 2007, 9, 479–489 CrossRef CAS
.
- M. A. Rauf, M. Owais, R. Rajpoot, F. Ahmad, N. Khan and S. Zubair, Biomimetically synthesized zno nanoparticles attain potent antibacterial activity against less susceptible S. aureus skin infection in experimental animals, RSC Adv., 2017, 7, 36361–36373 RSC
.
- A. Sirelkhatim, S. Mahmud, A. Seeni, N. H. M. Kaus, L. Ann, S. K. M. Bakhori, H. Hassan and D. Mohammad, Review on zinc oxide nanoparticles: antibacterial activity and toxicity mechanism, Nano-Micro Lett., 2015, 7, 219–242 CrossRef CAS PubMed
.
- B. Malaikozhundan, B. Vaseeharan, S. Vijayakumar, K. Pandiselvi, M. A. Kalanjiam, K. Murugan and G. Benelli, Biological therapeutics of Pongamia pinnata coated zinc oxide nanoparticles against clinically important pathogenic bacteria, fungi and MCF-7 breast cancer cells, Microb. Pathog., 2017, 104, 268–277 CrossRef CAS PubMed
.
- D. Selvakumari, R. Deepa, V. Mahalakshmi, P. Subhashini and N. Lakshminarayan, Anti-cancer activity of zno nanoparticles on MCF7 (breast cancer cell) and A549 (lung cancer cell), ARPN J. Eng. Appl. Sci., 2015, 10, 5418–5421 CAS
.
- H. Sharma, K. Kumar, C. Choudhary, P. K. Mishra and B. Vaidya, Development and characterization of metal oxide nanoparticles for the delivery of anticancer drug, Artif. Cells, Nanomed., Biotechnol., 2016, 44, 672–679 CrossRef CAS PubMed
.
- A. Kumar, M. Najafzadeh, B. K. Jacob, A. Dhawan and D. Anderson, Zinc oxide nanoparticles affect the expression of p53, Ras p21 and JNKs: an ex vivo/in vitro exposure study in respiratory disease patients, Mutagenesis, 2015, 30, 237–245 CrossRef CAS PubMed
.
- K. Meyer, P. Rajanahali, M. Ahamed, J. J. Rowe and Y. Hong, ZnO nanoparticles induce apoptosis in human dermal fibroblasts via p53 and p38 pathways, Toxicol. in Vitro, 2011, 28, 1721–1726 CrossRef PubMed
.
- A. Punnoose, K. Dodge, J. W. Rasmussen, J. Chess, D. Wingett and C. Anders, Cytotoxicity of ZnO nanoparticles can be tailored by modifying their surface structure: A green chemistry approach for safer nanomaterials, ACS Sustain. Chem. Eng., 2014, 2, 1666–1673 CrossRef CAS PubMed
.
- A. F. Tavares, M. Teixeira, C. C. Romao, J. D. Seixas, L. S. Nobre and L. M. Saraiva, Reactive oxygen species mediate bactericidal killing eliciated by carbon monoxide-releasing molecules, J. Biol. Chem., 2011, 286, 26708–26717 CrossRef CAS PubMed
.
- H. L. Su, C. C. Chou, D. L. Hung, I. C. Pao, J. H. Lin, F. L. Huang, R. X. Dong and J. J. Lin, The disruption of bacterial membrane integrity through ROS generation induced by nano hybrids of silver and clay, Biomaterials, 2009, 30, 5979–5987 CrossRef CAS PubMed
.
- T. Xia, M. Kovochich, M. Liong, L. Mädler, B. Gilbert, H. Shi, J. I. Yeh, J. I. Zink and A. E. Nel, Comparison of the mechanism of toxicity of zinc oxide and cerium oxide nanoparticles based on dissolution and oxidative stress properties, ACS Nano, 2008, 2, 2121–2134 CrossRef CAS PubMed
.
- D. Guo, H. Bi, B. Liu, Q. Wu, D. Wang and Y. Cui, Reactive oxygen species-induced cytotoxic effects of zinc oxide nanoparticles in rat retinal ganglion cells, Toxicol. In Vitro, 2013, 27, 731–738 CrossRef CAS PubMed
.
- J. Liu, Y. Kang, S. Yin, B. Song, L. Wei, L. Chen and L. Shao, Zinc oxide nanoparticles induce toxic responses in human neuroblastoma SHSY5Y cells in a size-dependent manner, Int. J. Nanomed., 2017, 12, 8085–8099 CrossRef CAS PubMed
.
- H. Bao, X. Yu, C. Xu, X. Li, Z. Li, D. Wei and Y. Liu, New toxicity mechanism of silver nanoparticles: promoting apoptosis and inhibiting proliferation, PLoS One, 2015, 10(13), e0122535 CrossRef PubMed
.
- Y. Zhang, L. Wang, X. Xu, F. Li and Q. Wu, Combined systems of different antibiotics with nano-CuO against Escherichia coli and the mechanisms involved, Nanomedicine, 2018, 13, 339–351 CrossRef CAS PubMed
.
- W. M. Li and W. X. Wang, Distinct biokinetic behavior of ZnO nanoparticles in Daphnia magna quantified by synthesizing 65Zn tracer, Water Res., 2013, 47(2), 895–902 CrossRef CAS PubMed
.
- V. D. Rajput, T. Minkina, S. N. Sushkova, V. Tsitsuashvili, S. S. Mandzhieva, A. V. Gorovtsov, D. Nevidomskyaya and N. Gromakova, Effect of nanoparticles on crops and soil microbial communities, J. Soils Sediments, 2018, 18, 2179–2187 CrossRef CAS
.
| This journal is © The Royal Society of Chemistry 2019 |


