 Open Access Article
Creative Commons Attribution 3.0 Unported Licence
Application of pea-like yolk–shell structured Fe3O4@TiO2 nanosheets for photocatalytic and photo-Fenton oxidation of bisphenol-A†
Xingxing Li,
Mingcan Cui,
Yonghyeon Lee,
Jongbok Choi and
Jeehyeong Khim *
*
School of Civil, Environmental, and Architectural Engineering, Korea University, 145 Anam-ro, Seongbuk-gu, Seoul 02841, Republic of Korea. E-mail: hyeong@korea.ac.kr
First published on 17th July 2019
Abstract
Uniform pea-like yolk–shell (PLYS) structured magnetic TiO2(PLYS-Fe3O4@TiO2) nanosheets have been prepared via a combined kinetics-controlled mechanical force-driven and hydrothermal etching assisted crystallization method and characterized. The resulting PLYS-Fe3O4@TiO2 nanosheets possess well defined yolk–shell structures with a large BET surface area (∼187.26 m2 g−1) and a strong magnetic susceptibility (∼17.4 emu g−1). The reaction rate constant was 24.2 × 10⁻² min−1 as a result of oxidative decomposition of BPA using UV/PLYS-Fe3O4@TiO2/H2O2 system. This is 1.1 and 8.34 times faster than the BPA decomposition reaction rate constant in UV/TiO2/H2O2 and UV/Fe3O4/H2O2 systems, respectively. The synthesized catalyst also exhibited excellent recycle capability and excellent acid decomposition performance.
1. Introduction
Emerging organic contaminants (EOCs) are a burgeoning and extremely diverse class of contaminants that are not routinely monitored but have the great potential to enter the environment and may cause known or suspected adverse ecological and human health effects. EOCs of major concern include endocrine disrupting chemicals, pharmaceuticals and personal care products, surfactants, and various industrial additives as well as hormones. BPA, classified as an endocrine disruptor, is a contaminant of importance because it is extensively used in the production of polycarbonates, epoxy resins, and other plastics.1 Due to the low concentration, high chemical stability and low biodegradability of BPA, the effectiveness of conventional treatment technologies such as adsorption, membrane filtration, and biological treatment are typically limited.2 As an alternative, advanced oxidation processes (AOPs) have been demonstrated as a highly efficient technology for the destruction and mineralization of organic pollutants through powerful reactive oxidation species such as hydroxyl radicals (HO˙).3–6 Among various AOPs, homogeneous Fenton reaction based on ferrous ions and hydrogen peroxide is of great importance owing to the environmentally friendly characteristics. However, the narrow working pH range, difficulties to recover the dissolved metal ions and necessity for further treatment of ferric hydroxide sludge greatly hinder its wide application for practical water treatment.7,8 To this end, heterogeneous Fenton process is developed as a valid approach to overcome these kinds of drawbacks.Recently, Nemanja et al.9 prepared an effective photo-Fenton catalyst of Fe/TiO2 by deposition–precipitation method for degradation of thiacloprid. However, the catalyst separation issue seems to be a big challenge. Although Lejin et al.10 synthesized Fe3O4 magnetic particles via the co-precipitation of Fe2+ and Fe3+ method and observed the effect of different parameters, the degradation efficiency of 2,4-dichlorophenol is not high. Xiaoliang et al.11 demonstrated the heterogeneous Fenton-like process for the treatment of methylene blue (MB), whereas the core–shell structured Fe3O4@C nanoparticles only worked well in acidic environment. Sheng-Tao et al.12 showed the core–shell structured Fe3O4@SiO2 nanoparticles as efficient Fenton-like catalyst in neutral environment for the degradation of MB but the mechanism still requires farther investigations. In addition, yolk–shell material with a distinctive core@void@shell configuration, has stimulated considerable interest because of the void space between the core and the shell which can provide as a reactor. Dan et al.13 reported that yolk–shell structured Fe3O4@TiO2 nanoparticles as a high-performance catalyst for the combination of photo-Fenton degradation of tetracycline. However, due to Fe3O4 was fully covered by the TiO2 shell, it can cause lots of disadvantages.
In this study, we design and prepare an advanced PLYS-Fe3O4@TiO2 nanosheets as a heterogeneous photocatalytic photo-Fenton catalyst. Instead of TiO2 shell, TiO2 nanosheets are coated which cannot only increase the surface area, but also shorter the penetration pathway of both H2O2 and light. Most importantly, even after 3 times cycle test, the catalyst still shows high activity for the degradation of BPA under a neutral condition.
2. Materials and methods
2.1 Reagents
Iron chloride hexahydrate (FeCl3·6H2O), sodium citrate tribasic dehydrate, sodium acetate (NaAc), bisphenol-A, concentrated ammonia solution (28 wt%), t-butanol, titanium(IV) isopropoxide (TIPO), TiO2 (P25, 20% rutile and 80% anatase) and tetraethyl orthosilicate (TEOS) were analytical grade and purchased from Sigma-Aldrich (USA). Sodium hydroxide (NaOH), hydrochloric acid (HCl, 36%), perchloric acid (HClO4), potassium bi-phthalate (C6H4COOKCOOH, 99.7%), ammonium molybdate ((NH4)6Mo7O24·4H2O, 99.0%), ethylene glycol and ethanol were purchased from Samchun Pure Chemicals. All chemicals were analytical grade and used as received without further purification. Corp. deionized water was used for all experiments.2.2 Preparation of catalysts
The as-prepared Fe3O4@SiO2 nanospheres were further coated with a TiO2 shell through a kinetic-controlled Stöber method. Briefly, the core–shell Fe3O4@SiO2 nanospheres (0.1 g) were dispersed in ethanol (100 mL), and mixed with concentrated ammonia solution (0.80 mL, 28 wt%) under ultrasound for 15 min. Subsequently, 0.75 mL of TIPO was added dropwise in 5 min, and the reaction was allowed to proceed for 24 h at 45 °C under continuous mechanical stirring. The resultant products (denoted as pea-like core–shell Fe3O4@SiO2@TiO2) were separated with a magnet and washed with deionized water and ethanol for 3 times, respectively.
The resultant products (denoted as PLYS-Fe3O4@TiO2) were calcined 400 °C in N2 atmosphere for 2 h, then the PLYS-Fe3O4@TiO2 nanosheets were obtained.
2.3 Materials characterization
X-ray diffraction (XRD) patterns were recorded on a Bruker D8X-ray diffractometer with Ni-filtered Cu Kα radiation (40 kV, 40 mA). Nitrogen sorption isotherms were measured at 77 K with a Micromeritics Tristar 3020 analyzer (USA). Prior to measurements, the samples were degassed in a vacuum at 180 °C for 6 h. The Brunauer–Emmett–Teller (BET) method was utilized to calculate the specific surface areas (SBET) using adsorption data in the relative pressure range P/P0 = 0.04–0.2. Using the Barrett–Joyner–Halenda (BJH) model, the pore size distributions were derived from the adsorption branches of the isotherms, and the total pore volumes (V) were estimated from the adsorbed amount at the relative pressure P/P0 = 0.995. Transmission electron microscopy (TEM) was carried out on a JEOL 2011 microscope (Japan) operated at 200 kV. For TEM measurements, the sample was suspended in ethanol and supported on a holey carbon film on a Cu grid. High-resolution transmission electron microscopy (HRTEM) observations were performed on JEM-2100F transmission electron microscope with an accelerating voltage of 200 kV equipped with a post-column Gatan imaging filter (GIF-Tri-dium). Scanning electron microscopy (SEM) images were taken using a Zeiss ultra 55 ultrahigh resolutions thermal FEG with an in-lens electron optic operating at 3 kV. The magnetization was measured using a Vibrating Sample Magnetometer (EV9 including automatic sample rotation, Microsense, Japan) under a magnetic field of 10 kOe and a temperature of 24 °C.2.4 Experimental procedure
All experiments were conducted in cylindrical batch reactors (Φ2.0 × 10.0 cm, total volume: 50 mL) with a shaking water bath to mix and maintain the temperature (Fig. S1†). A thermometer (Tecpel DTM-318) was used to measure the temperature. The light source (Fig. S2†) was HANSUNG G12T5 UV lamp (λ = 254 nm, 5 × 10 W) and the light intensity in the centre of the BPA solution was 800 μW cm−2. The reaction suspension was prepared by adding appropriate amounts of catalyst and H2O2 into 30 mL BPA solution. The desired pH value was adjusted by HClO4 or NaOH and measured by a pH meter (Orion 3 Star). Prior to addition of H2O2, the mixture was mixed in dark for 30 min to reach the adsorption/desorption equilibrium between the catalyst and pollutants. Afterwards, 1.0 mL of the suspension was removed using a 2 mL syringe at given time intervals and filtered via a membrane with a pore size of ∼0.45 mm. Furthermore, 10 μL 0.5 M n-butanol was added to the sample above to terminate the reaction and the BPA concentration in each sample was analysed on a high-performance liquid chromatography (Agilent 1260) with an Eclipse XDB C18 column (4.6 × 250 mm, 5 μm) and a diode array UV detector (G4212B 1260 DAD, λ = 210 nm). For the reusability test, the catalysts were collected by magnetic separation, washed with deionized water several times, dried in vacuum and used it for the next reaction under similar experimental conditions. Experiments were carried out 3 times and all results were expressed as a mean value. The total organic carbon (TOC) was determined with a laboratory TOC analyzer (SIEVERS 5310C). Leached iron ions were detected by an Inductively Coupled Plasma Atomic Emission Spectrometer (ICP-AES; PerkinElmer 5300DV).3. Results and discussion
3.1 Synthesis methods and characterizations
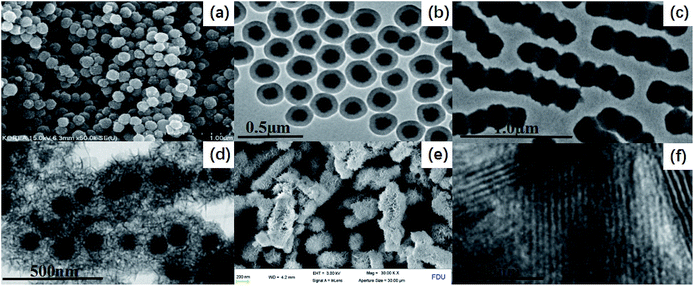
Fig. 1 illustrates the diagrammatic sketch of the synthesis procedure which involves three steps. In step (1), the pre-synthesized magnetic Fe3O4 nanoparticles were coated with silica layer via sol–gel method using TEOS as a precursor. In step (2), a further sol–gel process was used to coat TiO2 shell on the silica layer using TIPO as the precursor. In step (3), after a hydrothermal etching method followed by calcination process, PLYS-Fe3O4@TiO2 nanosheets were formed.The uniform magnetite particles can be prepared through a facile solvothermal reaction based on a high temperature reduction of Fe(III) salts with ethylene glycol in the presence of trisodium citrate. SEM images clearly reveal that the obtained Fe3O4 particles possess a uniform spherical shape with an average diameter of ∼130 nm (Fig. 2(a)). The particles exhibit excellent dispersibility in polar solvents such as water and ethanol because of numerous citrate groups anchored on the surface, facilitating the subsequent coating with silica and titania. The PLYS-Fe3O4@TiO2 nanospheres after the first sol–gel process show a relatively smooth surface with a diameter of ∼180 nm (Fig. 2(b)). TEM images reveal that a silica layer with a thickness of ∼40 nm is uniformly coated onto the magnetic core, resulting in a well-defined core–shell structure.
The further sol–gel process leads to the formation of the pea-like Fe3O4@SiO2@TiO2 particles with an average thickness of TiO2 layer is ∼120 nm (Fig. 2(c)). After the hydrothermal treatment, the PLYS-Fe3O4@TiO2 nanoparticles with a uniform size of 900 nm are obtained (Fig. 2(d)). As represented in Fig. 2(e), PLYS-Fe3O4@TiO2 nanoparticles possess a unique yolk–shell structure that the diameters of the inner and of the outer layer are 200 and 320 nm. Fig. 2(f) clearly indicates that the lattice fringes of the nanosheet are 0.35 nm which can be analogous to the (101) planes of anatase TiO2.16
The X-ray diffraction (XRD) pattern of PLYS-Fe3O4@TiO2 (Fig. 3(a)) shows six well resolved characteristic diffraction peaks of (320), (331), (400), (422), (511), (440), which are typical for Fe3O4 crystalline phase.17 In addition, new characteristic peaks can be clearly distinguished compared with XRD pattern of pure Fe3O4 nanoparticles.
N2 sorption isothermal (Fig. 3(b)) shows that the PLYS-Fe3O4@TiO2 nanoparticles have a nanoporous structure and the BET surface area is calculated to be 187.26 m2 g−1 which is a little decrease compared with PLYS-Fe3O4@TiO2 (208.38 m2 g−1). The integrated energy dispersive X-ray spectroscopy (EDS) analysis of PLYS-Fe3O4@TiO2 (Fig. S8†) further confirms the presence of elements Ti, Fe and O. In addition, the Fe content is ∼13.17 wt%.
Meanwhile, the saturation magnetization value of pure Fe3O4 and PLYS-Fe3O4@TiO2 nanoparticle (Fig. 3(c)) were measured to be 51.7 and 17.4 emu g−1 respectively, which could be ascribed to the existence of TiO2 nanosheets.
Furthermore, to observe the mechanism of the formation of PLYS-Fe3O4@TiO2 double-shelled yolk–shell microspheres, a series of experiments were carried out. With the change of ammonia content (0.4, 0.5, 0.6 and 0.7 mL), the typical sandwich sphere structure was converted to a pea-like yolk–shell structure (Fig. S3†). And using different diameter of mixing paddle (4, 5 and 6 cm), the length of pea-like particles was changed (Fig. S4†) with different concentration of sodium hydroxide solution, the structure of PLYS-Fe3O4@TiO2 spheres had a big change (Fig. S6†), but there was no big difference for PLYS-Fe3O4@TiO2 particles. However, the PLYS-Fe3O4@TiO2 double-shelled structure will be collapsed under the high concentration of sodium hydroxide (Fig. S7A†). In addition, with higher concentration of hydrochloric acid, the pea-like yolk–shell structure would be changed (Fig. S7B†).
On the basis of the above observations, we propose a combination of kinetics-controlled mechanical force-driven growth (Fig. S5†) and hydrothermal etching assisted crystallization method for the formation of the PLYS-Fe3O4@TiO2 double-shelled yolk–shell nanoparticles. Because of the high initial ammonia content, the heterogeneous and homogenous nucleation processes simultaneously occur18 and the pea-like core–shell Fe3O4@SiO2@TiO2 nanoparticles can be formed under the mechanical force.19,20 Subsequently, the amorphous silica layer is etched by NaOH solution first, then the alkali solution can permeate and etch porous TiO2 shell to form two layers titanate nanosheets.21
3.2 Catalytic activity of PLYS-Fe3O4@TiO2
Furthermore, the reaction kinetic constants were evaluated through fitting the experimental data with Langmuir–Hinshelwood model to better compare the catalytic performance. And the degradation kinetic curves can be assumed as pseudo first-order kinetic eqn (1).
| −ln(C/C0) = kt + b | (1) |
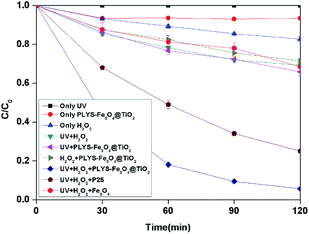
Fig. 4 shows the BPA decomposition reaction rate constants in different systems related to this study. Table S1† Comparing reaction rate constants in different systems and conditions.
The kinetic constant value of UV/H2O2/PLYS-Fe3O4@TiO2 is 24.2 × 10⁻³ min−1 higher than the summation of UV/PLYS-Fe3O4@TiO2 (3.4 × 10⁻³ min−1), UV/TiO2/H2O2 (11.5 × 10⁻³ min−1), UV/Fe3O4/H2O2 (2.9 × 10⁻³ min−1), UV/H2O2 (3.0 × 10⁻³ min−1) and H2O2/PLYS-Fe3O4@TiO2 (2.7 × 10⁻³ min−1).
The results indicate that the relatively poor adsorption efficiency of BPA on the PLYS-Fe3O4@TiO2 catalysts and the BPA oxidation capacity of H2O2 directly is weaker than hydroxyl radical. It also suggests that the synergetic effect between photocatalytic process and photo-Fenton process, which not only inhibits the recombination between electrons and holes, but also accelerates the reaction speed of Fe3+ to Fe2+ to increase the kinetic constant. This is similar to the value given in the ref. 22 and 23.
| C15H16O2 + 72HO˙ → 15CO2 + 44H2O | (2) |
| Fe2+ + H2O2 → Fe3+ + HO˙ + OH− | (3) |
| C15H16O2 + 72H2O2 → 15CO2 + 44H2O | (4) |
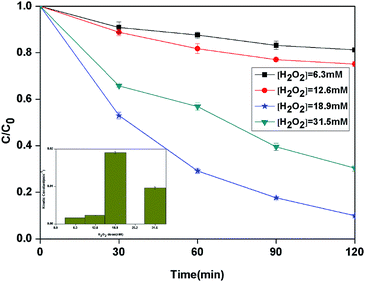
The enhancement of degradation rate is because of the increase in HO˙.24,25 Moreover, further addition of H2O2 dose did not improve the degradation efficiency, which may be explained by the scavenging effect of HO˙ at a higher H2O2 dose eqn (5).26,27
 | (5) |
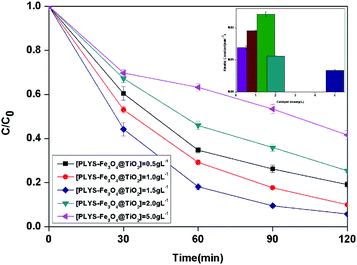
The increase of the degradation rate might be attributed to a number of active sites on the surface of both Fe3O4 and TiO2, which cannot only be occupied by H2O2, but also enhance the light utilization to generate more hydroxyl radicals. The decrease of kinetic constant after 1.5 g L−1 might be due to three reasons, higher turbidity which can inhibit the further penetration of light into the reactor, the consuming of HO˙ by excess Fe2+ and other radicals, such as  eqn (6) and (7)28 and catalyst agglomeration.29
| Fe2+ + HO˙ → Fe3+ + OH− | (6) |
 | (7) |
| TiOH + H+ → TiOH2+ | (8) |
| TiOH + OH− →TiO− + H2O | (9) |
 | (10) |
 | (11) |
| H2O2 ↔ H+ + HO2− | (12) |
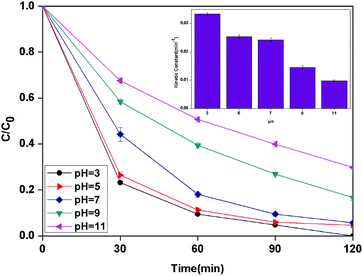
In addition, it should be noticed that catalytic activity of PLYS-Fe3O4@TiO2 was slightly affected by pH values from 5 to 7. This phenomenon is important because one of the major drawbacks of Fenton reaction is the narrow range of pH.
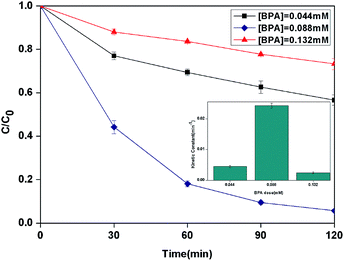
This phenomenon may be related to the fact that the excessive dose of H2O2 and catalyst for lower initial concentration of BPA which leading to the scavenging effect of HO˙.32 Furthermore, with the increasing of BPA concentration, more BPA molecules could be adsorbed on the surface of catalyst which can form the blocked active sites to decease the generation of HO˙.33,34
3.3 Mechanism investigation
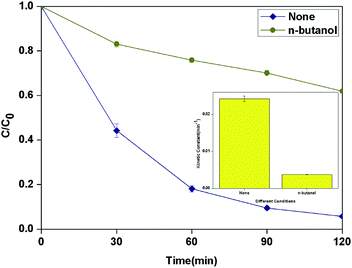
According to the results of other researchers, n-butanol can react with HO˙ which generated from both surface and bulk solution.35,36 The actual reactive species in the process was discriminated by determining the influence of n-butanol as radical scavenger on the degradation of BPA. As shown in Fig. 9, 1 M n-butanol in solution can scavenge most of the HO˙ produced in the system and the kinetic constant decreased to 3.7 × 10⁻³ min−1.Based on all the information obtained above and previous studies by other researchers,13,37–39 an assumed mechanism of BPA degradation by PLYS-Fe3O4@TiO2/H2O2 system is illustrated in Fig. 10. The BPA is mainly removed by HO˙ which was generated from photo-Fenton and photocatalysis process as shown in eqn (3), (14),40,41 (15)42,43 and (16).13 Benefiting from the yolk–shell and nanosheet structure, BPA molecules can easily permeate into the surface of Fe3O4 and degrade by hydroxyl radicals. Most importantly, the photo-induced electrons which generated from TiO2 can not only promote the recovery of Fe2+ from Fe3+, but also inhibit the recombination of electrons and holes.
| Fe(OH)2+ + hν → HO˙ + Fe2+ | (13) |
| H2O2 + hν → 2HO˙ | (14) |
| TiO2 + hν → eCB− + hVB+ | (15) |
| H2O + hVB+ → HO˙ + H+ | (16) |
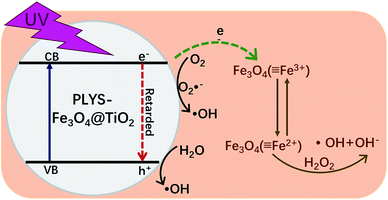 | ||
| Fig. 10 Schematic illustration of the possible mechanism proposed for BPA degradation by PLYS-Fe3O4@TiO2. | ||
3.4 Catalytic stability test
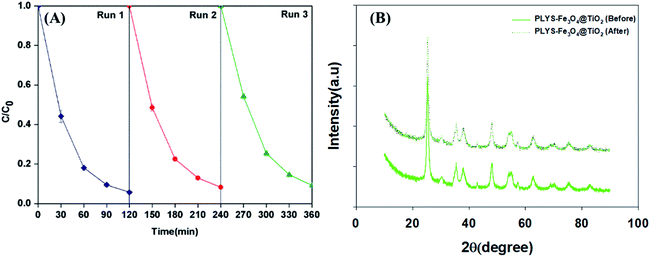
Recyclability is a crucial factor which can affect the catalyst application in economic perspective.43–45 In order to observe the stability, the catalyst was collected by magnetic separation after treatment, washed by deionized water and ethanol respectively, dried at 353 K and was evaluated by BPA degradation under the standard reaction conditions. As shown in Fig. 11(A), the degradation kinetic constant of reused catalyst is 24.2 × 10⁻³, 21.1 × 10⁻³ and 20.3 × 10⁻³ min−1 for the first, second and third run, respectively. In addition, the Fe leaching (Fig. S9†) was less than 0.21 mg L−1 in the whole process. In addition, XRD analysis before and after the reaction of PLYS-Fe3O4@TiO2 catalyst in Fig. 11(B) showed that the characteristics of the catalyst did not change. The results demonstrated that PLYS-Fe3O4@TiO2 may be used as a promising catalyst for BPA degradation because of good recyclability and stability.4. Conclusion
In summary, pea-like yolk–shell structured PLYS-Fe3O4@TiO2 has been successfully synthesized via a combination of kinetics-controlled mechanical force-driven growth and hydrothermal etching assisted crystallization method. And the catalyst was first tested as a heterogeneous photocatalytic photo-Fenton catalyst for BPA degradation, catalyst and H2O2 dose, initial pH and concentration of BPA are important variables on the degradation process.The rate constant of BPA degradation in PLYS-Fe3O4@TiO2/H2O2/UV system was 24.2 × 10⁻³ min−1 (pH = 7). The BPA decomposition rate constant decreased with increasing pH. As a result of studying the rate of decomposition reaction according to the initial concentration of BPA, we found that there is an optimal BPA decomposition rate constant value at a certain concentration. Through the XRD analysis after the cycling experiment and before and after the reaction of the catalyst, the activity of the catalyst was still very stable, indicating that the catalyst had excellent stability and reusability. This study may provide useful information to further develop some effective heterogeneous photocatalytic photo-Fenton catalysts for degradation of organic pollutants.
Conflicts of interest
There are no conflicts to declare.Acknowledgements
This work was financially supported by the Korean Ministry of the Environment as the Subsurface Environment Management (SEM) project (No. 2018002480009 and 20190024800011) and the National Research Foundation (NRF) project (No. 2017R1D1A1B03030079) for the financial support. We gratefully acknowledge the assistance of Dr Dongyuan Zhao, Wei Li and Pengpeng Qiu of Chemistry Department in Fudan University for preparing the materials and valuable discussions.Reference
- W. T. Tsai, J. Environ. Sci. Health, Part C: Environ. Carcinog. Ecotoxicol. Rev., 2006, 24, 225–255 CrossRef CAS.
- I. Bautista-Toledo, M. A. Ferro-García, J. Rivera-Utrilla, C. Moreno-Castilla and F. J. Vegas Fernández, Environ. Sci. Technol., 2005, 39, 6246–6250 CrossRef CAS.
- I. Gültekin and N. H. Ince, J. Environ. Manage., 2007, 85, 816–832 CrossRef.
- S. Wu, H. He, X. Li, C. Yang, G. Zeng, B. Wu, S. He and L. Lu, Chem. Eng. J., 2018, 341, 126–136 CrossRef CAS.
- Y. Lin, S. Wu, C. Yang, M. Chen and X. Li, Appl. Catal., B, 2019, 245, 71–86 CrossRef CAS.
- S. Wu, H. Li, H. He and C. Yang, Chem. Eng. J., 2018, 353, 533–541 CrossRef CAS.
- E. Neyens and J. Baeyens, J. Hazard. Mater., 2003, 98, 33–50 CrossRef CAS.
- S. Caudo, G. Centi, C. Genovese and S. Perathoner, Top. Catal., 2006, 40, 207–219 CrossRef CAS.
- N. Banić, B. Abramović, J. Krstić, D. Šojić, D. Lončarević, Z. Cherkezova-Zheleva and V. Guzsvány, Appl. Catal., B, 2011, 107, 363–371 CrossRef.
- L. Xu and J. Wang, Appl. Catal., B, 2012, 123–124, 117–126 CAS.
- X. Zhang, M. He, J.-H. Liu, R. Liao, L. Zhao, J. Xie, R. Wang, S.-T. Yang, H. Wang and Y. Liu, Chin. Sci. Bull., 2014, 59, 3406–3412 CrossRef CAS.
- S.-T. Yang, W. Zhang, J. Xie, R. Liao, X. Zhang, B. Yu, R. Wu, X. Liu, H. Li and Z. Guo, RSC Adv., 2015, 5, 5458–5463 RSC.
- D. Du, W. Shi, L. Wang and J. Zhang, Appl. Catal., B, 2017, 200, 484–492 CrossRef CAS.
- P. Qiu, W. Li, B. Thokchom, B. Park, M. Cui, D. Zhao and J. Khim, J. Mater. Chem. A, 2015, 3, 6492–6500 RSC.
- P. Qiu, K. Kang, K. Kim, W. Li, M. Cui and J. Khim, RSC Adv., 2015, 5, 96201–96204 RSC.
- P. Qiu, W. Li, K. Kang, B. Park, W. Luo, D. Zhao and J. Khim, J. Mater. Chem. A, 2014, 2, 16452–16458 RSC.
- Y. h. Zheng, Y. Cheng, F. Bao and Y.-s. Wang, Mater. Res. Bull., 2006, 41, 525–529 CrossRef CAS.
- W. Li, J. Yang, Z. Wu, J. Wang, B. Li, S. Feng, Y. Deng, F. Zhang and D. Zhao, J. Am. Chem. Soc., 2012, 134, 11864–11867 CrossRef CAS.
- C. Wang, J. Wei, Q. Yue, W. Luo, Y. Li, M. Wang, Y. Deng and D. Zhao, Angew. Chem., Int. Ed. Engl., 2013, 52, 11603–11606 CrossRef CAS.
- Y. Tang, Y. Zhang, J. Deng, J. Wei, H. Le Tam, B. K. Chandran, Z. Dong, Z. Chen and X. Chen, Adv. Mater., 2014, 26, 6111–6118 CrossRef CAS.
- W. Li, Y. Deng, Z. Wu, X. Qian, J. Yang, Y. Wang, D. Gu, F. Zhang, B. Tu and D. Zhao, J. Am. Chem. Soc., 2011, 133, 15830–15833 CrossRef CAS.
- M. V. Bagal and P. R. Gogate, Ultrason. Sonochem., 2013, 20, 1226–1235 CrossRef CAS.
- J. Madhavan, F. Grieser and M. Ashokkumar, J. Hazard. Mater., 2010, 178, 202–208 CrossRef CAS.
- M. B. Kasiri, H. Aleboyeh and A. Aleboyeh, Appl. Catal., B, 2008, 84, 9–15 CrossRef CAS.
- B. Zhao, G. Mele, I. Pio, J. Li, L. Palmisano and G. Vasapollo, J. Hazard. Mater., 2010, 176, 569–574 CrossRef CAS.
- Z. Huang, P. Wu, B. Gong, S. Yang, H. Li, Z. Zhu and L. Cui, Appl. Surf. Sci., 2016, 370, 209–217 CrossRef CAS.
- Y. Zhu, R. Zhu, Y. Xi, T. Xu, L. Yan, J. Zhu, G. Zhu and H. He, Chem. Eng. J., 2018, 346, 567–577 CrossRef CAS.
- Y. Liu, Y. Mao, X. Tang, Y. Xu, C. Li and F. Li, Chin. J. Catal., 2017, 38, 1726–1735 CrossRef CAS.
- T. T. N. Phan, A. N. Nikoloski, P. A. Bahri and D. Li, J. Ind. Eng. Chem., 2018, 61, 53–64 CrossRef CAS.
- M. Huang, C. Xu, Z. Wu, Y. Huang, J. Lin and J. Wu, Dyes Pigm., 2008, 77, 327–334 CrossRef CAS.
- U. G. Akpan and B. H. Hameed, J. Hazard. Mater., 2009, 170, 520–529 CrossRef CAS.
- A. Cihanoğlu, G. Gündüz and M. Dükkancı, Appl. Catal., B, 2015, 165, 687–699 CrossRef.
- J. Feng, X. Hu, P. L. Yue, H. Y. Zhu and G. Q. Lu, Water Res., 2003, 37, 3776–3784 CrossRef CAS.
- J. Herney-Ramirez, M. A. Vicente and L. M. Madeira, Appl. Catal., B, 2010, 98, 10–26 CrossRef CAS.
- L. Xu and J. Wang, Environ. Sci. Technol., 2012, 46, 10145–10153 CrossRef CAS.
- H. Chen, Z. Zhang, Z. Yang, Q. Yang, B. Li and Z. Bai, Chem. Eng. J., 2015, 273, 481–489 CrossRef CAS.
- W. Shi, D. Du, B. Shen, C. Cui, L. Lu, L. Wang and J. Zhang, ACS Appl. Mater. Interfaces, 2016, 8, 20831–20838 CrossRef CAS.
- Q. Sun, Y. Hong, Q. Liu and L. Dong, Appl. Surf. Sci., 2018, 430, 399–406 CrossRef CAS.
- H. E. Kim, J. Lee, H. Lee and C. Lee, Appl. Catal., B, 2012, 115–116, 219–224 CrossRef CAS.
- A. Babuponnusami and K. Muthukumar, J. Environ. Chem. Eng., 2014, 2, 557–572 CrossRef CAS.
- L. Clarizia, D. Russo, I. Di Somma, R. Marotta and R. Andreozzi, Appl. Catal., B, 2017, 209, 358–371 CrossRef CAS.
- I. R. Bautitz and R. F. P. Nogueira, J. Photochem. Photobiol., A, 2007, 187, 33–39 CrossRef CAS.
- R. Liu, Y. Xu and B. Chen, Environ. Sci. Technol., 2018, 52, 7043–7053 CrossRef CAS.
- X. Hu, B. Liu, Y. Deng, H. Chen, S. Luo, C. Sun, P. Yang and S. Yang, Appl. Catal., B, 2011, 107, 274–283 CrossRef CAS.
- H. Dai, S. Xu, J. Chen, X. Miao and J. Zhu, Chemosphere, 2018, 199, 147–153 CrossRef CAS.
Footnote |
| † Electronic supplementary information (ESI) available. See DOI: 10.1039/c9ra04084f |
| This journal is © The Royal Society of Chemistry 2019 |


